My favorite sister was killed when she played chicken for three minutes, but she could not run away and died of blood loss in the middle of the road. She was sniped by bullets in an unknown direction while standing in the grass.
What else can I do - save her with what I've learned all my life, of course! __________
Where is the safest jump?
Where to jump has always been a tangled issue. A good jump can not only get enough weapons and materials, but also improve the survival probability. Of course, the luckiest thing is to become the "son of choice".
After sifting through 460,000 data that players were killed within three minutes of the game's start, I drew it out.

_Alenger Map of the Jedi Islands
The redder the picture is, the place with the highest number of deaths in the first three minutes. It can be seen that Rozhok and the vicinity of schools and military bases are the places with the highest incidences of initial deaths due to the large number of material jumpers, and Bunkers and Rater, Georgopol and hospitals, and GunRange.

_Map of Mirama in the Passionate Desert
If you want to improve your survival rate (except for those who want to practice skills), especially novices, you should avoid these places and jump better.
After all, I prefer to jump safely with my teammates, look for guns, and drive a car to enjoy the scenery on the road when poisoning comes.
Focus: Pecado, San Martin and Power Grid are the most dangerous areas for the start.
Attachment: The code is as follows
1import numpy as np

2import matplotlib.pyplot as plt

3import pandas as pd

4import seaborn as sns

5from scipy.misc.pilutil import imread

6import matplotlib.cm as cm

7

8#Import partial data

9deaths1 = pd.read_csv("deaths/kill_match_stats_final_0.csv")

10deaths2 = pd.read_csv("deaths/kill_match_stats_final_1.csv")

11

12deaths = pd.concat([deaths1, deaths2])

13

14#Print the first five columns to understand variables

15print (deaths.head(),'\n',len(deaths))

16

17#Two maps

18miramar = deaths[deaths["map"] == "MIRAMAR"]

19erangel = deaths[deaths["map"] == "ERANGEL"]

20

21#Thermodynamic chart of death 100 seconds before the start

22position_data = ["killer_position_x","killer_position_y","victim_position_x","victim_position_y"]

23for position in position_data:

24 miramar[position] = miramar[position].apply(lambda x: x*1000/800000)

25 miramar = miramar[miramar[position] != 0]

26

27 erangel[position] = erangel[position].apply(lambda x: x*4096/800000)

28 erangel = erangel[erangel[position] != 0]

29

30n = 50000

31mira_sample = miramar[miramar["time"] < 100].sample(n)

32eran_sample = erangel[erangel["time"] < 100].sample(n)

33

34# miramar thermogram

35bg = imread("miramar.jpg")

36fig, ax = plt.subplots(1,1,figsize=(15,15))

37ax.imshow(bg)

38sns.kdeplot(mira_sample["victim_position_x"], mira_sample["victim_position_y"],n_levels=100, cmap=cm.Reds, alpha=0.9)

39

40# erangel thermogram

41bg = imread("erangel.jpg")

42fig, ax = plt.subplots(1,1,figsize=(15,15))

43ax.imshow(bg)

44sns.kdeplot(eran_sample["victim_position_x"], eran_sample["victim_position_y"],
Second items
I should stick to it.
Or should we go out and work hard?
Is there an area that has always been safe? Can't you just hide after you find the weapon?
Chill! Shall we have a look at the picture?
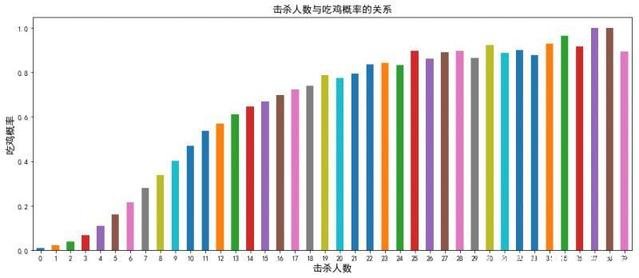
This is a graph of the relationship between the number of people killed and the probability of eating chicken. It can be clearly seen that the probability of eating chicken is proportional to the number of people killed. To get the probability of eating chicken more than 30% requires at least 7 people to be killed, the probability of eating chicken for 10 people is 50%, and the probability of eating chicken for 15 people is 75%.
Therefore, if you want to eat chicken every day, it is impossible to hide in one place. The best way is to practice more and improve killing skills.
Attachment: The code is as follows
1library(dplyr)

2library(tidyverse)

3library(data.table)

4library(ggplot2)

5pubg_full <- fread("../agg_match_stats.csv")

6# Average number of enemies killed by chicken-eating teams

7attach(pubg_full)

8pubg_winner <- pubg_full %>% filter(team_placement==1&party_size<4&game_size>90)

9detach(pubg_full)

10team_killed <- aggregate(pubg_winner$player_kills, by=list(pubg_winner$match_id,pubg_winner$team_id), FUN="mean")

11team_killed$death_num <- ceiling(team_killed$x)

12ggplot(data = team_killed) + geom_bar(mapping = aes(x = death_num, y = ..count..), color="steelblue") +

13 xlim(0,70) + labs(title = "Number of Death that PUBG Winner team Killed", x="Number of death")

14

15# Number of killings by the last surviving player of the chicken-eating team

16pubg_winner <- pubg_full %>% filter(pubg_full$team_placement==1) %>% group_by(match_id,team_id)

17attach(pubg_winner)

18team_leader <- aggregate(player_survive_time~player_kills, data = pubg_winner, FUN="max")

19detach(pubg_winner)

20

21# Number of Chicken Eating Teams Killing the Most Enemy

22pubg_winner <- pubg_full %>% filter(pubg_full$team_placement==1&pubg_full$party_size>1)

23attach(pubg_winner)

24team_leader <- aggregate(player_kills, by=list(match_id,team_id), FUN="max")

25detach(pubg_winner)

26ggplot(data = team_leader) + geom_bar(mapping = aes(x = x, y = ..count..), color="steelblue") +

27 xlim(0,70) + labs(title = "Number of Death that PUBG Winner Killed", x="Number of death")
Third items
Which weapon killed more people?
Do you hesitate to choose a good weapon when you are lucky enough to pick one?
From the two maps of islands and deserts, we can see that M416 automatic rifle ranks first in the 10 weapons statistics maps with the largest number of killers, whether in islands or deserts, followed by SCAR-L, M16A4 and AKM automatic rifles. The top four killers are automatic rifles, and 5.56 mm bullets are the only ones in the world. The fifth place is UMP9 submachine gun and the sixth place is S1897 shotgun.
1#Homicidal Weapons Ranking

2death_causes = deaths['killed_by'].value_counts()

3

4sns.set_context('talk')

5fig = plt.figure(figsize=(30, 10))

6ax = sns.barplot(x=death_causes.index, y=[v / sum(death_causes) for v in death_causes.values])

7ax.set_title('Rate of Death Causes')

8ax.set_xticklabels(death_causes.index, rotation=90)

9

10#Top 20 Weapons

11rank = 20

12fig = plt.figure(figsize=(20, 10))

13ax = sns.barplot(x=death_causes[:rank].index, y=[v / sum(death_causes) for v in death_causes[:rank].values])

14ax.set_title('Rate of Death Causes')

15ax.set_xticklabels(death_causes.index, rotation=90)

16

17#Two maps are taken separately

18f, axes = plt.subplots(1, 2, figsize=(30, 10))

19axes[0].set_title('Death Causes Rate: Erangel (Top {})'.format(rank))

20axes[1].set_title('Death Causes Rate: Miramar (Top {})'.format(rank))

21

22counts_er = erangel['killed_by'].value_counts()

23counts_mr = miramar['killed_by'].value_counts()

24

25sns.barplot(x=counts_er[:rank].index, y=[v / sum(counts_er) for v in counts_er.values][:rank], ax=axes[0] )

26sns.barplot(x=counts_mr[:rank].index, y=[v / sum(counts_mr) for v in counts_mr.values][:rank], ax=axes[1] )

27axes[0].set_ylim((0, 0.20))

28axes[0].set_xticklabels(counts_er.index, rotation=90)

29axes[1].set_ylim((0, 0.20))

30axes[1].set_xticklabels(counts_mr.index, rotation=90)

31

32#The relationship between eating chicken and weapons

33win = deaths[deaths["killer_placement"] == 1.0]

34win_causes = win['killed_by'].value_counts()

35

36sns.set_context('talk')

37fig = plt.figure(figsize=(20, 10))

38ax = sns.barplot(x=win_causes[:20].index, y=[v / sum(win_causes) for v in win_causes[:20].values])

39ax.set_title('Rate of Death Causes of Win')

40ax.set_xticklabels(win_causes.index, rotation=90)
Fourth items
Did my teammate's assists help me eat chicken?
The team that chooses to eat chicken successfully here has a 29% chance of eventually receiving one helping.
The number of assists is also proportional to the probability of eating chicken. The probability of eating chicken for five assists is 50%, and the probability of locking chicken for more than 11 assists is 50%.
So * pig mates are important.
Attachment: The code is as follows
1library(dplyr)

2library(tidyverse)

3library(data.table)

4library(ggplot2)

5pubg_full <- fread("E:/aggregate/agg_match_stats_0.csv")

6attach(pubg_full)

7pubg_winner <- pubg_full %>% filter(team_placement==1)

8detach(pubg_full)

9ggplot(data = pubg_winner) + geom_bar(mapping = aes(x = player_assists, y = ..count..), fill="#E69F00") +

10 xlim(0,10) + labs(title = "Number of Player assisted", x="Number of death")

11ggplot(data = pubg_winner) + geom_bar(mapping = aes(x = player_assists, y = ..prop..), fill="#56B4E9") +

12 xlim(0,10) + labs(title = "Number of Player assisted", x="Number of death")
The fifth poison is coming. What if I can't get away with it?

In the subsequent cause of death analysis found that the player died of Bluezone is also a very high cause of death, that is, poisoned death.
Running alone is often not toxic.
The people with cars can be really handsome! Looking at the picture above, the probability of eating chicken without a ride is 0.007, while the probability of eating chicken with a ride is 0.058. That is to say, having a car can increase the probability of eating chicken eight times!
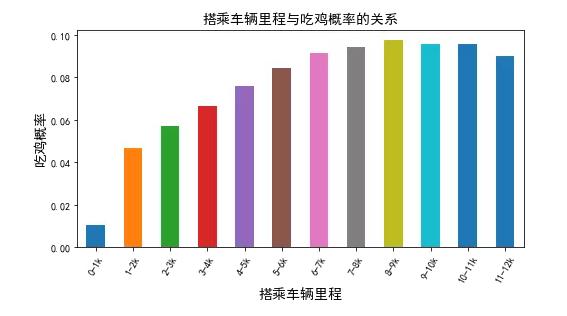
As can be seen from the picture above, the probability of eating chicken is the highest when you ride 8-9 kilometres in a car (the length and width of Allen's map on the Jedi Islands are 8 kilometres). The decrease of probability over 9 km indicates that the car is an obvious moving target. It is unsafe to stay on the car for a long time. It is best to take the car when needed.
No. 6 What weapons are suitable for close combat?
Most of the time, we are faced with close combat. What weapons kill the most people in close combat?

_Allenger, Jedi Islands (8 million statistics)

_Enthusiastic Desert Mirama (1.76 million statistics)
It can be seen that in the island map, shotgun S1897 replaced automatic rifle M416 as the largest number of guns killed. Then came the M416, AKM, M16A4, SCAR-L series of automatic rifles, but in the desert map, M416 is still the main weapon in close combat. Of course, Punch is on the list of both maps. It seems that when necessary, fists need not be reasonable, haha.
What weapons are suitable for sniping?
Sniping at distant visitors on the hill and hiding in the window of the house is also an important way to kill the enemy. So what kind of weapon can kill the most people?
_Allenger, Jedi Islands (sniper distance over 800 meters)
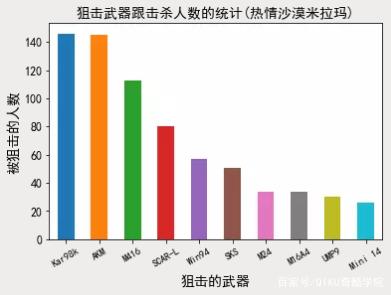
_Warm Desert Miramar (sniping distance over 800 meters)
As you can see, compare with close combat, few people can snipe targets beyond 800 meters. In island mode, the main force of sniping over 800 meters is still a series of automatic rifles such as AKM, so automatic rifles will be your best equipment. In the desert model, Kar98k, a single-haired sniper, begin to show his power, ranking first.SKS is the most useful among snipers.
Finally, the top 10 killers in the islands and deserts are mapped as a percentage area of killing within 800 meters from each distance. It can be said that if you understand this map, you can make a good choice in the choice of weapons.
It can be seen that submachine gun UMP9, shotgun S1897 and so on are only suitable for close combat, single-shot sniper Kar98k is a good long-range sniper gun. In the island, the automatic rifle M416, M16A4, SCAR-L, AKM are suitable for all kinds of distance operations (provided that the accessories are complete). In the desert, M416 and SCAR-L are suitable for various range operations.
Where is the last poison ring?
Where will the last poison ring appear? Where is the higher probability? Can't we find a safe and probable place to be the "son of the man" in the final poison circle and lie down to win by combining the above opening dangerous zone map?
The picture above shows the location of the poison ring at the end of each match. It can be seen that compared with the dangerous area map above, the poison ring appears in a much more dispersed position, almost everywhere possible. However, it can be seen that the areas southeast of Pochinki East Hill, at the foot of the northern mountains and south of Yasnaya Polyana are the areas with the highest frequency of the last toxic circle.
In addition, it can be known that the probability of the last poisonous circle appearing in the offshore and offshore areas is relatively small, so if the large circle includes rivers and seashores at the end of the year, then it can be estimated that the last poisonous circle should be in the opposite direction of rivers and seashores.
The final battlefields of the desert are scattered, but much more concentrated than the islands. The most probabilistic areas are the area between Los Leones and La Bendita, the area around Monte Nuevo and Pecado. It's basically impossible to be the last poison ring around and outside a large circle of highways. So if you circle around these places, you're right to run in.
The code is as follows:
1#Final poison ring position

2import matplotlib.pyplot as plt

3import pandas as pd

4import seaborn as sns

5from scipy.misc.pilutil import imread

6import matplotlib.cm as cm

7

8#Import partial data

9deaths = pd.read_csv("deaths/kill_match_stats_final_0.csv")

10#Import aggregate data

11aggregate = pd.read_csv("aggregate/agg_match_stats_0.csv")

12print(aggregate.head())

13#Find out where the last three people died.

14

15team_win = aggregate[aggregate["team_placement"]==1] #Top ranking team

16#Find out the player who lives the longest for the first team in each competition.

17grouped = team_win.groupby('match_id').apply(lambda t: t[t.player_survive_time==t.player_survive_time.max()])

18

19deaths_solo = deaths[deaths['match_id'].isin(grouped['match_id'].values)]

20deaths_solo_er = deaths_solo[deaths_solo['map'] == 'ERANGEL']

21deaths_solo_mr = deaths_solo[deaths_solo['map'] == 'MIRAMAR']

22

23df_second_er = deaths_solo_er[(deaths_solo_er['victim_placement'] == 2)].dropna()

24df_second_mr = deaths_solo_mr[(deaths_solo_mr['victim_placement'] == 2)].dropna()

25print (df_second_er)

26

27position_data = ["killer_position_x","killer_position_y","victim_position_x","victim_position_y"]

28for position in position_data:

29 df_second_mr[position] = df_second_mr[position].apply(lambda x: x*1000/800000)

30 df_second_mr = df_second_mr[df_second_mr[position] != 0]

31

32 df_second_er[position] = df_second_er[position].apply(lambda x: x*4096/800000)

33 df_second_er = df_second_er[df_second_er[position] != 0]

34

35df_second_er=df_second_er

36# erangel thermogram

37sns.set_context('talk')

38bg = imread("erangel.jpg")

39fig, ax = plt.subplots(1,1,figsize=(15,15))

40ax.imshow(bg)

41sns.kdeplot(df_second_er["victim_position_x"], df_second_er["victim_position_y"], cmap=cm.Blues, alpha=0.7,shade=True)

42

43# miramar thermogram

44bg = imread("miramar.jpg")

45fig, ax = plt.subplots(1,1,figsize=(15,15))

46ax.imshow(bg)

47sns.kdeplot(df_second_mr["victim_position_x"], df_second_mr["victim_position_y"], cmap=cm.Blues,alpha=0.8,shade=True)
All right, that's all.
In order to help small partners learn Python better, we organize Python related learning videos and learning roadmap, and add learning groups. [Python Learning] It is available.