This is an article from Ali's internal technical forum, the original text has been well received in Ali.The author has opened this article to the cloud community for outside access.Hollis has partially deleted the content of the article, mainly deleting the introduction of tools that can only be used inside Ali, and deleting some links that can only be accessed through Ali's intranet.
Preface
Usually, I often encounter a lot of troubleshooting problems in my work. While solving problems, some tools play a considerable role. Write them down here, first as notes, so that I can forget to flip through them quickly in the future. Second, share them. Students who wish to see this article can take out tools that they feel very helpful in daily life, and everyone can progress together.
Say nothing but gossip.
Linux Command Class
tail
Most commonly used tail-f
tail -300f shopbase.log #300 lines down and into real-time listening file writing mode
grep
grep forest f.txt     #File Lookup
grep forest f.txt cpf.txt #Multi-file lookup
grep 'log' /home/admin -r -n #Find all keyword-matching files in the directory
cat f.txt | grep -i shopbase
grep 'shopbase' /home/admin -r -n --include *.{vm,java} #Specify File Suffix
grep 'shopbase' /home/admin -r -n --exclude *.{vm,java} #Inverse matching
seq 10 | grep 5 -A 3    #Top Match
seq 10 | grep 5 -B 3    #Down Match
seq 10 | grep 5 -C 3    #Match up and down, and use this normally
cat f.txt | grep -c 'SHOPBASE'
awk
1 Basic Command
awk '{print $4,$6}' f.txt
awk '{print NR,$0}' f.txt cpf.txt
awk '{print FNR,$0}' f.txt cpf.txt
awk '{print FNR,FILENAME,$0}' f.txt cpf.txt
awk '{print FILENAME,"NR="NR,"FNR="FNR,"$"NF"="$NF}' f.txt cpf.txt
echo 1:2:3:4 | awk -F: '{print $1,$2,$3,$4}'
2 Match
awk '/ldb/ {print}' f.txt   #Match ldb
awk '!/ldb/ {print}' f.txt  #Unmatched ldb
awk '/ldb/ && /LISTEN/ {print}' f.txt   #Match ldb with LISTEN
awk '$5 ~ /ldb/ {print}' f.txt #Column 5 matches ldb
3 Built-in variables
NR:NR stands for the number of times data has been read by the record delimiter since the start of awk. The default record delimiter is a line break, so the default is the number of rows read. NR can be understood as the abbreviation Number of Record.
FNR: When awk processes multiple input files, after the first file is processed, the NR does not start from 1, but continues to accumulate, so FNR appears. Each time a new file is processed, the FNR starts counting from 1. FNR can be interpreted as File Number of Record.
NF: NF represents the number of fields that the current record is split into, and NF can be interpreted as Number of Field.
find
sudo-u admin find/home/admin/tmp/usr-name \*.log (multiple directories to find)
find. -iname \*.txt (case matches)
find. -type D (all subdirectories under the current directory)
find/usr-type L (all symbolic links in the current directory)
find/usr-type l-name "z*" -ls (symbolic link details eg:inode, directory)
find/home/admin-size +250000k (files over 250000k, of course +change-are smaller)
find/home/admin f-perm 777-exec ls-l {} ;; (query files according to permissions)
find/home/admin-atime-1 Files accessed in 1 day
 find/home/admin-ctime-1 Files with changed state in 1 day
 find/home/admin-mtime-1 Files modified in 1 day
 find/home/admin-amin-1 Files accessed in 1 minute
 find/home/admin-cmin-1 Files with changed state in 1 minute
 find/home/admin-mmin-1 Files modified in 1 minute
pgm
Batch query vm-shopbase satisfied log
pgm -A -f vm-shopbase 'cat /home/admin/shopbase/logs/shopbase.log.2017-01-17|grep 2069861630'
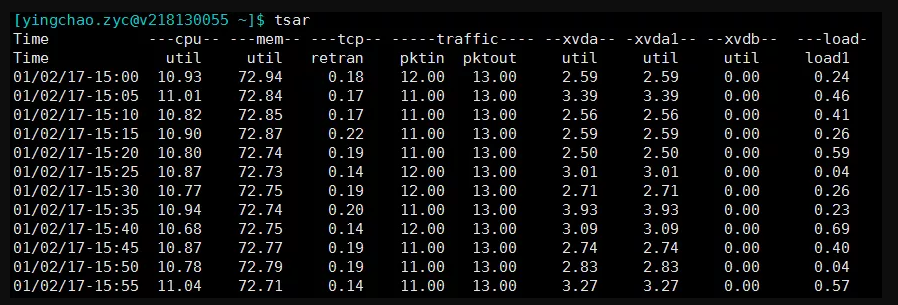
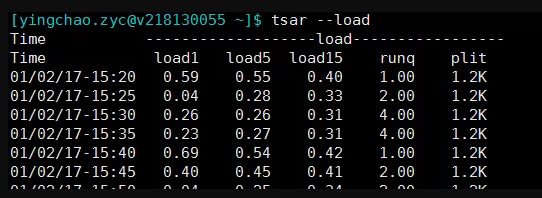
tsar
tsar is our own collection tool.Very good, persist the data collected by history on disk, so we can quickly query the system data of history.Of course, real-time applications can also be queried.Most machines are installed.
tsar ###You can view indicators for the last day
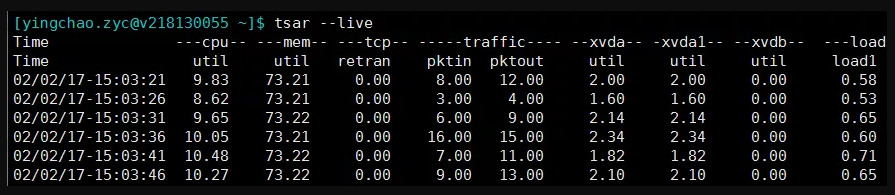
tsar --live ###Real-time metrics can be viewed, with a default brush of five seconds
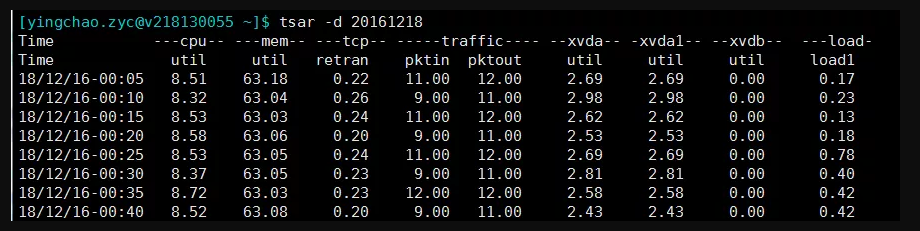
tsar -d 20161218 ###Specify to view data for one day, seemingly for up to four months
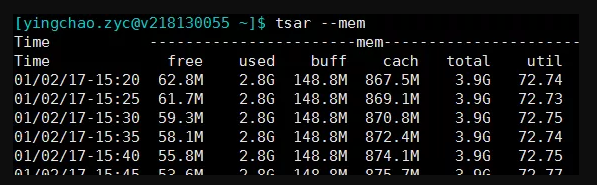
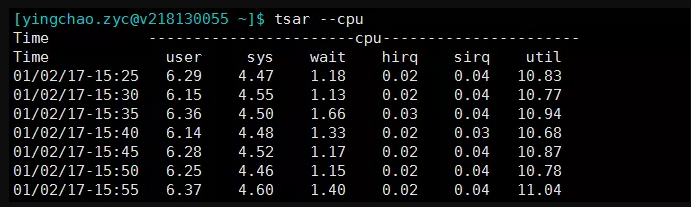
tsar --mem
tsar --load
tsar --cpu
###This, of course, can also be used with the -d parameter to query a single indicator for a given day.
top
top, in addition to looking at some basic information, is all about working together to query vm's various problems
ps -ef | grep java
top -H -p pid
Get the jstack of the thread from 10 to 16 to see what the thread is doing
Other
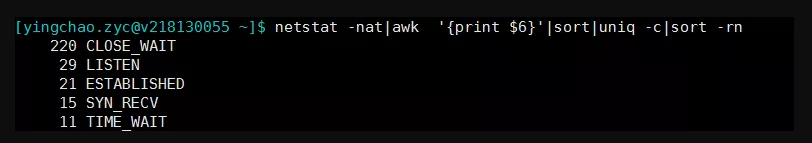
netstat -nat|awk  '{print $6}'|sort|uniq -c|sort -rn
#Look at the current connection and note that close_wait is high, such as the following
Searching sharp instruments
btrace
The first thing to mention is btrace.It's a real production environment - a big killer of pre-emptive troubleshooting.Say nothing about the introduction.Code dry directly
1. See who is calling the add method of ArrayList and print only the thread call stack with size greater than 500 for the current ArrayList
@OnMethod(clazz = "java.util.ArrayList", method="add", location = @Location(value = Kind.CALL, clazz = "/.*/", method = "/.*/"))
public static void m(@ProbeClassName String probeClass, @ProbeMethodName String probeMethod, @TargetInstance Object instance, @TargetMethodOrField String method) {
   if(getInt(field("java.util.ArrayList", "size"), instance) > 479){
       println("check who ArrayList.add method:" + probeClass + "#" + probeMethod  + ", method:" + method + ", size:" + getInt(field("java.util.ArrayList", "size"), instance));
       jstack();
       println();
       println("===========================");
       println();
   }
}
2. Monitor the values returned when the current service method is invoked and the parameters requested
@OnMethod(clazz = "com.taobao.sellerhome.transfer.biz.impl.C2CApplyerServiceImpl", method="nav", location = @Location(value = Kind.RETURN))
public static void mt(long userId, int current, int relation, String check, String redirectUrl, @Return AnyType result) {
   println("parameter# userId:" + userId + ", current:" + current + ", relation:" + relation + ", check:" + check + ", redirectUrl:" + redirectUrl + ", result:" + result);
}
For more information, please go to https://github.com/btraceio/btrace
Be careful:
-
After observation, the release output of 1.3.9 is unstable and needs to be triggered several times to see the correct result
-
Range must be controlled when the regular expression matches the trace class, otherwise it is very likely that overrunning the CPU will result in application card death
-
Since it is the principle of byte code injection, you need to restart the application to get it back to normal.
Greys
Say a few great features (some overlap with btrace):
SC-DF xxx: Output details of the current class, including source location and classloader structure
trace class method: I really like this feature! JProfiler saw it earlier.Print out the time-consuming state of the current method call, subdividing it into each method.
javOSize
Just one function
classes: By modifying the byte code, the contents of the class are changed and take effect immediately.So you can quickly log somewhere to see the output, but the disadvantage is that the code is too intrusive.But if you know what you're doing, it's a good idea.
Other features Greys and btrace can be easily done, let alone say.
JProfiler
Previously, many of the issues were identified through JProfiler, but now Greys and btrace are basically done.Plus, the problem is basically a production environment (network isolation), so it's rarely used, but it should be marked.
Official website please go to https://www.ej-technologies.com/products/jprofiler/overview.html
Big Killer
eclipseMAT
It can be used as a plug-in to eclipse or as a separate program.(
Please go to http://www.eclipse.org/mat/
java three-board axe, oh no, seven
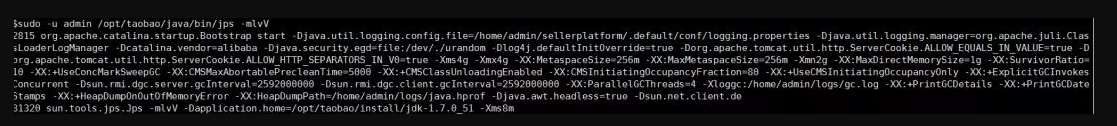
jps
I only use one command:
sudo -u admin /opt/taobao/java/bin/jps -mlvV
jstack
Common usage:
sudo -u admin /opt/taobao/install/ajdk-8_1_1_fp1-b52/bin/jstack 2815
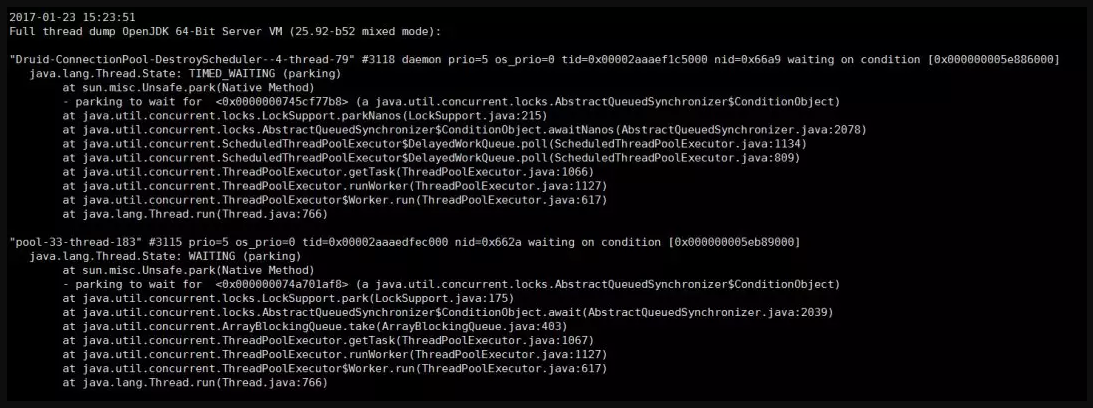
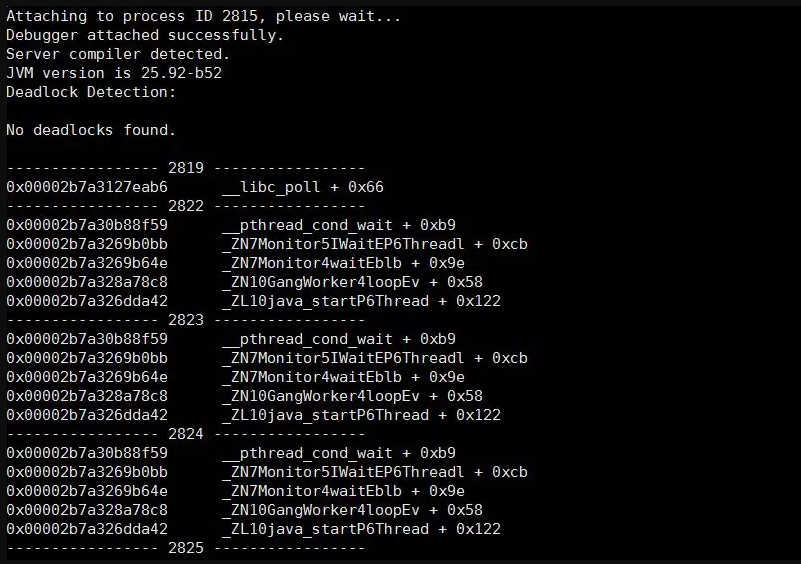
native+java stack:
sudo -u admin /opt/taobao/install/ajdk-8_1_1_fp1-b52/bin/jstack -m 2815
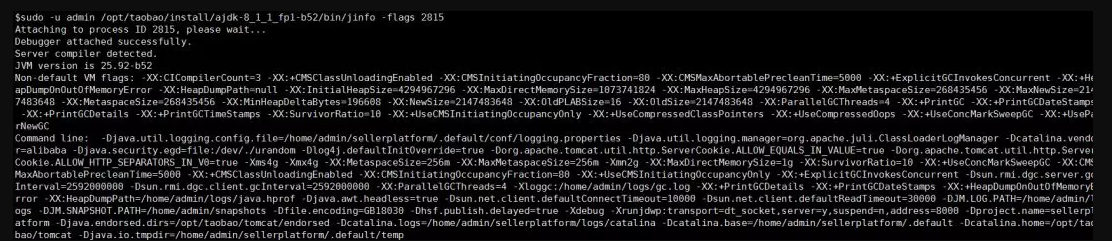
jinfo
You can see the system start parameters as follows
sudo -u admin /opt/taobao/install/ajdk-8_1_1_fp1-b52/bin/jinfo -flags 2815
jmap
Two purposes
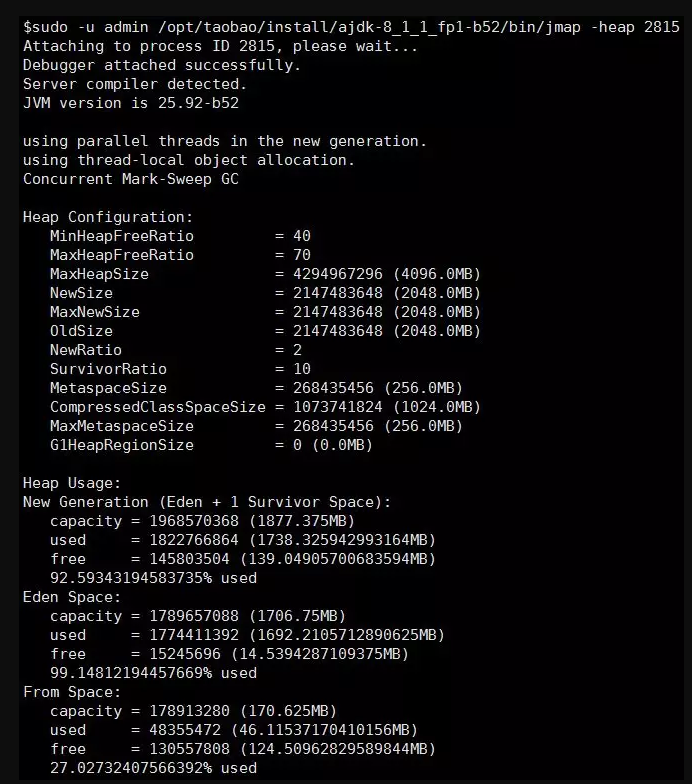
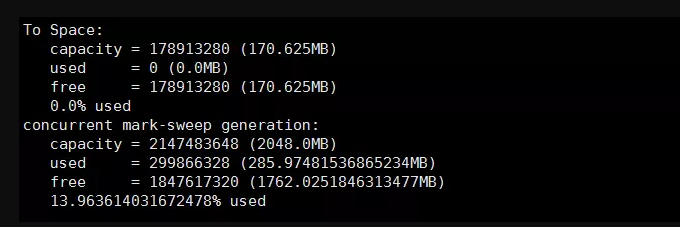
1. View the heap
sudo -u admin /opt/taobao/install/ajdk-8_1_1_fp1-b52/bin/jmap -heap 2815
2.dump
sudo -u admin /opt/taobao/install/ajdk-8_1_1_fp1-b52/bin/jmap -dump:live,format=b,file=/tmp/heap2.bin 2815
perhaps
sudo -u admin /opt/taobao/install/ajdk-8_1_1_fp1-b52/bin/jmap -dump:format=b,file=/tmp/heap3.bin 2815
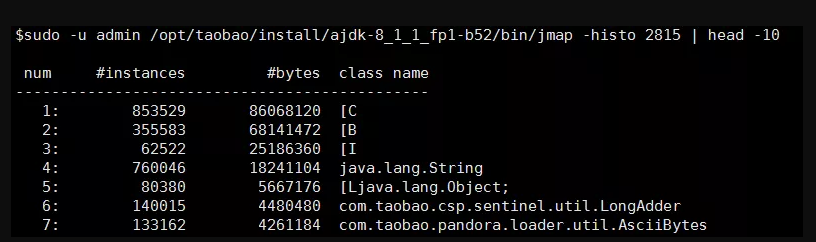
3. See who's taking up the heap? Together with zprofiler and btrace, troubleshooting is just as useful
sudo -u admin /opt/taobao/install/ajdk-8_1_1_fp1-b52/bin/jmap -histo 2815 | head -10
jstat
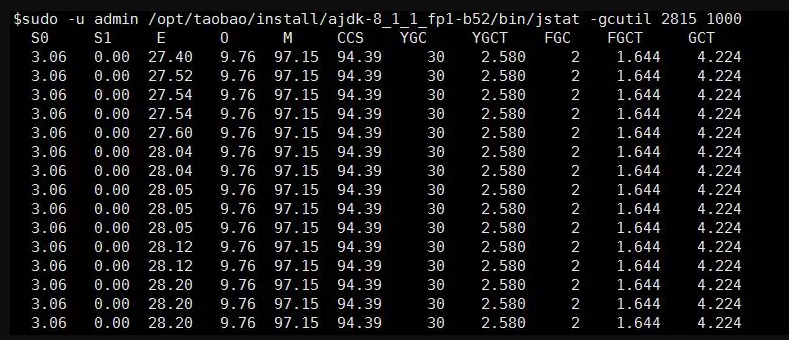
There are many jstat parameters, but one is enough
sudo -u admin /opt/taobao/install/ajdk-8_1_1_fp1-b52/bin/jstat -gcutil 2815 1000
jdb
jdb is also commonly used today.(
jdb can be used to pre-issue debug, assuming that your pre-ordered java_home is/opt/taobao/java/, and the remote debugging port is 8000.
sudo -u admin /opt/taobao/java/bin/jdb -attach 8000.
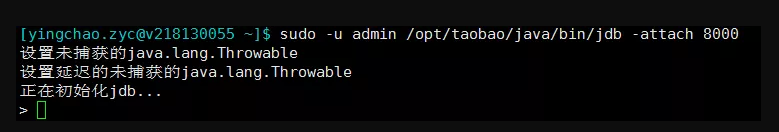
The above indicates that jdb started successfully.Breakpoints can then be set for debugging.
Specific parameters can be found in the Oracle official description http://docs.oracle.com/javase/7/docs/technotes/tools/windows/jdb.html
CHLSDB
CHLSDB feels like it can see something more interesting in many cases, not described in detail.Query materials heard that tools such as jstack and jmap are based on it.
sudo -u admin /opt/taobao/java/bin/java -classpath /opt/taobao/java/lib/sa-jdi.jar sun.jvm.hotspot.CLHSDB
More detailed visible R large sticker
http://rednaxelafx.iteye.com/blog/1847971
plugin of intellij idea
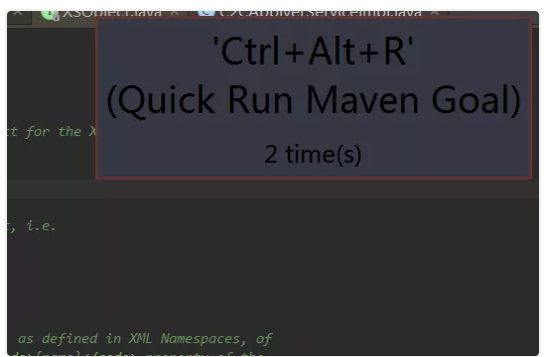
key promoter
Shortcut keys once you can't remember, how many times can you always remember them?
maven helper
A helper for analyzing maven dependencies.
VM options
1. From which file did your class load?
-XX:+TraceClassLoading
 The result looks like [Loaded java.lang.invoke.MethodHandleImpl$Lazy from D:\program\jdk\jdk8U74\jrelib\rt.jar]
2. The application hung the output dump file
-XX:+HeapDumpOnOutOfMemoryError -XX:HeapDumpPath=/home/admin/logs/java.hprof
jar package conflict
Don't overwrite this single headline?Everyone has handled this annoying case more or less.How come I can't fix you if I don't believe so many options below?
mvn dependency:tree > ~/dependency.txt
Play All Dependencies
mvn dependency:tree -Dverbose -Dincludes=groupId:artifactId
Type only the dependencies of the specified groupId and artifactId
-XX:+TraceClassLoading
vm startup script joined.Details of loading classes are visible in the tomcat startup script
-verbose
vm startup script joined.Details of loading classes are visible in the tomcat startup script
greys:sc
The sc command for greys can also clearly see where the current class was loaded from
tomcat-classloader-locate
The following URLs tell you where the current class was loaded
curl http://localhost:8006/classloader/locate?class=org.apache.xerces.xs.XSObjec
Other
dmesg
If you find that your java processes have disappeared silently, leaving little clue behind, there's a good chance that you'll want dmesg to do what you want.
sudo dmesg|grep -i kill|less
To find the keyword oom_killer.The results are similar to the following:
[6710782.021013] java invoked oom-killer: gfp_mask=0xd0, order=0, oom_adj=0, oom_scoe_adj=0
[6710782.070639] [<ffffffff81118898>] ? oom_kill_process+0x68/0x140
[6710782.257588] Task in /LXC011175068174 killed as a result of limit of /LXC011175068174
[6710784.698347] Memory cgroup out of memory: Kill process 215701 (java) score 854 or sacrifice child
[6710784.707978] Killed process 215701, UID 679, (java) total-vm:11017300kB, anon-rss:7152432kB, file-rss:1232kB
The above shows that the corresponding java process was killed by the OOM Killer of the system with a score of 854.
Explain the OOM killer, which monitors the machine's memory consumption.Before the machine runs out of memory, the mechanism scans all the processes (according to certain rules, memory usage, time, etc.), picks out the process with the highest score, and kills it to protect the machine.
dmesg log time conversion formula:
log Actual Time = Greenwich 1970-01-01+ (Current Time Seconds - Seconds Since System Startup + log Time for dmesg Printing) Seconds:
date -d "1970-01-01 UTC `echo "$(date +%s)-$(cat /proc/uptime|cut -f 1 -d' ')+12288812.926194"|bc ` seconds"
The rest is to see why the memory is so large that OOM-Killer is triggered.
New Skills get
RateLimiter
Want fine-grained control over QPS? For example, in a scenario where you call an interface and the other party explicitly needs you to limit your QPS to less than 400 how do you control it?This is where RateLimiter comes in.Details can be moved to http://ifeve.com/guava-ratelimite