This article is suitable for programmers with programming experience. It is a machine learning "Hello world!" People who don't have much theoretical knowledge should take a detour.
Preface
Artificial intelligence is undoubtedly one of the hottest technical topics in recent years. The artificial intelligence technology represented by machine learning has gradually penetrated into all aspects of our lives. As long as anything touches the edge of machine learning, it seems that it will become a big thing. As programmers in the tide of technology, we are so close to machine learning, but
"Only in this mountain, where the clouds are deep.".
Why Java/Kotlin?
There is no denying that Python is the mainstream language in machine learning, but in my actual machine learning project, Python is suitable for algorithm research, and its stability and ecology are difficult to support a large application. With the flow of a series of java components such as Spark and dl4j, it can be predicted that java will be the mainstream platform for large machine learning applications.
It can be seen that the application of machine learning technology is one of the core capabilities of Java programmers in the future, but as programmers, how to start machine learning? In this paper, we put aside the complicated concepts in machine learning and start to practice the most representative clustering algorithm in machine learning.
Yes, I lied to you in the name of Java, but I believe that people with good java foundation have no problem reading the following Kotlin code, and the following code can also be translated into Java code, which is just a very meaningful exercise. The reason why the example code in this article uses Kotlin is that Kotlin can express my phase method more succinctly and has perfect compatibility with Java.
Unique background knowledge
Machine learning has numerous classifications and specific methods. Clustering algorithm or K-means clustering is undoubtedly the most representative unsupervised learning method. It is as simple as many ordinary statistical algorithms, but it also has the ability of training and prediction. It is very close to in-depth learning and is an excellent algorithm for entry-level machine learning.
In this paper, the author's own language is used to explain K-means
An automatic classification algorithm: a group of objects with similar numerical attributes are classified into K categories. Through continuous iterations, the data in the categories have the greatest similarity and the categories can distinguish each other to the greatest extent.
Through simple clustering algorithm, we can:
- Instead of manual, it can classify massive user data more quickly and automatically;
- According to the results of automatic clustering, potential rules are found, such as: the father who buys diapers often buys himself several more bottles of beer;
- By clustering results, new data can be classified or predicted more quickly. For example, by using historical data clustering results as a model, disease risk of someone can be predicted quickly according to physical examination data;
- Speed up the search speed of high-dimensional data, such as: clustering the gallery according to the depth characteristics of pictures, so as to quickly find the commodity set with the highest similarity from hundreds of millions of pictures through hierarchical search (similar to Baidu soutu, Taobao pailitao)
Use the comparison chart of clustering algorithm in Apache Commons Math document to understand what clustering does:
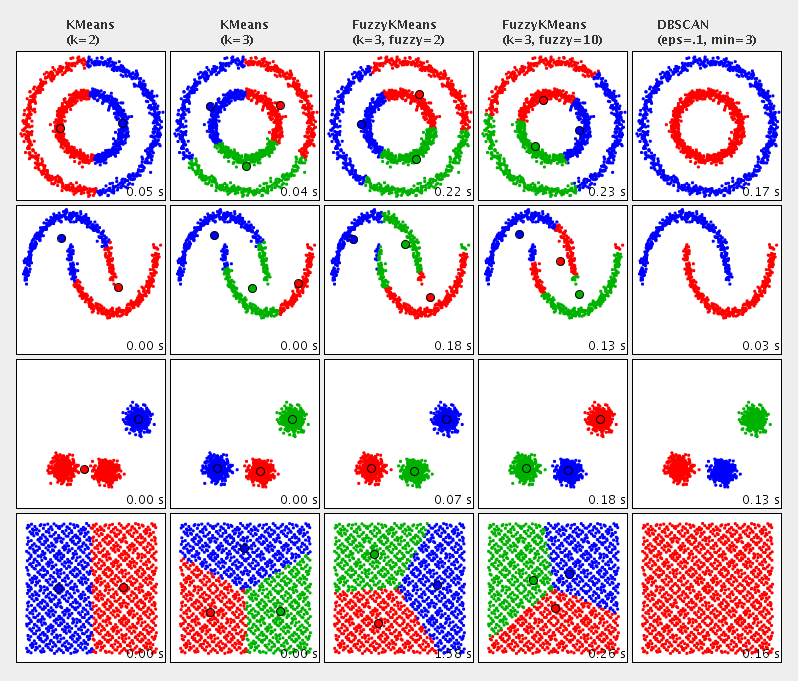
In the figure, different color is used to represent different clusters, which shows the effect of clustering various 2D datasets.
Hands-on practice
Original requirements:
The portal website of a company is divided into the following columns:
| video |
literature |
Cartoon |
animation |
automobile |
Navigation |
Magazine |
mailbox |
Medical care |
Negotiable securities |
Journalism |
wallet |
Business community |
The operators sorted out the data of 20000 users' visits in this quarter, and hoped to make a portrait of the users of the station, further launch targeted marketing activities, and accurately deliver advertisements.
Note: the data file is a "," separated csv file. The first column is the user id, and the last 13 columns are the user's access to each column.
Analysis steps:
- Logarithm processing for analysis
- Clustering the processed data
- Interpreting clustering categories as user classification portraits
- Put forward targeted marketing activities according to user classification
- Push targeted marketing activities to each user
Code practice:
1. Create a project with Maven
mvn archetype:generate \
          -DinteractiveMode=false \
          -DarchetypeGroupId=org.jetbrains.kotlin \
          -DarchetypeArtifactId=kotlin-archetype-jvm \
          -DarchetypeVersion=1.3.70 \
          -DgroupId=org.ctstudio \
          -DartifactId=customer-cluster \
          -Dversion=1.0
After the command is executed, import the maven project with your favorite IDE.
2. Add dependency
We use commons csv to parse the data, the clustering algorithm provided by commons math3, and the jdk8 extension feature of Kotlin. In practice, you can use your favorite csv components. Most of the components that support machine learning, such as Spark and Mahout, include k-means clustering algorithm. As long as you master the basic usage, it is easy to replace on demand.
<!-- Use kotlin8 Of jdk8 Extension, mainly to simplify the file opening code -->
<dependency>
    <groupId>org.jetbrains.kotlin</groupId>
    <artifactId>kotlin-stdlib-jdk8</artifactId>
    <version>${kotlin.version}</version>
</dependency>

<!-- Used for import and export CSV Data file in format -->
<dependency>
    <groupId>org.apache.commons</groupId>
    <artifactId>commons-csv</artifactId>
    <version>1.6</version>
</dependency>

<!-- The clustering algorithm is mainly used -->
<dependency>
    <groupId>org.apache.commons</groupId>
    <artifactId>commons-math3</artifactId>
    <version>3.6.1</version>
</dependency>
2. Download data
Download the following two files locally for code use, such as putting them in the root directory of the above project:
3. Write code
Read data and structure as user PV list:
// Define user PV entity class and implement Clusterable for clustering algorithm
// Where id is the user ID of the first column, pv is double [] indicating the user's access to each column, and clusterId is the classification for saving results
class UserPV(var id: Int, private val pv: DoubleArray, var clusterId: Int = 0) : Clusterable {
    override fun getPoint(): DoubleArray {
        return pv
    }

    override fun toString(): String {
        return "{id:$id,point:${point.toList()}}"
    }
}

// Using commons CSV to read data file as UserPV list
fun loadData(filePath: String): List<UserPV> {
    val fmt = CSVFormat.EXCEL
    FileReader(filePath).use { reader ->
        return CSVParser.parse(reader, fmt).records.map {
            val uid = it.first().toIntOrNull() ?: 0
            val pv = DoubleArray(13) { i ->
                it[i + 1]?.toDoubleOrNull() ?: 0.0
            }
            UserPV(uid, pv)
        }
    }
}
Data preprocessing, removing the abnormal data, processing the abnormal values in the records, and normalizing the access volume
// Filter or process abnormal data. In actual business, you may need to do more filtering or processing
// Filter invalid user id
val filteredData = originData.filter { it.id > 0 }
// Negative number of visits processed to 0
filteredData.forEach { it.point.forEachIndexed { i, d -> if (d < 0.0) it.point[i] = 0.0 } }
// Normalization of PV data
normalize(filteredData)
Normalization Code:
fun <T : Clusterable> normalize(points: List<T>, dimension: Int = points.first().point.size) {
    val maxAry = DoubleArray(dimension) { Double.NEGATIVE_INFINITY }
    val minAry = DoubleArray(dimension) { Double.POSITIVE_INFINITY }
    points.forEach {
        maxAry.assignEach { index, item -> max(item, it.point[index]) }
        minAry.assignEach { index, item -> min(item, it.point[index]) }
    }
    // The operator overload of Kotlin is used here to encapsulate the element by element operation of double [] element
    val denominator = maxAry - minAry
    points.forEach {
        // Code logic here: (x - min)/(max - min)
        it.point.assignEach { i, item -> (item - minAry[i]) / denominator[i] }
    }
}
The so-called normalization refers to the transformation of all data into the range of 0 ~ 1 by (value min) / (max min), so as to avoid the impact of a certain block's access on the clustering effect.
Call clustering algorithm for data:
  // Create an instance of clustering algorithm, "5" is the number of categories to be classified
  // In practice, more parameters including k value need to be adjusted, clustered and evaluated to achieve the best clustering effect
  val kMeans = KMeansPlusPlusClusterer<UserPV>(5)
  // Clustering the processed data with algorithm
  val clusters = kMeans.cluster(filteredData)
Often at the beginning, we do not know how many kinds of data are the most appropriate. At this time, we need to evaluate the algorithm to evaluate the clustering effect under different center points.
Calinski harabasz is a very common evaluation algorithm. The basic idea is that the more compact the inner class and the greater the distance between classes, the higher the score. Unfortunately, java does not have an open source version at present. Fortunately, the code I submitted to Apache Commons Math has been accepted by commons-math4, and you can expect it. Use what I've written here Kotlin version You can also do it yourself:
// Create clustering algorithm
val kMeans = KMeansPlusPlusClusterer<UserPV>(5)
// Clustering data sets
val clusters = kMeans.cluster(filteredData)
// Create the calinski harabaszy evaluation algorithm
val evaluator = CalinskiHarabasz<UserPV>()
// Score the clustering results just now
val score = evaluator.score(clusters)
With clustering and scoring codes, we need to dynamically select the most appropriate k value, that is, the number of clustering centers:
    val evaluator = CalinskiHarabasz<UserPV>()
    var maxScore = 0.0
    var bestKMeans: KMeansPlusPlusClusterer<UserPV>? = null
    var bestClusters: List<CentroidCluster<UserPV>>? = null
    for (k in 2..10) {
        val kMeans = KMeansPlusPlusClusterer<UserPV>(k)
        val clusters = kMeans.cluster(filteredData)
        val score = evaluator.score(clusters)
        //Select the cluster with the highest score
        if (score > maxScore) {
            maxScore = score
            bestKMeans = kMeans
            bestClusters = clusters
        }
        println("k=$k,score=$score")
    }

    //Print the best number of cluster centers
    println("Best k is ${bestKMeans!!.k}")
By comparing the scores of multiple k-values, we conclude that it is the most appropriate to classify users into three categories. At this time, we can save the clustering results, estimate, analyze and interpret them
// Save center point data
fun saveCenters(
    clusters: List<CentroidCluster<UserPV>>,
    fileCategories: String,
    fileCenters: String
) {
    // Read section title from categories.csv
    val categories = readCategories(fileCategories)
    // Save by section title and cluster center point
    writeCSV(fileCenters) { printer ->
        printer.print("")
        printer.printRecord(categories)
        for (cluster in clusters) {
            //Number of users of each type
            printer.print(cluster.points.size)
            //Average visits of each type
            printer.printRecord(cluster.center.point.toList())
        }
    }
}

...

saveCenters(clusters, "categories.csv", "centers.csv")
The classification of users usually needs to be saved as the basis for providing personalized services for each user in the future:
//Save user id category correspondence to csv file
fun saveClusters(
    clusters: List<CentroidCluster<UserPV>>,
    fileClusters: String
) {
    writeCSV(fileClusters) { printer ->
        var clusterId = 0
        clusters.flatMap {
            clusterId++
            it.points.onEach { p -> p.clusterId = clusterId }
        }.sortedBy { it.id }.forEach { printer.printRecord(it.id, it.clusterId) }
    }
}
...
saveClusters(clusters, "clusters.csv")
Note that this is saved as CSV for demonstration only. According to the actual business, you may need to write the user id classification correspondence to the database.
4. Interpretation of clustering results
Using Excel to open the centers.csv file, we can mark the maximum value in each column (representing the normalized average access of each type of user) with the background color as the characteristics of this type of user:

From the above table, it is easy to see that our users can be divided into three categories:
- 7010 people like video, literature and animation
- 8151 people focus on cars, navigation, magazines and email
- 4839 people like healthcare, securities, news, wallets and business
If combined with other registration information of users, we can even give users some clear portraits, such as the combination of age and gender: college students who like movies and animation, professionals who are concerned about cars & fashion, housewives who are concerned about health & Financial Management
summary
If you see it here, you will find that it is not so difficult to learn from mobile phones. The code runs swish and does not need too many frameworks and components. If your data is large enough, such as over 100 million yuan, you can also expect the small batch k-means clustering algorithm that I am contributing to Apache Commons Math (to be released with commons-math 4). Compared with these frameworks, such as Spark, the algorithm brings exponential performance improvement. Of course, when your data is too large to be carried by a single machine, those distributed frameworks are essential.
In order to learn machine learning well, it is necessary to master theoretical knowledge. A journey of a thousand miles starts with one step. Let's start with mastering clustering algorithm. Besides this, you need to search some theoretical knowledge of clustering algorithm to deepen your understanding.
Next time, I'm going to talk about some necessary prerequisite knowledge for in-depth (actually not too deep) machine learning in an easy to understand way, such as how to deduce and understand multidimensional space, variance and Euclidean distance from one-dimensional space. Of course, I am a master of practice, but not a master of theory. All of these knowledge are to lead me to a real AI project case: -)