The iostat command reports cpu statistics and disk i/o statistics. The iostat command monitors the i/o load of the system by observing the actual working time of the storage devices and their average transmission rate.
This does not need root permission, and the data source can be obtained directly by accessing procfs.
Basic usage and basic meaning of output
iostat -d -x 1#Indicates the display of device status, display of extension information, and output once per second
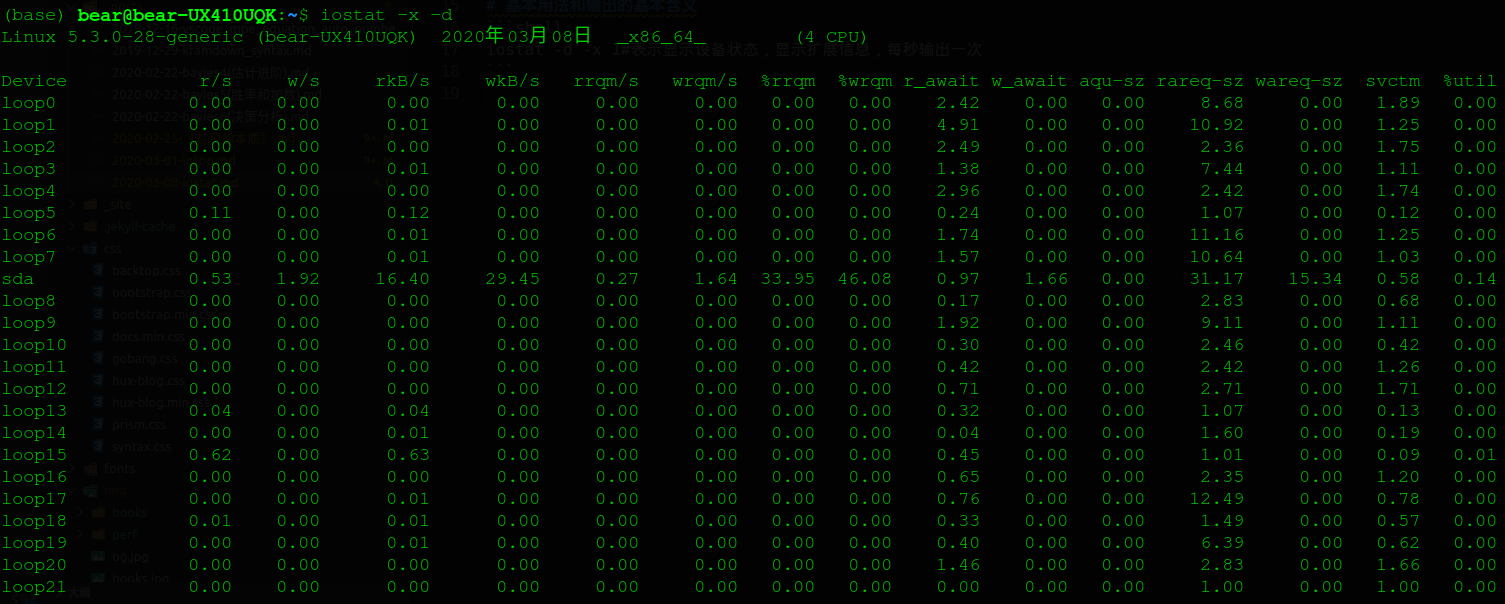
Interpretation of iostat index
| performance index | Meaning | Tips |
|---|---|---|
| Device | Display the Name of the device or partition | These devices can be found under / dev |
| r/s | Number of requests sent to disk per second | Number of requests after merge |
| w/s | Number of requests sent to disk per second | Number of requests after merge |
| rkB/s | Amount of data read from disk per second | The unit is kB. |
| wkB/s | Amount of data written to disk per second | The unit is kB. |
| rrqm/s | Number of read requests merged per second | %rrqm represents the percentage of merge read requests |
| wrqm/s | Number of write requests merged per second | %wrqm represents the percentage of merge write requests |
| r_await | Wait time for completion of read request processing | Including the waiting time in the queue and the actual processing time of the device, in ms |
| w_await | Write request processing completion wait time | Including the waiting time in the queue and the actual processing time of the device, in ms |
| aqu-sz | Average request queue length | Avgqu SZ in the old version |
| rareq-sz | Average read request size | The unit is kB. |
| wareq-sz | Average write request size | The unit is kB. |
| svctm | Average time required to process IO requests (excluding waiting time) |
In milliseconds |
| %util | Percentage of time that disk processes IO | I.e. utilization, because there may be parallel IO, 100% does not indicate that disk IO is saturated |
iostat data source: diskstats
The data source here refers to / proc/diskstats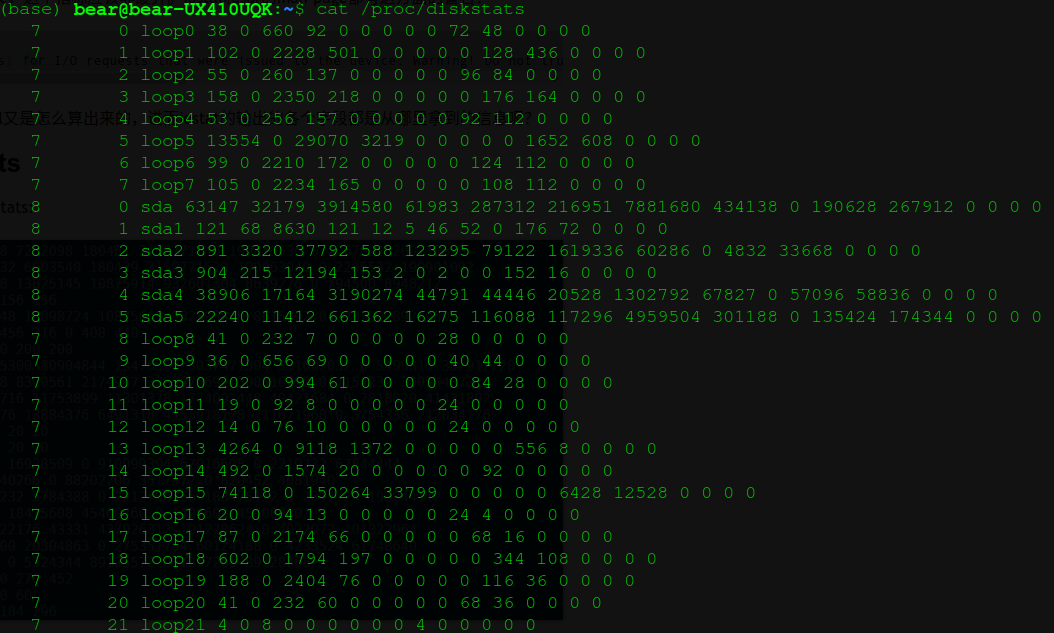
iostat is calculated based on / proc/diskstats, which is the premise. And many methods of IO query are calculated based on / proc/diskstats.
Since / proc/diskstats does not separate the queue waiting time from the hard disk processing time, it is impossible for any tool based on / proc/diskstats to provide disk service time and queue related values respectively.
Take sda for example
8 0 sda 63147 32179 3914580 61983 287312 216951 7881680 434138 0 190628 267912 0 0 0 0
Meaning of each parameter:
The first three fields represent major, minor and device respectively; the following 15 fields have the following meanings:
| index | Name | units | description |
|---|---|---|---|
| 1 | read I/Os | requests | number of read I/Os processed |
| 2 | read merges | requests | number of read I/Os merged with in-queue I/O |
| 3 | read sectors | sectors | number of sectors read |
| 4 | read ticks | milliseconds | total wait time for read requests |
| 5 | write I/Os | requests | number of write I/Os processed |
| 6 | write merges | requests | number of write I/Os merged with in-queue I/O |
| 7 | write sectors | sectors | number of sectors written |
| 8 | write ticks | milliseconds | total wait time for write requests |
| 9 | in_flight | requests | number of I/Os currently in flight |
| 10 | io_ticks | milliseconds | total time this block device has been active |
| 11 | time_in_queue | milliseconds | total wait time for all requests |
| 12 | discard I/Os | requests | number of discard I/Os processed |
| 13 | discard merges | requests | number of discard I/Os merged with in-queue I/O |
| 14 | discard sectors | sectors | number of sectors discarded |
| 15 | discard ticks | milliseconds | total wait time for discard requests |
Most of these fields are very easy to understand, but the slightly difficult to understand is Io "ticks". At first glance, it's clear why there is still an IO tick for RD and WR ticks. Note that RD tracks and WR tracks add up the consumption time of each IO, but the hard disk device can generally process multiple IO in parallel. Therefore, the sum of RD tracks and WR tracks is generally larger than the wall clock time. IO "ticks doesn't care how many IOS are queued in the queue, it only cares about the time when the device has io. I.e. not considering how much IO there is, but only considering whether there is Io. In the actual operation, when in flight is not zero, the timing is kept. When in flight is equal to zero, the time is not added to IO ticks.
Data structure in kernel
path: root/include/linux/blk_types.h
enum stat_group {
    STAT_READ,
    STAT_WRITE,
    STAT_DISCARD,

    NR_STAT_GROUPS
};

path: root/include/linux/genhd.h
struct disk_stats {
    u64 nsecs[NR_STAT_GROUPS];
    unsigned long sectors[NR_STAT_GROUPS];
    unsigned long ios[NR_STAT_GROUPS];
    unsigned long merges[NR_STAT_GROUPS];
    unsigned long io_ticks;
    unsigned long time_in_queue;
    local_t in_flight[2];
};

path: root/block/genhd.c
static int diskstats_show(struct seq_file *seqf, void *v)
{
    struct gendisk *gp = v;
    struct disk_part_iter piter;
    struct hd_struct *hd;
    char buf[BDEVNAME_SIZE];
    unsigned int inflight;

    /*
    if (&disk_to_dev(gp)->kobj.entry == block_class.devices.next)
        seq_puts(seqf,  "major minor name"
                         "     rio rmerge rsect ruse wio wmerge "
                         "wsect wuse running use aveq"
                         "\n\n");
    */

    disk_part_iter_init(&piter, gp, DISK_PITER_INCL_EMPTY_PART0);
    while ((hd = disk_part_iter_next(&piter))) {
        inflight = part_in_flight(gp->queue, hd);
        seq_printf(seqf, "%4d %7d %s "
                    "%lu %lu %lu %u "
                    "%lu %lu %lu %u "
                    "%u %u %u "
                    "%lu %lu %lu %u\n",
                    MAJOR(part_devt(hd)), MINOR(part_devt(hd)),
                    disk_name(gp, hd->partno, buf),
                    part_stat_read(hd, ios[STAT_READ]),
                    part_stat_read(hd, merges[STAT_READ]),
                    part_stat_read(hd, sectors[STAT_READ]),
                    (unsigned int)part_stat_read_msecs(hd, STAT_READ),
                    part_stat_read(hd, ios[STAT_WRITE]),
                    part_stat_read(hd, merges[STAT_WRITE]),
                    part_stat_read(hd, sectors[STAT_WRITE]),
                    (unsigned int)part_stat_read_msecs(hd, STAT_WRITE),
                    inflight,
                    jiffies_to_msecs(part_stat_read(hd, io_ticks)),
                    jiffies_to_msecs(part_stat_read(hd, time_in_queue)),
                    part_stat_read(hd, ios[STAT_DISCARD]),
                    part_stat_read(hd, merges[STAT_DISCARD]),
                    part_stat_read(hd, sectors[STAT_DISCARD]),
                    (unsigned int)part_stat_read_msecs(hd, STAT_DISCARD),
                );
    }
    disk_part_iter_exit(&piter);

    return 0;
}
Data structure of user state iostat
The user state program opens the / proc/diskstats file and fills the data into the structure of struct IO ﹣ stats.
/*
 * Structures for I/O stats.
 * These are now dynamically allocated.
 */
struct io_stats {
	/* # of sectors read */
	unsigned long rd_sectors	__attribute__ ((aligned (8)));
	/* # of sectors written */
	unsigned long wr_sectors	__attribute__ ((packed));
	/* # of sectors discarded */
	unsigned long dc_sectors	__attribute__ ((packed));
	/* # of read operations issued to the device */
	unsigned long rd_ios		__attribute__ ((packed));
	/* # of read requests merged */
	unsigned long rd_merges		__attribute__ ((packed));
	/* # of write operations issued to the device */
	unsigned long wr_ios		__attribute__ ((packed));
	/* # of write requests merged */
	unsigned long wr_merges		__attribute__ ((packed));
	/* # of discard operations issued to the device */
	unsigned long dc_ios		__attribute__ ((packed));
	/* # of discard requests merged */
	unsigned long dc_merges		__attribute__ ((packed));
	/* Time of read requests in queue */
	unsigned int  rd_ticks		__attribute__ ((packed));
	/* Time of write requests in queue */
	unsigned int  wr_ticks		__attribute__ ((packed));
	/* Time of discard requests in queue */
	unsigned int  dc_ticks		__attribute__ ((packed));
	/* # of I/Os in progress */
	unsigned int  ios_pgr		__attribute__ ((packed));
	/* # of ticks total (for this device) for I/O */
	unsigned int  tot_ticks		__attribute__ ((packed));
	/* # of ticks requests spent in queue */
	unsigned int  rq_ticks		__attribute__ ((packed));
};
Calculation from collection data to display data
Through the obtained data, we can get the following information directly.
r/s
w/s
rkB/s
wkB/s
rrqm/s
wrqm/s
The calculation of these items is very simple, that is, sampling twice, subtracting the value of the previous one from the value of the latter one, and then dividing by the time interval to get the average value. Because the corresponding values in / proc/diskstats are cumulative, the last one is subtracted from the previous one to get the new increment in the sampling interval. No more details.
Calculation of r'wait and w'wait
xios.r_await = (ioi->rd_ios - ioj->rd_ios) ?
				       (ioi->rd_ticks - ioj->rd_ticks) /
				       ((double) (ioi->rd_ios - ioj->rd_ios)) : 0.0;

xios.w_await = (ioi->wr_ios - ioj->wr_ios) ?
				       (ioi->wr_ticks - ioj->wr_ticks) /
				       ((double) (ioi->wr_ios - ioj->wr_ios)) : 0.0;
R \ await = (time spent on all read IO during the interval) / (number of read requests during the interval) w \ await = (time spent on all write IO during the interval) / (number of write requests during the interval) R \ \\ W \ \ R \ await = (time spent on all read IO during the interval) / (number of read requests during the interval) w \ await = (time spent on all write IO during the interval) / (number of write requests during the interval)
Calculation of aqu SZ average queue depth
//Where RQ ﹣ ticks is the time ﹣ in ﹣ queue in diskstats. Note that 1000 here is MS - > s
#define S_VALUE(m,n,p)		(((double) ((n) - (m))) / (p) * 100)
S_VALUE(ioj->rq_ticks, ioi->rq_ticks, itv) / 1000.0);
Here is the implementation of the kernel:
path: root/drivers/md/dm-stats.c

    difference = now - shared->stamp;
    if (!difference)
        return;

    in_flight_read = (unsigned)atomic_read(&shared->in_flight[READ]);
    in_flight_write = (unsigned)atomic_read(&shared->in_flight[WRITE]);
    if (in_flight_read)
        p->io_ticks[READ] += difference;
    if (in_flight_write)
        p->io_ticks[WRITE] += difference;
    if (in_flight_read + in_flight_write) {
        p->io_ticks_total += difference;
        p->time_in_queue += (in_flight_read + in_flight_write) * difference;
    }
    shared->stamp = now;
Here's a chestnut:
When the first IO is completed, 250 IO in the queue and 250 IO are waiting for 4ms, that is, time in queue + = (250 * 4). When the second IO is completed, time in queue + = (249 * 4). When all IO is completed, time in queue = 4 * (250 + 249 + 248 .+1)
According to time in queue / 1000time in queue / 1000time in queue / 1000time in queue / 1000, the average queue length is obtained.
$$
time_in_queue += \Delta t_n * inflight_n \
aqu_sz = expected value of inflight in the interval = \ frac{\Delta t_i * inflight_i + + \Delta t_j * inflight_j}{\Delta t_i + … + \Delta t_i}
$$
Average sector size of rareq SZ & wareq SZ requests
xios.rarqsz = (ioi->rd_ios - ioj->rd_ios) ?
			(ioi->rd_sectors - ioj->rd_sectors) / ((double) (ioi->rd_ios - ioj->rd_ios)) :
				      0.0;
xios.warqsz = (ioi->wr_ios - ioj->wr_ios) ?
			(ioi->wr_sectors - ioj->wr_sectors) / ((double) (ioi->wr_ios - ioj->wr_ios)) :
				      0.0;
Rareq ﹣ SZ = (sector growth read during interval) / (number of read requests during interval) wareq ﹣ SZ = (sector growth written during interval) / (number of write requests during interval) Rareq \ \sz = (sector growth read during interval) / (number of read requests during interval)\ Wareq \ \ Rareq ﹣ SZ = (sector growth read during interval) / (number of read requests during interval) wareq ﹣ SZ = (sector growth written during interval) / (number of write requests during interval)
%util disk device saturation (data inaccurate)
path: root/drivers/md/dm-stats.c
//Where IO ﹐ ticks ﹐ total is the total time when the queue is not empty
    difference = now - shared->stamp;
    if (!difference)
        return;

    in_flight_read = (unsigned)atomic_read(&shared->in_flight[READ]);
    in_flight_write = (unsigned)atomic_read(&shared->in_flight[WRITE]);
    if (in_flight_read)
        p->io_ticks[READ] += difference;
    if (in_flight_write)
        p->io_ticks[WRITE] += difference;
    if (in_flight_read + in_flight_write) {
        p->io_ticks_total += difference;
        p->time_in_queue += (in_flight_read + in_flight_write) * difference;
    }
    shared->stamp = now;
The simplest example is that a hard disk needs 0.1 seconds to process a single IO request and has the ability to process 10 at the same time. But when 10 requests are submitted in turn, it takes one second to complete the 10% requests. In one second sampling period,% util reaches 100%. But if you submit 10 at one time, the hard disk can be completed in 0.1 seconds. At this time,% util is only 10%.
In the above example, when 10 IOS in a second, i.e. IOPS=10,% util reaches 100%. This does not mean that the IOPS of this disk can only reach 10. In fact, even if% util reaches 100%, the hard disk may still have a lot of spare power to handle more requests, that is, it does not reach the state of full sum.
Is there an indicator to measure the saturation of hard disk devices. Unfortunately, iostat doesn't have a metric to measure the saturation of disk devices.
Why do I need an IO tick when I have Rd tick and WR tick. Note that RD tracks and WR tracks add up the consumption time of each IO, but the hard disk device can generally process multiple IO in parallel. Therefore, the sum of RD tracks and WR tracks is generally larger than the wall clock time. IO "ticks doesn't care how many IOS are queued in the queue, it only cares about the time when the device has io. I.e. not considering how much IO there is, but only considering whether there is Io. In the actual operation, when in flight is not zero, the timing is kept. When in flight is equal to zero, the time is not added to IO ticks.
The average time required for svctm to process IO requests
    double tput = ((double) (sdc->nr_ios - sdp->nr_ios)) * HZ / itv;

    xds->util = S_VALUE(sdp->tot_ticks, sdc->tot_ticks, itv);
    xds->svctm = tput ? xds->util / tput : 0.0;
For iostat, although% util will cause some misunderstandings and harassment, svctm will cause more misunderstandings. For a long time, people want to know the service time of the block device processing a single IO, which directly reflects the ability of the hard disk.
But service time has nothing to do with iostat. No parameter of iostat can provide this information. In fact, this value is not independent. It is calculated based on other values.

