crash file
When crash occurs in running APP, if there is a corresponding handler or a third party crash SDK in the code, they will collect the relevant running stack, send it to the corresponding server, and then parse it through the dsym file uploaded by the developer to get the symbolized stack information. We can analyze this. Why do you know crash? In addition, when crash occurs, a crash file will also be generated on the corresponding device. We can export crash files through Xcode.
Window - > Devices and Simulator - > Select the corresponding device - > view device log:
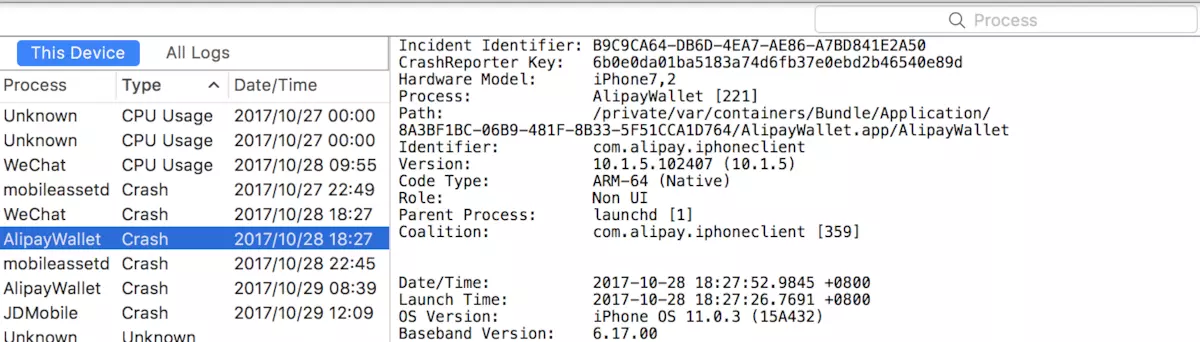
crash-list.png
See my last article on how to parse symbolized crash files Article . Here we analyze the basic structure of the following documents. Following is a general overview of the crash file:
Incident Identifier: B9C9CA64-DB6D-4EA7-AE86-A7BD841E2A50
CrashReporter Key:   6b0e0da01ba5183a74d6fb37e0ebd2b46540e89d
Hardware Model:      iPhone7,2
Process:             AlipayWallet [221]
Path:                /private/var/containers/Bundle/Application/8A3BF1BC-06B9-481F-8B33-5F51CCA1D764/AlipayWallet.app/AlipayWallet
Identifier:          com.alipay.iphoneclient
Version:             10.1.5.102407 (10.1.5)
Code Type:           ARM-64 (Native)
Role:                Non UI
Parent Process:      launchd [1]
Coalition:           com.alipay.iphoneclient [359]


Date/Time:           2017-10-28 18:27:52.9845 +0800
Launch Time:         2017-10-28 18:27:26.7691 +0800
OS Version:          iPhone OS 11.0.3 (15A432)
Baseband Version:    6.17.00
Report Version:      104

Exception Type:  EXC_CRASH (SIGKILL)
Exception Codes: 0x0000000000000000, 0x0000000000000000
Exception Note:  EXC_CORPSE_NOTIFY
Termination Reason: Namespace SPRINGBOARD, Code 0x8badf00d
Termination Description: SPRINGBOARD, process-exit watchdog transgression: com.alipay.iphoneclient exhausted real (wall clock) time allowance of 5.00 seconds |  | Elapsed total CPU time (seconds): 10.020 (user 10.020, system 0.000), 100% CPU | Elapsed application CPU time (seconds): 1.194, 12% CPU |
Triggered by Thread:  0

Filtered syslog:
None found

Thread 0 name:  Dispatch queue: com.apple.main-thread
Thread 0 Crashed:
0   CoreFoundation                  0x00000001818a057c CFAllocatorAllocate + 0
1   CoreFoundation                  0x00000001818a09bc _CFRuntimeCreateInstance + 348
2   CoreFoundation                  0x00000001818a1610 CFBasicHashCreate + 108
3   CoreFoundation                  0x0000000181961c44 __CFDictionaryCreateTransfer + 156
4   CoreFoundation                  0x00000001819462b0 __CFBinaryPlistCreateObjectFiltered + 5952
5   CoreFoundation                  0x0000000181945ed0 __CFBinaryPlistCreateObjectFiltered + 4960
6   CoreFoundation                  0x00000001819469e4 __CFTryParseBinaryPlist + 200
7   CoreFoundation                  0x00000001818a0d54 _CFPropertyListCreateWithData + 192
8   CoreFoundation                  0x00000001818ec178 _CFPropertyListCreateFromXMLData + 116
9   Foundation                      0x00000001822fa68c +[NSPropertyListSerialization propertyListFromData:mutabilityOption:format:errorDescription:] + 52
10  AlipayWallet                    0x00000001023f2058 0x100480000 + 32972888
11  AlipayWallet                    0x00000001023f0ad4 0x100480000 + 32967380
header
- Incident Identifier: Event identifier, each crash file corresponds to a unique identifier.
- Crash Reporter Key: Anonymous device identifier.
- Hardware Model: Equipment type;
- Process: Process name;
- Identifier: app Identifier;
- Exception Type: Exception Type;
- Exception Codes: Exception Codes;
- Termination Reason: The reason why the process ended
Thread stack information
Following is the stack information of each thread, some of which are symbolized, some of which are not symbolized. Generally, system dynamic libraries have been symbolized. What is not symbolized is to run the symbols in APP. We can parse them line by line through atos or symbolic tecrash commands.
Thread 0 name:  Dispatch queue: com.apple.main-thread
Thread 0 Crashed:
0   CoreFoundation                  0x00000001818a057c CFAllocatorAllocate + 0
.....
9   Foundation                      0x00000001822fa68c +[NSPropertyListSerialization propertyListFromData:mutabilityOption:format:errorDescription:] + 52
10  AlipayWallet                    0x00000001023f2058 0x100480000 + 32972888
11  AlipayWallet                    0x00000001023f0ad4 0x100480000 + 32967380
- The number of the first line represents the calling stack sequence of the corresponding thread.
- The second line represents the corresponding mirror file name, such as system foundation, etc.
- The third line represents the symbol address corresponding to the current line.
- Line 4: If it has been symbolized, it represents the corresponding symbol. What is not symbolized is the mirror's starting address + file offset address. The sum of these two values is actually the address of the third line.
Exception
From the above analysis, we can know the Exception information contained in the head of the crash file. Let's look at some of our common Exception types:
Bad Memory Access [EXC_BAD_ACCESS // SIGSEGV // SIGBUS]
When a process attempts to access an unavailable or inaccessible memory space, a wild pointer exception occurs. Exception Subtype contains an incorrect description and the address it wants to access. We can use the following methods to generate the wild pointer problem in our APP:
- If the objc_msgSend or objc_release symbol information is at the top of the crash thread, the process may attempt to access the released object. We can use it. Zombies instrument Better understanding of the collapse.
- If the gpus_ReturnNotPermittedKillClient symbol is at the top of the crash thread, the process attempts to render using OpenGL ES or Metal in the background.
- Open in debug mode Address Sanitizer It automatically adds tools for memory access at compilation time, and Xcode gives detailed information when crash occurs.
Abnormal Exit [EXC_CRASH // SIGABRT]
Abnormal exit, most of which occurs because of uncovered Objective-C/C++ exceptions that cause the process to call abort() method to exit. This is why the crash file above is generated.
If APP consumes too much time in initialization, watchdog (watchdog timer) terminates the program.
Trace Trap [EXC_BREAKPOINT // SIGTRAP]
This exception is designed to give an additional debugger the opportunity to interrupt the process at a specific time in the execution process. We can add the _builtin_trap() method to the code to trigger the exception manually. If there is no additional debugger, the crash file is generated.
Lower-level libraries, such as libdispatch, capture the process in case of a fatal error.
The swift code also throws this exception when it encounters the following two situations:
- The value of an optional type is nil
- Errors in mandatory type conversion, such as converting NSString to NSDate, etc.
Illegal Instruction [EXC_BAD_INSTRUCTION // SIGILL]
The program attempts to execute an illegal or undefined instruction. This crash occurs when a process performs a function jump if there is a problem with the configured function address.
Quit [SIGQUIT]
The process terminates at the request of another process with the authority to manage its life cycle. SIGQUIT does not mean that the process crashes, but it can show that there are some problems in the process.
For example, in iOS, third-party keyboard applications may be evoked in other APP s, but if the keyboard application takes a long time to load, it will be forced to exit.
Killed [SIGKILL]
The process is forced to end by the system, and crash information is found by looking at Termination Reason.
Guarded Resource Violation
Resource Limit
Processes use resources beyond their limits. This is a system notification, we can see the relevant information in Exception Subtype.
Other Exception Types
Some exceptions recorded by crash report may not be descriptive, but may be a hexadecimal code, such as 00000020. Here are some common exceptions:
- 0xbaaaad: This code indicates that the crash file is a stackshot of the system, not a crash report, which can be generated by pressing the home+voice button.
- 0xbad22222: The number of times a VoIP application starts to recover is too frequent;
- 0x8badf00d: Watchdog timer timeout, as mentioned above, is generally due to the long start time of APP or the timeout of response to system events; for example, when the main thread makes network requests, the main thread will always be stuck until the network callback;
- 0xc00010ff: When the operating system responds to thermal events, it forces the kill process.
- 0xdead10cc: The process remains in a file lock or sqlite database lock during suspend.