First of all, we need to sort out the new knowledge before drawing pie chart:
The generator is used to generate a circle, sector or ring in a pie chart or a doughnut chart;
arguments are arbitrary; they are simply objects passed to the accessor function of the arc generator. For example, according to the default settings, the incoming object should contain the following radius and angle information:
  arc({
    innerRadius: 0,
    outerRadius: 100,
    startAngle: 0,
    endAngle: Math.PI / 2
  }); // "M0,-100A100,100,0,0,1,100,0L0,0Z"

OK, if you don't understand, it's OK to look down
2,d3.pie(data[, arguments...])
The generator is used to calculate the angle information needed when a set of data is used as pie chart or doughnut chart; these angle information will be transferred to arc generator to generate a graph.
According to the specified data array, a set of object arrays is generated, in which each object contains the calculated angle information of each incoming data. Other additional arguments can be included, which will be directly passed to the object generated after the current data calculation or the accessor of pie chart generator.
The straight white point says that d3.pie() provides data for d3.arc().
Calculating the intermediate points [x, y]. Arguments generated by a given arguments are arbitrary and they are passed to the accessor of the arc generator. In order to be consistent with the generated arc, the accessor must be deterministic.
For example, the same parameter returns the same value. The middle point is defined as( startAngle + endAngle / 2 and ( innerRadius + outerRadius) / 2.
For example:
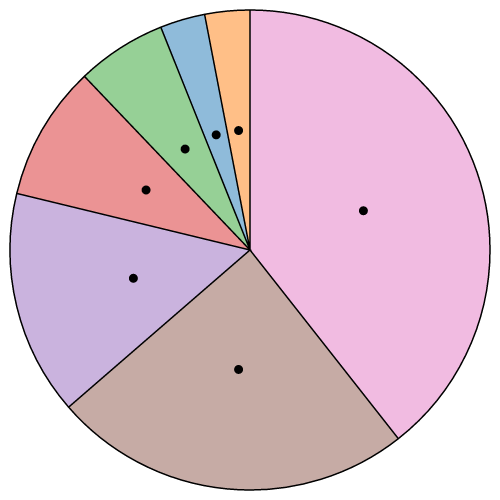
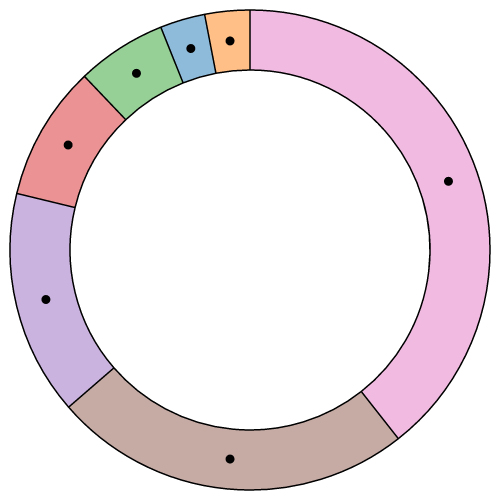
Note that the middle point is not the geometric center, because the geometric center point may be outside the arc; this method can be used to locate the labels conveniently.
4,d3.schemeCategory10
An array of ten classification colors is shown as follows:

With the above supplement, let's draw a picture. Here's the first one D3 Chinese API entry
Code:
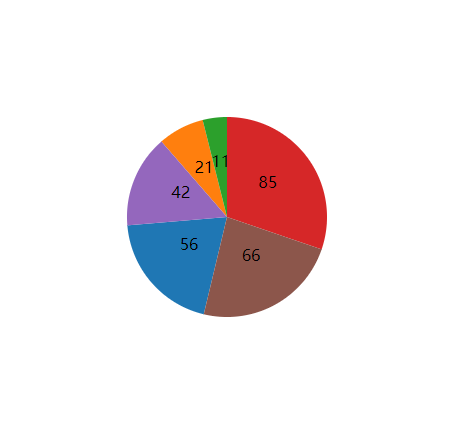
<!DOCTYPE html>
<html lang="en">
<head>
    <meta charset="UTF-8">
    <title>pie</title>
    <script src="https://d3js.org/d3.v5.min.js"></script>
</head>
<body>

<svg width="500" height="400"></svg>

</body>

<script>

    //Preparation data
    var margin = 30;//Margin
    var data = [56,21,11,85,42,66];//Data needed to draw pie chart
    var svg = d3.select('svg');
    var width = svg.attr('width');
    var height = svg.attr('height');

    //Create a group and set the offset
    var g = svg.append('g').attr('transform','translate('+ margin +','+ margin +')');

    //In order for different areas of the pie chart to display different colors, we first create a color scale using the ordinal scale we mentioned before
    var scaleColor = d3.scaleOrdinal()
        .domain(d3.range(data.length))
        .range(d3.schemeCategory10);

    //Create a pie chart
    var pie = d3.pie();

    //Create an arc generator
    var arc = d3.arc()
        .innerRadius(0)//Set the inner radius of the ring.
        .outerRadius(100)//Set the outer radius of the ring.
    //In addition to the inner radius and outer radius, there are many other settings as follows
//        arc.cornerRadius - Set corner radius.
//        arc.startAngle - Set starting angle.
//        arc.endAngle - Set end angle.
//        arc.padAngle - Set the gap angle between two adjacent rings.
//        arc.padRadius - Set radius interval.
//        arc.context - Set rendering context.


    //utilize pie Conversion data
    var pieData = pie(data);
    console.log(pieData);//See what the conversion is


    //Create fan groups
    var gs = g.selectAll('.g')
        .data(pieData)
        .enter()
        .append('g')
        .attr('transform','translate('+ width/2 +','+ height/2 +')');


    //Draw fan shape
    gs.append('path')
        .attr('d',function (d,i) {

            return arc(d);//Add data to arc generator

        })
        .attr('fill',function (d,i) {
            return scaleColor(i);//Color the fan
        })


    //Draw text
    gs.append('text')
        .attr('transform',function (d,i) {
            return 'translate('+ arc.centroid(d) +')';//The position is set at the center of the sector
        })
        .attr("text-anchor","middle")
        .text(function (d,i) {
            return d.data;
        })

</script>

</html>
Effect: