1, Introduction to KMeans algorithm:
K in the name of KMeans algorithm represents the number of categories, and Means represents the mean value of samples in each category. Therefore, KMeans algorithm is also called k-Means algorithm. KMeans algorithm takes distance as the measure of similarity between samples, and assigns samples with similar distance to the same category. The distance between samples can be calculated by Euclidean distance, Manhattan distance, cosine similarity, etc. KMeans algorithm usually uses Euclidean distance to measure the distance between samples.
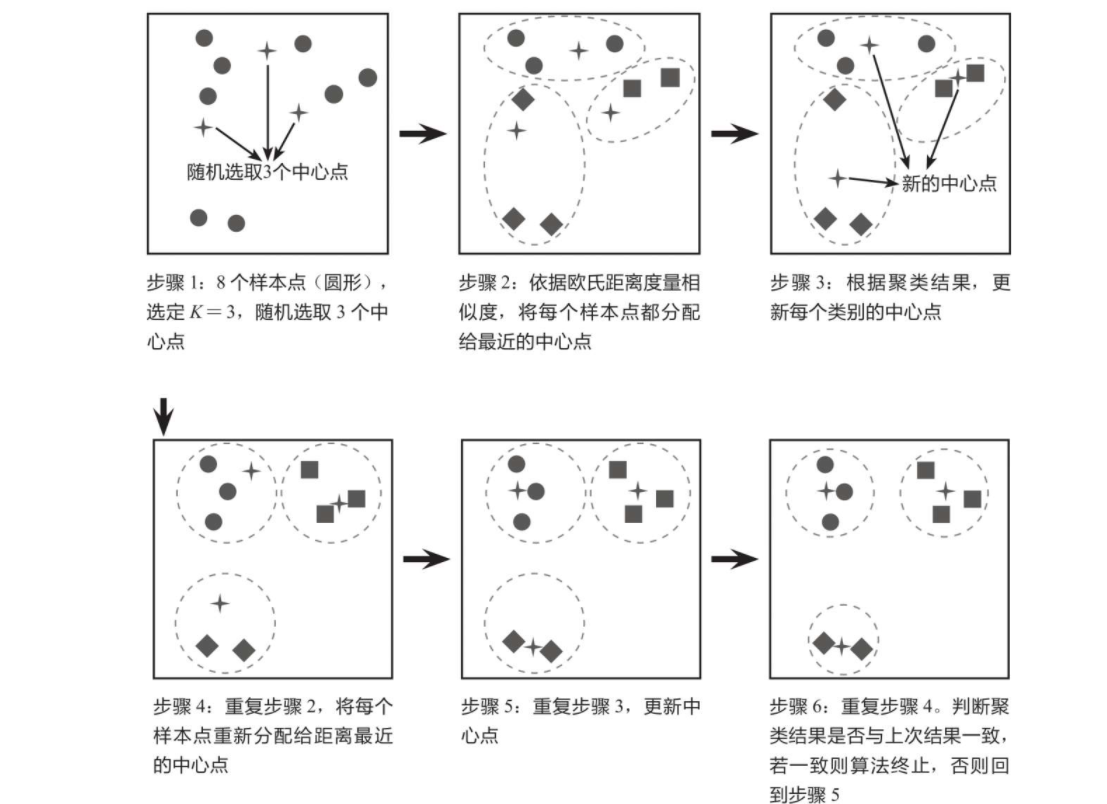
The core idea of KMeans algorithm is to calculate the distance from each sample point to each central point, and assign the sample point to the category represented by the nearest central point. After one iteration, update the central point of each category according to the clustering results, and then repeat the previous operation and iteration again until there is no difference between the two classification results. The simple case shown in the figure below explains the principle of KMeans algorithm. The purpose of this case is to gather 8 sample points into 3 categories (K = 3).
2, KMeans clustering interface:
Import module:
#Import clustering module
from sklearn.cluster import KMeans
#Import file
from sklearn.datasets import load_iris,make_blobs
from matplotlib import pyplot as plt
import numpy as np
Get data:
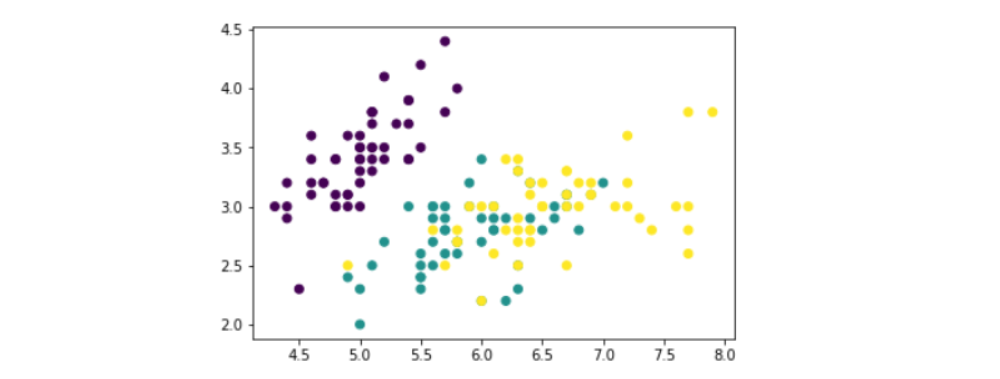
iris = load_iris()
data = iris.data[:,:2] #features
target = iris.target  #Validation label
plt.scatter(data[:,0],data[:,1],c=target)
Establish training model:
#Modeling and training
km_model = KMeans(n_clusters=3).fit(data)
Get clustering results:
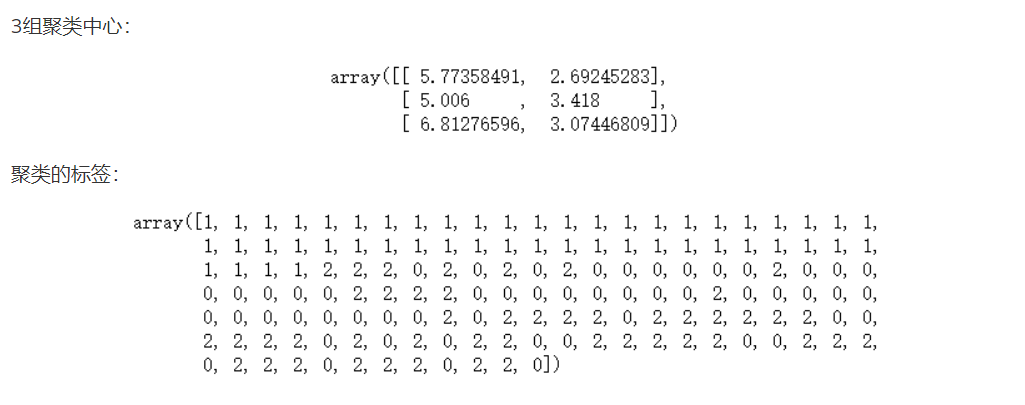
#Final cluster center
cc = km_model.cluster_centers_
#Gets the label of the cluster
km_model.labels_
Introduction to parameters:
n_clusters: integer, default = 8 [number of clusters generated, i.e. number of centroids generated.]
max_iter: integer, default = 300
The maximum number of iterations performed by executing the k-means algorithm once.
n_init: integer, default = 10
The number of times the algorithm is run with different centroid initialization values, and the final solution is the optimal result in the sense of inertia.
init: there are three optional values: 'k-means + +', 'random', or pass an ndarray vector.
This parameter specifies the initialization method. The default value is' k-means + + '.
(1) 'k-means + +' uses a special method to select the initial centroid, which can accelerate the convergence of the iterative process (i.e. the introduction of k-means + + above)
(2) 'random' randomly selects the initial centroid from the training data.
(3) If an ndarray is passed, it should be shaped like (n_clusters, n_features) and give the initial centroid.
precompute_distances: three optional values, 'auto', True or False.
Pre calculate the distance, which is faster but takes up more memory.
(1) 'auto': if the number of samples multiplied by the number of clusters is greater than 12million, the distance will not be pre calculated. This corresponds to about 100MB overhead per job using double precision.
(2) True: always calculate the distance in advance.
(3) False: never calculate the distance in advance.
tol: float shape, default = 1e-4, combined with inertia to determine the convergence conditions.
n_jobs: integer number. Specifies the number of processes used for the calculation. The internal principle is simultaneous n_init specifies the number of calculations.
(1) If the value is - 1, all CPU s are used for operation. If the value is 1, no parallel operation will be performed, which is convenient for debugging.
(2) If the value is less than - 1, the number of CPUs used is (n_cpus + 1 + n_jobs). So if n_ If the jobs value is - 2, the number of CPUs used is the total number of CPUs minus 1.
random_state: integer or numpy.RandomState type, optional
The generator used to initialize the centroid. If the value is an integer, a seed is determined. The default value of this parameter is numpy random number generator.
copy_x: Boolean, default = True
When we precomputing distances, we can get more accurate results by centralizing data. If this parameter value is set to True, the original data will not be changed. If False, it will be directly in the original data
Make changes on and restore the function when it returns a value. However, in the calculation process, due to the addition and subtraction of the data mean, there may be small differences between the original data and before the calculation after the data is returned.
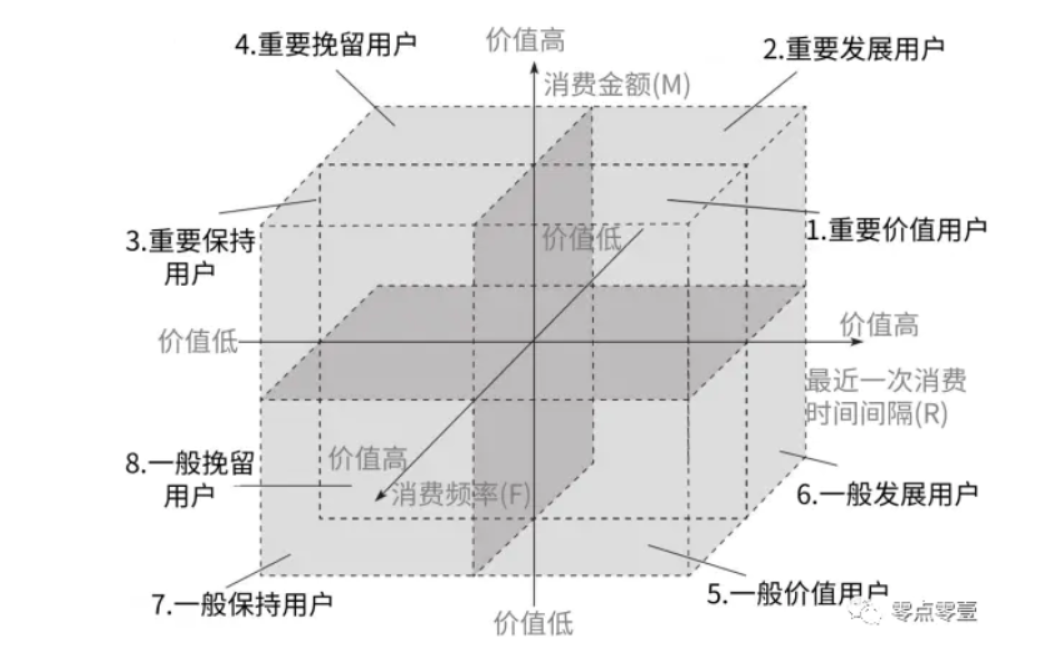
3, RFM data analysis model (active):
import pandas as pd
import numpy as np
from sklearn.cluster import KMeans,DBSCAN
from matplotlib import pyplot as plt
import glob
import os
Read data
os.chdir("./data")
filnames = glob.glob("*.xlsx")

dfs = []
for f in filnames:
    dfs.append(pd.read_excel(f))

data = pd.concat(dfs)
Data sorting
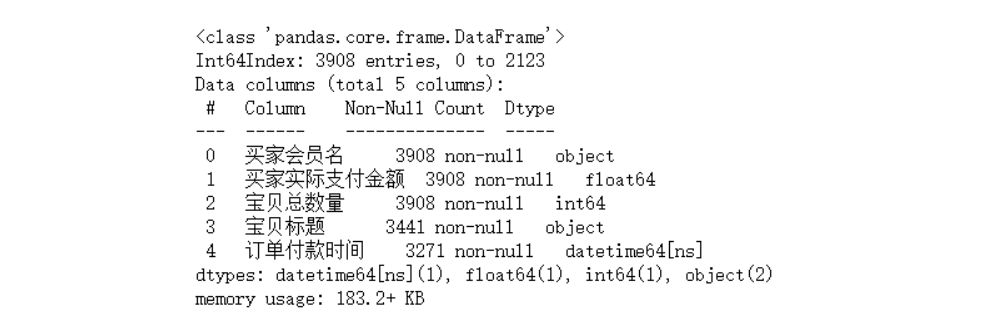
data.info()
#Remove vacant time data
data = data.dropna(subset=["Order payment time"])
Calculate RFM indicators:
#Buyer member name can be purchased repeatedly
#Shortest time interval current time - latest payment time
 current time  = pd.to_datetime("2020-1-1")
Latest payment time = data.groupby("Buyer member name").Order payment time.max()
#The grouping in pandas is the same as that in SQL, and its contained items can be processed after grouping
#Last consumption time
R = (current time  - Latest payment time) / np.timedelta64(1,"D")
#F consumption frequency
F = data.groupby("Buyer member name").Buyer member name.count()
#M consumption amount (average amount or cumulative amount)
M = data.groupby("Buyer member name").Actual payment amount of buyer.sum()
#Data merging
RFM = pd.concat([R,F,M],axis=1).rename(columns={"Order payment time":"Recent consumption interval","Buyer member name":"Consumption frequency","Actual payment amount of buyer":"Cumulative consumption amount"})
Mean calculation:
#Compare the average value of the last consumption with the current time, get the Boolean value, and then replace it. The Boolean value is True, which means it is a long time from the last consumption, so it is labeled {False: "high", True: "low"}
new_R = (RFM["Recent consumption interval"] >= RFM["Recent consumption interval"].mean()).replace({False:"high",True:"low"})
#Label {False: "high", True: "low"}
new_FM = (RFM.loc[:,["Consumption frequency","Cumulative consumption amount"]] >= RFM.loc[:,["Consumption frequency","Cumulative consumption amount"]].mean()).replace({False:"low",True:"high"})
new_RFM = pd.concat([new_R,new_FM],axis=1)
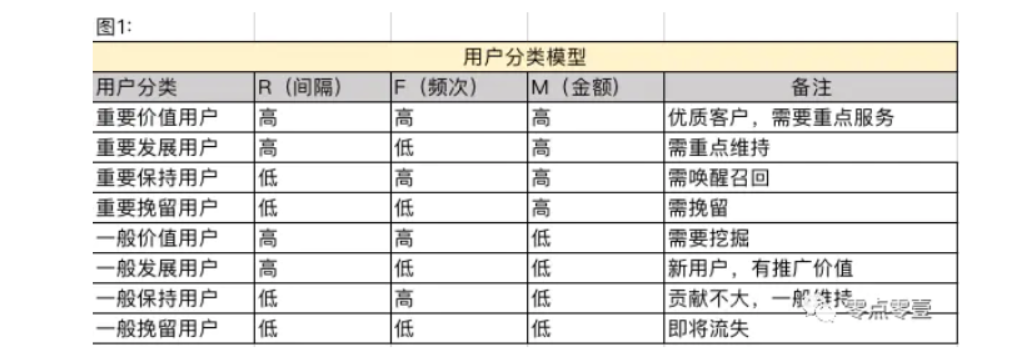
#Labeling:
labs = []
for i in range(new_RFM.shape[0]):
    lab = None
    s = new_RFM.iloc[i]
    if s[0]=="high" and s[1]=="high" and s[2] =="high":
        lab = "Important value users"
    elif s[0]=="high" and s[1]=="low" and s[2] =="high":
        lab = "Important development users"
    elif s[0]=="low" and s[1]=="high" and s[2] =="high":
        lab = "Important to keep users"
    elif s[0]=="low" and s[1]=="low" and s[2] =="high":
        lab = "Important retention users"
    elif s[0]=="high" and s[1]=="high" and s[2] =="low":
        lab = "General value users"
    elif s[0]=="high" and s[1]=="low" and s[2] =="low":
        lab = "General development users"
    elif s[0]=="low" and s[1]=="high" and s[2] =="low":
        lab = "General retention user"
    else:
        lab = "General retention of users"
    labs.append(lab)
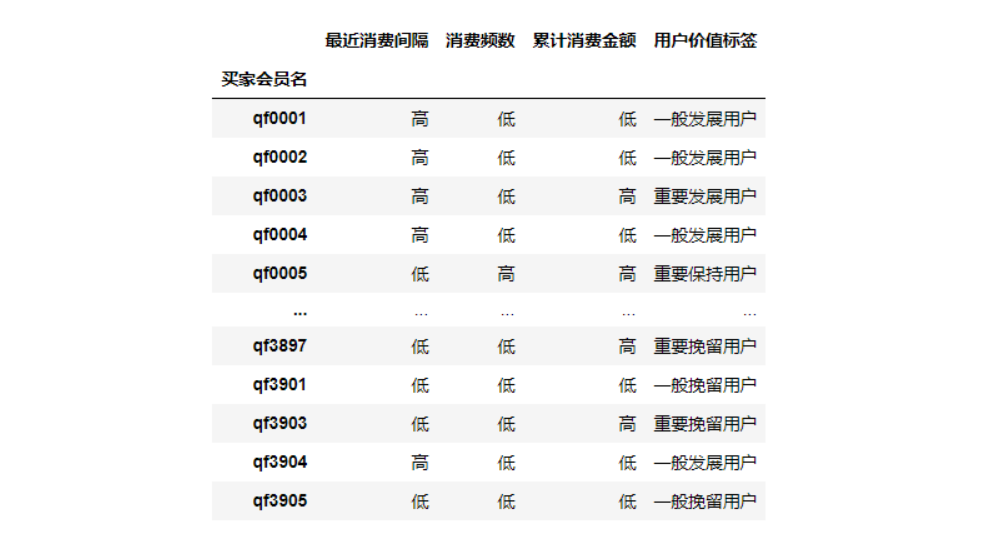
new_RFM["User value label"]=labs
new_RFM
4, Kmeans cluster labels
from sklearn.preprocessing import MinMaxScaler
#Characteristic Engineering
std_model = MinMaxScaler()
std_rfm = std_model.fit_transform(RFM)

Kmeans modeling
Group according to experience, compare the mean value, find the most suitable number of groups and mark and supplement.
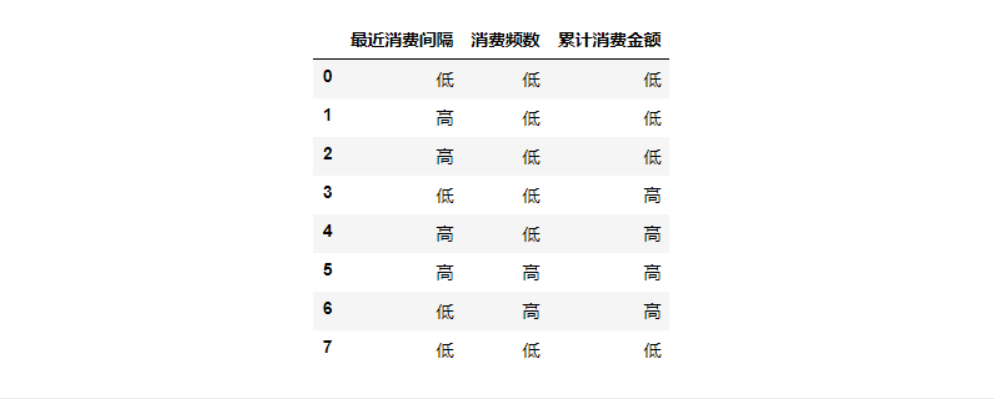
km_rfm_model = KMeans(8).fit(std_rfm)
#Center of each category
rfmcc = km_rfm_model.cluster_centers_
#mean value
rfm_mean = std_rfm.mean(axis=0)

KM_RFM = pd.DataFrame(data=(rfmcc>=rfm_mean),columns=['Recent consumption interval', 'Consumption frequency', 'Cumulative consumption amount'])
NEW_R = (KM_RFM["Recent consumption interval"] >= KM_RFM["Recent consumption interval"].mean()).replace({False:"high",True:"low"})

NEW_FM = (KM_RFM.loc[:,["Consumption frequency","Cumulative consumption amount"]] >= KM_RFM.loc[:,["Consumption frequency","Cumulative consumption amount"]].mean()).replace({False:"low",True:"high"})

NEW_RFM = pd.concat([NEW_R,NEW_FM],axis=1)
NEW_RFM
labs = []
for i in range(NEW_RFM.shape[0]):
    lab = None
    s = NEW_RFM.iloc[i]
    if s[0]=="high" and s[1]=="high" and s[2] =="high":
        lab = "Important value users"
    elif s[0]=="high" and s[1]=="low" and s[2] =="high":
        lab = "Important development users"
    elif s[0]=="low" and s[1]=="high" and s[2] =="high":
        lab = "Important to keep users"
    elif s[0]=="low" and s[1]=="low" and s[2] =="high":
        lab = "Important retention users"
    elif s[0]=="high" and s[1]=="high" and s[2] =="low":
        lab = "General value users"
    elif s[0]=="high" and s[1]=="low" and s[2] =="low":
        lab = "General development users"
    elif s[0]=="low" and s[1]=="high" and s[2] =="low":
        lab = "General retention user"
    else:
        lab = "General retention of users"
    labs.append(lab)
NEW_RFM["User value label"]=labs

RFM["User value label"]=NEW_RFM["User value label"][km_rfm_model.labels_].tolist()
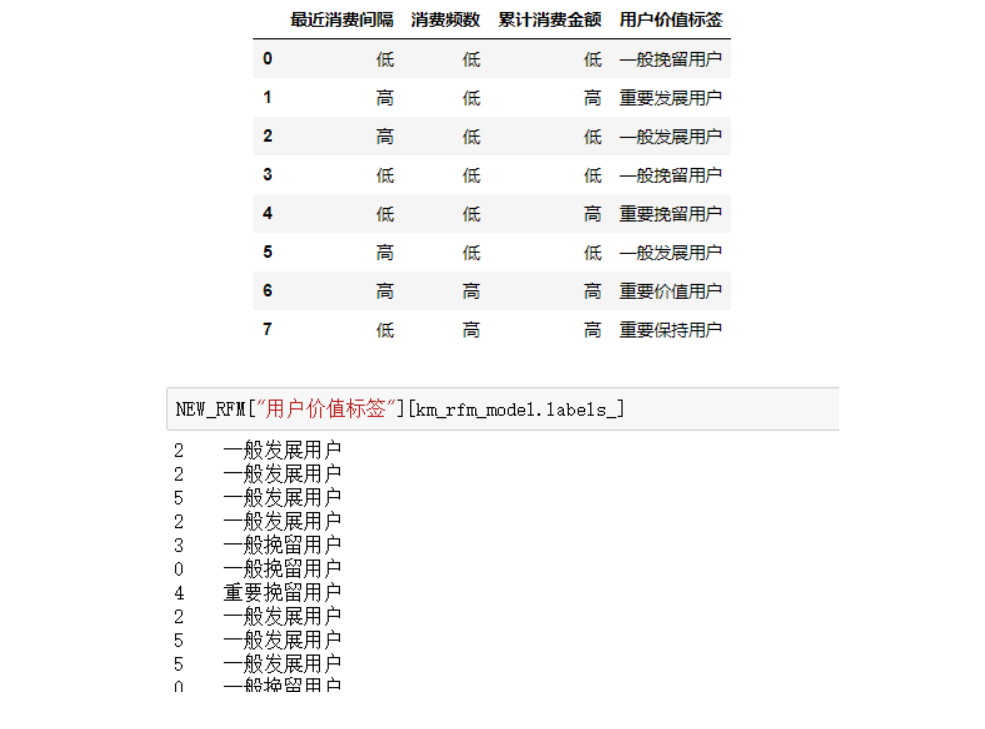
The group labels after classification and re verification (re classification of classes) correspond to the labels after experience grouping one by one