Variable interpretation
- explainer.excepted_value
- The expectation of prediction results is sometimes the mean value of a batch of data prediction results??
- Sub tags. If there are multiple categories, each category will have an expected value. When analyzing the shap value, select the excluded of the corresponding tag_ value
- When interpreting the prediction results, starting from this value, each feature has an impact on the prediction results and finally determines the output of the model
- This result should also be log odd, because it will have a negative number
- Log odd: log probability = log p / (1-p)
- Assuming that the probability of a positive sample is 0.01, the logarithmic probability (based on 10) = log 0.01 / 0.99 = -3.9
- Assuming that the probability of a positive sample is 0.99, the logarithmic probability (based on 10) = log 99 = 1.9
- shap_values
- shape=(n_labels, n_rows, n_cols)
- The information contained is that there is a value for each label, line and feature
- In fact, when we analyze, we will look at the prediction analysis of each label separately. For the second category, we take the shap value with label 1, that is, shap_values[1]
- When each row is analyzed separately, it is called shap_values[1].iloc[index]
Kernel explainer principle
To calculate one of the features of a record_ Values as an example to illustrate the calculation process:
- Convert sample features into numbers
- Randomly generate N random numbers as a mask, and calculate the original features with this mask to obtain n new features
- The new n features are brought into the model prediction to obtain the prediction results. The change of the prediction results and the law of that feature are observed to obtain the shap_value
Example of interpreting prediction results using shap
Training lightgbm model:
import lightgbm as lgb
import shap
from sklearn.model_selection import train_test_split, StratifiedKFold
import warnings

X, y = shap.datasets.adult()
X_display, y_display = shap.datasets.adult(display=True)

# create a train/test split
random_state = 7
X_train, X_test, y_train, y_test = train_test_split(X, y, test_size=0.2, random_state=random_state)
d_train = lgb.Dataset(X_train, label=y_train)
d_test = lgb.Dataset(X_test, label=y_test)

params = {
    "max_bin": 512,
    "learning_rate": 0.05,
    "boosting_type": "gbdt",
    "objective": "binary",
    "metric": "binary_logloss",
    "num_leaves": 10,
    "verbose": -1,
    "min_data": 100,
    "boost_from_average": True,
    "random_state": random_state
}

model = lgb.train(params, d_train, 10000, valid_sets=[d_test], early_stopping_rounds=50, verbose_eval=1000)
model
# <lightgbm.basic.Booster object at 0x000001B96CBFAD48>
Build the interpreter and get the expected value:
explainer = shap.TreeExplainer(model)  #  Using the tree model interpreter
explainer
# Out[5]: <shap.explainers._tree.Tree at 0x1b96cca5e48>
expected_value = explainer.expected_value
expected_value
# Out[7]: array([-2.43266725])
Build the interpreter and get the expected value:
features.shape
# Out[17]: (20, 12)
shap_values = explainer.shap_values(features)  # Calculate shap_values
len(shap_values)
# Out[12]: 2
shap_values[0].shape
# Out[13]: (20, 12)
Draw decision diagram:
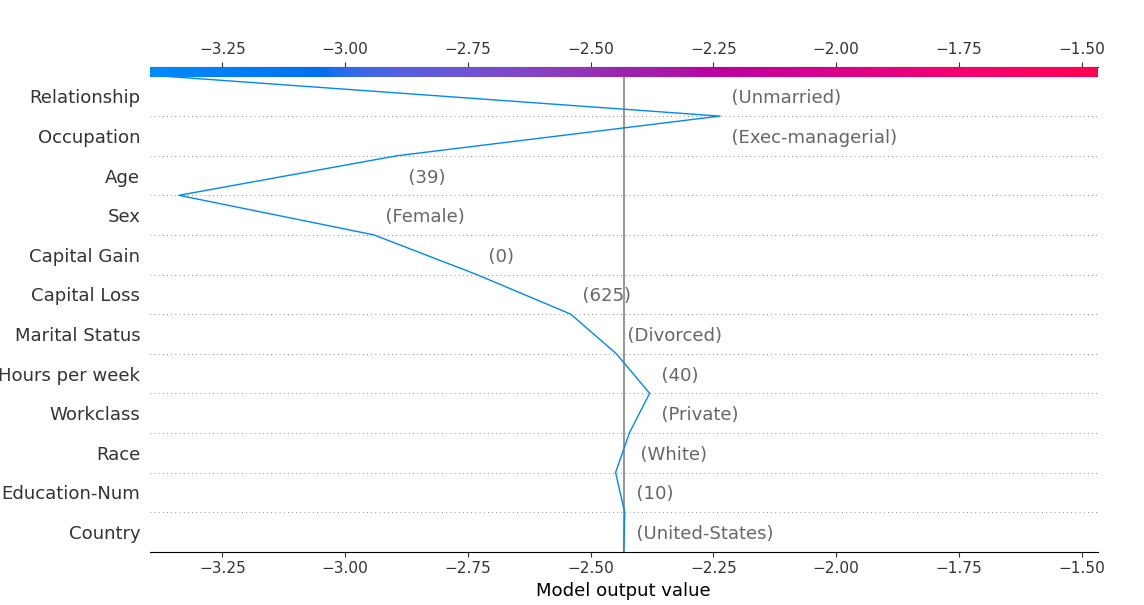
shap.decision_plot(base_value=expected_value, shap_values=shap_values[1][:1], features=features_display[:1])
Output:

decision_plot explanation:
- The x-axis is the output of the model, the y-axis is the feature name, and the line represents the prediction process
- The output of the model is usually a probability, and the logarithmic probability is the output of the model
- shap_values: the shap of the data to be interpreted_ values
- Features: it is estimated that it is used to extract column names. You can not pass or use features_ Names instead
- The greater the amplitude of characteristic pull, the greater the impact on the prediction results. The impact is divided into positive impact and negative impact
- Find the features that have a great impact on the positive and their values to explain the prediction results
Efforts can also be used to explain the prediction results:
shap.force_plot(explainer.expected_value[0], shap_values[1][:1], features[:1], matplotlib=True)
