1. Introduction to imutils function
imutils is a package based on OPenCV, which can call the OPenCV interface more simply. It can easily realize a series of operations such as image translation, rotation, scaling, skeletonization and so on.
Installation method:
pip install imutils
Confirm that numpy,scipy,matplotlib and opencv are installed before installation.
2. Usage of imutils
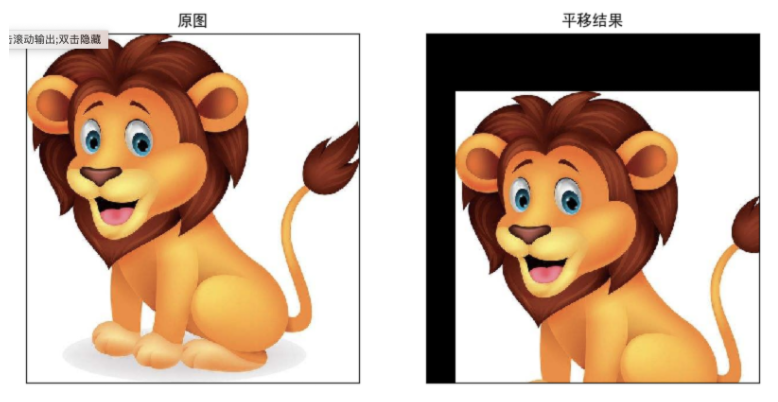
2.1 image translation
OpenCV also provides the implementation of image translation. First calculate the translation matrix, and then realize the translation by affine transformation. The image can be translated directly in imutils.
translated = imutils.translate(img,x,y)
Parameters:
- img: image to move
- x: Number of pixels moved along the X axis
- y: Number of pixels moved along the Y axis
2.2 image scaling
In the OPenCV, pay attention to the zoom of the picture to ensure that the aspect ratio is maintained. In imutils, the aspect ratio of the original picture is automatically maintained, and only the width weight and Height can be specified.
img = cv.imread("lion.jpeg")
resized = imutils.resize(img,width=200)

print("Original image size: ",img.shape)
print("Scaled size:",resized.shape)

plt.figure(figsize=[10, 10])
#subplot refers to the statement of placing multiple graphs in the same window. subplot(m,n,p) is used to specify the position of the graph to be placed. In a window, m indicates that there are m rows and N indicates that there are n columns. A total of m*n graphs can be placed. Press from left to right and from top to bottom. The p is the position to be placed (p < m*n)
plt.subplot(1,2,1)#A FIGURE graph generates two subgraphs in one row, two columns, and the following 1 indicates that the second subgraph is currently activated.
plt.imshow(cv.cvtColor(img, cv.COLOR_BGR2RGB))
plt.title('Original drawing')
plt.axis("off")
plt.subplot(1,2,2)
plt.imshow(cv.cvtColor(resized, cv.COLOR_BGR2RGB))
plt.title('Zoom results')
plt.axis("off")
plt.show()
The following figure shows the result of zooming the image:

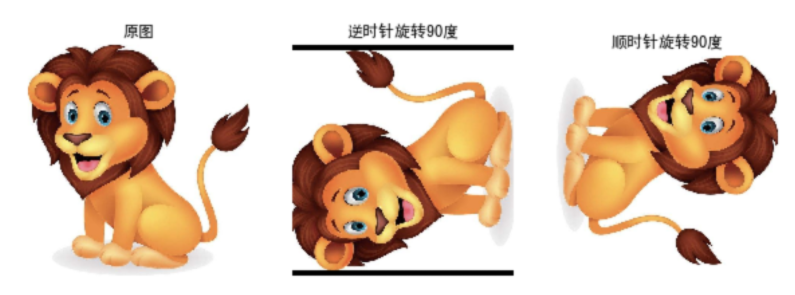
2.3 image rotation
Affine transformation is used for rotation in OpenCV. Here, the image rotation method is imutils.rotate(), followed by two parameters, the first is the image data, the second is the rotation angle, and the rotation is counterclockwise. At the same time, imutils provides another similar method, rotate_round(), which rotates clockwise.
import cv2
import imutils

image = cv2.imread('lion.jpeg')
rotated = imutils.rotate(image, 90)   #Clockwise
rotated_round = imutils.rotate_bound(image, 90)   #anti-clockwise

plt.figure(figsize=[10, 10])

plt.subplot(1,3,1)
plt.imshow(img[:,:,::-1])
plt.title('Original drawing')
plt.axis("off")

plt.subplot(1,3,2)
plt.imshow(rotated[:,:,::-1])
plt.title('Rotate 90°CCW')
plt.axis("off")

plt.subplot(1,3,3)
plt.imshow(rotated_round[:,:,::-1])
plt.title('Rotate 90 degrees clockwise')
plt.axis("off")

plt.show()
The results are as follows:
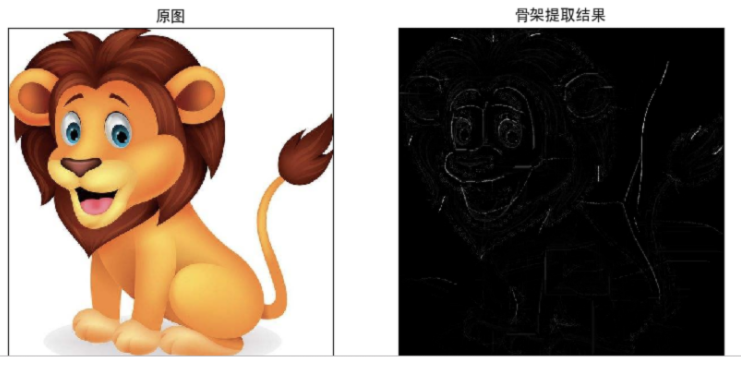
2.4 skeleton extraction
Skeleton extraction refers to the process of constructing the topological skeleton of the objects in the picture. The method provided by imutils is skeleton (). The second parameter is the size of the structure element, which is equivalent to a granularity. The smaller the size, the longer the processing time.
import cv2
import imutils
# 1 image reading
img = cv2.imread('lion.jpeg')
# 2 grayscale
gray = cv2.cvtColor(img, cv2.COLOR_BGR2GRAY)
# 3 skeleton extraction
skeleton = imutils.skeletonize(gray, size=(3, 3))
# 4 image display
plt.figure(figsize=(10,8),dpi=100)
plt.subplot(121),plt.imshow(img[:,:,::-1]),plt.title('Original drawing')
plt.xticks([]), plt.yticks([])
plt.subplot(122),plt.imshow(skeleton,cmap="gray"),plt.title('Skeleton extraction results')
plt.xticks([]), plt.yticks([])
plt.show()
The effects are as follows:
2.5 Matplotlib display
Color images in Python are loaded in BGR mode using OpenCV. But Matplotib is RGB mode. Therefore, if the color image has been read by opencv, it will not be displayed correctly by Matplotib.
In OpenCV, images are in BGR order. When using this cv2.imshow function, the effect is very good.
However, if you use Matplotlib to display images, the plt.imshow function will assume that the images are arranged in RGB order, resulting in the image being different from the original image.
2.5.1 displaying images with OpenCV
Original image:

(passing through your world -- Daocheng Aden)
Original color display:
#coding:utf-8
# Import the package used for image display
import cv2
# Display color image   It can be considered that the default is the original color of the image
# Import picture location
img_path = './img.jpg'
# Read image
src_img = cv2.imread(img_path)
# Get image height and width
img_info = src_img.shape
print("The height of the image is:{} Height:{} The number of channels is:{}".format(img_info[0],img_info[1],img_info[2]))
# Display image
cv2.imshow("src_img",src_img)
cv2.waitKey(0)
cv2.destroyAllWindows()
Display results:

Grayscale image display:
#coding:utf-8
# Import the package used for image display
import cv2
# Display color image   It can be considered that the default is the original color of the image
# Import picture location
img_path = './img.jpg'
# Read grayscale image
src_img = cv2.imread(img_path,0)
# Get image height and width
img_info = src_img.shape
print("The height of the image is:{} Height:{}".format(img_info[0],img_info[1]))
# Display image
cv2.imshow("src_img",src_img)
cv2.waitKey(0)
cv2.destroyAllWindows()
Display results:

2.5.2 displaying images with Matplotlib
Original image:
Original color display:
Problem analysis: the images in OpenCV are stored in the order of BGR channels. However, the Matplotlib mentioned today is displayed in RGB mode, so if it is displayed directly, it will not be the result we want to see, such as:
#coding:utf-8
# Import the package used for image display
import cv2
import matplotlib.pyplot as plt


# Display color image   It can be considered that the default is the original color of the image
# Import picture location
img_path = './img.jpg'
img = cv2.imread(img_path)
# The grayscale image shows that cmap(color map) needs to be set to gray
plt.imshow(img)
plt.show()
Display results:

Correct display: the image channel needs to be converted to RGB
#coding:utf-8
# Import the package used for image display
import cv2
import matplotlib.pyplot as plt


# Displaying a color image can be considered as the original color of the image by default
# Import picture location
img_path = './img.jpg'
img = cv2.imread(img_path)
img_cvt = cv2.cvtColor(img, cv2.COLOR_BGR2RGB)
# The grayscale image shows that cmap(color map) needs to be set to gray
plt.imshow(img_cvt)
plt.show()
Display results:

Grayscale image display:
#coding:utf-8
# Import the package used for image display
import cv2
import matplotlib.pyplot as plt


# Displaying a color image can be considered as the original color of the image by default
# Import picture location
img_path = './img.jpg'
img = cv2.imread(img_path,0)
# The grayscale image shows that cmap(color map) needs to be set to gray
plt.imshow(img, cmap='gray')
plt.show()
Display results:

Analysis: if you look at the code carefully, you will find that the image read by opencv is already a gray image, but when displaying with plt, you have to add gray to the parameter summary, otherwise the color space is wrong.
For example:
#coding:utf-8
# Import the package used for image display
import cv2
import matplotlib.pyplot as plt


# Displaying a color image can be considered as the original color of the image by default
# Import picture location
img_path = './img.jpg'
img = cv2.imread(img_path) # Here is to read the original image directly
# The grayscale image shows that cmap(color map) needs to be set to gray
plt.imshow(img, cmap='gray')
plt.show()
Display results:
2.5.3 quickly solve the problem of BGR to RGB mode display
Call cv2.cvtColor to solve this problem, or use the convenient function of opencv2matplotlib.
img = cv.imread("lion.jpeg")
plt.figure()
plt.imshow(imutils.opencv2matplotlib(img))
two point six Detection of OPenCV version
After the release of OpenCV 4, with the update of major versions, the backward compatibility problem is particularly prominent. When using OpenCV, you should check which version of OpenCV is currently being used, and then use the appropriate function or method. Is in imutils_ cv2(),is_cv3() and is_cv4() is a simple feature that can be used to automatically determine the version of OpenCV for the current environment.
print("OPenCV edition: {}".format(cv2.__version__))
print("OPenCV It's 2.X? {}".format(imutils.is_cv2()))
print("OPenCV It's 3.X? {}".format(imutils.is_cv3()))
print("OPenCV It's 4.X? {}".format(imutils.is_cv4()))
The output is:
summary
- imutils is a convenient image processing toolkit based on OPenCV
- Using imutils, you can easily complete the functions of image translation, scaling, rotation, skeleton extraction and so on