I haven't written a blog for a long time, mainly because I've been busy lately. Today, I have a piece in my busy schedule.
================ I am a gorgeous partition line==============
Micro-service architecture is a distributed architecture. Micro-service system is divided into service units according to business. A micro-service often has many service units. A request often involves many units. Once an exception occurs, it is not easy to locate the problem point. Therefore, it is necessary to have something to track the request link and record which services a request invokes. Units, the order of invocation and the length of processing time in each service unit. Common service link tracking components include google's dapper, twitter's zipkin, Ali's hawk's eye and so on. They are outstanding open source link tracking components.
Spring cloud has its own components to integrate these open source components, spring cloud sleuth, which provides a complete solution for service link tracking.
Today's topic is how to use spring cloud sleuth to integrate zipkin for service link tracking. This blog will focus on the following clues:
- Server Code Implementation
- Client-side code implementation
- Execution testing
From the above clues, we can find that zipkin is divided into server and client.
The client is our service unit, which is used to send link information to the server.
The server is used to receive and process the link information sent by the client. It consists of four parts:
- Collector Component: Used to receive link information sent by client and then organize it into zipkin format for subsequent storage or external query.
- Storage Component: The link information is saved, stored in memory by default, and can be saved to places like mysql by configuration.
- Restful API components: Provide api interfaces for other service units to query link information.
- Web UI Component: Call API Component's interface and display information to web screen.
Don't talk too much nonsense, just go to the code.
1. Server Code Implementation
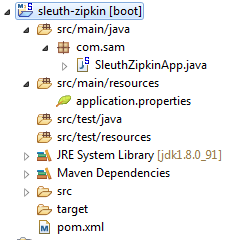
Give the code structure first:

The structure is relatively simple and the construction process is as follows:
- New maven project sleuth-zipkin
- Modify the pom file
<project xmlns="http://maven.apache.org/POM/4.0.0"
    xmlns:xsi="http://www.w3.org/2001/XMLSchema-instance"
    xsi:schemaLocation="http://maven.apache.org/POM/4.0.0 http://maven.apache.org/xsd/maven-4.0.0.xsd">
    <modelVersion>4.0.0</modelVersion>
    <groupId>com.sam</groupId>
    <artifactId>sleuth-zipkin</artifactId>
    <version>0.0.1-SNAPSHOT</version>

    <parent>
        <groupId>org.springframework.boot</groupId>
        <artifactId>spring-boot-starter-parent</artifactId>
        <version>1.5.1.RELEASE</version>
    </parent>

    <properties>
        <javaVersion>1.8</javaVersion>
    </properties>
    <!-- Use dependencyManagement Version management -->
    <dependencyManagement>
        <dependencies>
            <dependency>
                <groupId>org.springframework.cloud</groupId>
                <artifactId>spring-cloud-dependencies</artifactId>
                <version>Camden.SR6</version>
                <type>pom</type>
                <scope>import</scope>
            </dependency>
        </dependencies>

    </dependencyManagement>

    <dependencies>
        <!-- Introduce zipkin-server Dependency, Provision server End function -->
        <dependency>
            <groupId>io.zipkin.java</groupId>
            <artifactId>zipkin-server</artifactId>
        </dependency>
        <!-- Introduce zipkin-autoconfigure-ui Dependency, used to provide zipkin web ui Component functions to facilitate viewing of relevant information -->
        <dependency>
            <groupId>io.zipkin.java</groupId>
            <artifactId>zipkin-autoconfigure-ui</artifactId>
        </dependency>

        <!-- Introduce eureka rely on -->
        <dependency>
            <groupId>org.springframework.cloud</groupId>
            <artifactId>spring-cloud-starter-eureka</artifactId>
        </dependency>

    </dependencies>
</project>
- New Startup Class
/**
 * @EnableZipkinServer
 *
 * Used to turn on Zipkin Server functionality
 *
 */
@EnableZipkinServer
@SpringBootApplication
@EnableDiscoveryClient
public class SleuthZipkinApp {

    public static void main(String[] args) {
        SpringApplication.run(SleuthZipkinApp.class, args);
    }

}
- New configuration file
server.port=9411
spring.application.name=sleuth-zipkin
#You need to use the eureka service registry
eureka.client.serviceUrl.defaultZone=http://localhost:1111/eureka
2. Client-side Code Implementation
Here we are going to use the micro services already implemented in the previous essay. Gateway service api-gateway,Consumer hello-consumer and producer hello-server You can click on the link to see the build process, which is not described in detail here. The following modifications have been made in these microservices:
- Introducing dependency
<! - Introducing zipkin dependency to provide the function of zipkin client - > <dependency> <groupId>org.springframework.cloud</groupId> <artifactId>spring-cloud-starter-zipkin</artifactId> </dependency> - Modify the configuration file and add two additional configurations
# Specify the url of the zipkin server
spring.zipkin.base-url=http://localhost:9411
# Set the sample collection rate to 100%
spring.sleuth.sampler.percentage=1.0
Because of the large number of requests in distributed systems, it is impossible to collect all the requests links, so sleuth uses sampling collection to set a sampling percentage. In the development phase, we usually set a percentage of 100% or 1.
III. Executing Tests
- Start microservices in turn: service registry eureka, Zipkin server sleuth-zipkin, gateway service api-gateway, consumer hello-consumer and producer hello-server
- Visit http://localhost:1111/, confirm that four microservices have been successfully registered in the service registry

- Visit http://localhost:5555/hello-consumer/hello-consumer?accessToken=111 and access through the zuul gateway.

View the api-gateway console:
2018-07-19 18:02:34.999  INFO [api-gateway,4c384ab23da1ae35,4c384ab23da1ae35,true] 9296 --- [nio-5555-exec-3] com.sam.filter.AccessFilter              : send GET request to http://localhost:5555/hello-consumer/hello-consumer
2018-07-19 18:02:45.088  INFO [api-gateway,,,] 9296 --- [trap-executor-0] c.n.d.s.r.aws.ConfigClusterResolver      : Resolving eureka endpoints via configuration
Look at the scarlet letter section. There are four parts separated by commas. The first part is the service name; the second part is TranceId, which has a unique tranceId for each request; the third part is spanId, which generates a spanId for each unit of work to send a request, and each request generates a tranceId and multiple spanId. According to tranceId and spanId, we can analyze which service units a complete request has experienced; the fourth part is boolean. Type I, used to mark whether the request link needs to be sampled and collected and sent to zipkin for sorting.
- Visit the zipkin server http://localhost:9411/, and view the UI page

Select api-gateway and click Find Trances

You can see which service nodes the requests have gone through. By clicking on the relevant link s, you can see the order of calls and the length of processing time at each service node.

Switch to Dependency Screen to view the dependencies of service nodes
