After reading the simple example of making Apexcharts.js chart in the official Manual of Dcat Admin, I didn't quite understand how to use it.
In the past, the chart plug-in was made by the echart chart plug-in that the front-end sister went to find. I have never learned about the Apexcharts.js chart plug-in.
Apexcharts.js official website is an all English document, translated with Baidu software, and took some time to learn.
I made a study note in the Jane book:
(1) About installation and linear diagram cases
www.jianshu.com/p/82f5c1e2c336
I have preliminarily understood the usage of Apexcharts.js.
According to the official JS code example of Apexcharts, the JS program is divided into three parts:
(1) Define the options object,
(2)new ApexCharts() instantiation operation.
(3) Call the render() method to render the chart.
As shown in the following code: the most important work is to configure the options object clearly. JS uses {} object representation, which will be converted into [] array in PHP.
var options = {
  chart: {
    type: 'line'
  },
  series: [{
    name: 'sales',
    data: [30,40,35,50,49,60,70,91,125]
  }],
  xaxis: {
    categories: [1991,1992,1993,1994,1995,1996,1997, 1998,1999]
  }
}

var chart = new ApexCharts(document.querySelector("#chart"), options);

chart.render();
As for the definition of options object, there are up to 25 kinds of attributes. Its official website: apexcharts.com/docs/options/annota... Related class properties are introduced in.
I use mind mapping to record some common class attributes.
www.jianshu.com/p/768e03273492
The other is the demo code examples of 12 kinds of charts provided on its official website:
apexcharts.com/javascript-chart-de...
What kind of chart do we want to make, find the code on it, and then convert it into php.
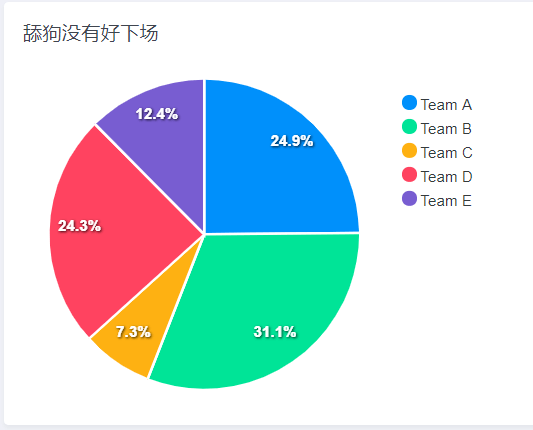
Following the example given on the official website, I made a pie chart:

The original JS code of this pie chart: apexcharts.com/javascript-chart-de...
I have simplified the code given on the official website of Dcat. The following is the code. I have deleted some unnecessary places, which is the most simplified and easy to understand.
Dcat Admin makes charts
First look at the JS code in the pie chart, and then turn it into php code.
var options = {
          series: [44, 55, 13, 43, 22],
          chart: {
             width: 380,
             type: 'pie',
        },
        labels: ['Team A', 'Team B', 'Team C', 'Team D', 'Team E'],
Step 1 import files
namespace App\Admin\Widgets\Chart;
use Dcat\Admin\Admin;
use Dcat\Admin\Widgets\ApexCharts\Chart;
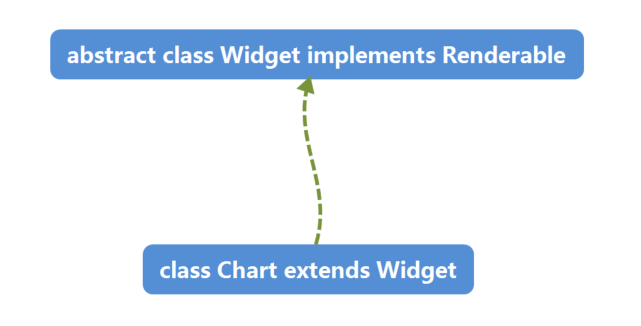
The Widgets\ApexCharts\Chart class is the chart class defined by Dcat, and its parent class is Widget (an abstract class)

2. Build class
I defined a class called Pie, which has two class member methods
| method | explain |
|---|---|
| __construct | Constructor |
| setUpOptions | Initialize option method |
In fact, you can initialize options directly in the constructor, but for the beauty of the code, you still put it into the setOptions method. The name of this method can be customized and named at will.
class Pie extends Chart{

//Constructor, you can use it directly
    public function __construct($containerSelector = null, $options = [])
    {
        parent::__construct($containerSelector, $options);

        $this->setUpOptions();
    }

  //The initialization method mainly calls the $this - > Options () method to initialize the entire option.
  protected function setUpOptions()
    {
        $this->options([
            "chart"=>[
                "width"=>380,
                "type"=>"pie"
            ],
        ]);

        // Execute your data query logic
        $data = [44, 55, 13, 43, 22];
        $label = ['Team A', 'Team B', 'Team C', 'Team D', 'Team E'];
        //The option() method is also defined in the Dcat\Admin\Widgets class. It is responsible for setting the options property
        $this->option("series",$data);
        $this->option("labels",$label);

    }
options() here is the method defined in the Dcat\Admin\Widgets class.
There is a member attribute options in the Widget class, which is responsible for storing the configuration items in the diagram.
Batch settings can be made through the options() method.
protected $options = [];
After this operation, the render() method is defined in the Widget class, which will be called automatically for rendering. In the chart class defined by ourselves, we only need the above two methods. It's easy to understand. You can enrich your own custom chart classes as needed.
3. Use in controller
In the controller, you need to first introduce the Card class and the custom chart class
use Dcat\Admin\Widgets\Card;
use App\Admin\Widgets\Chart\Pie;
Then, in the controller method, call the Card::make() method
public function pic(Content $content){
        return $content->body(
            Card::make('Licking a dog doesn't end well',Pie::make())
        );
}
The make() method has two parameters:
Parameter 1: receive string, which will be displayed as the title of the chart
Parameter 2: it is our custom chart class object.
After the above operations are completed, the chart can be rendered.
This document is only used as a learning record and the underlying code flow, so I won't post it.