1, Crash type
- Crash is generally generated from iOS microkernel Mach, and then converted into UNIX SIGABRT signal at BSD layer, which is provided to users in the form of standard POSIX signal. NSException is thrown programmatically by the user when processing App logic.
- Crash on iOS can be divided into three categories:
-
- Mach exception: EXC_CRASH;
-
- UNIX signal: SIGABRT;
-
- Abnormal exit of program NSException caused by system crash.
2, Crash types in iOS
① EXC_BAD_ACCESS
- Exc occurs when an object that has been released is accessed or a message is sent to it_ BAD_ ACCESS.
- Cause exc_ BAD_ The most common reason for access is that the wrong ownership modifier is used when initializing variables, which will lead to the premature release of objects. For example, the ownership modifier of an NSArray attribute is set to assign instead of strong. When this crash occurs, you can't get useful stack information by viewing the crash log, which can be solved through NSZombieEnabled.
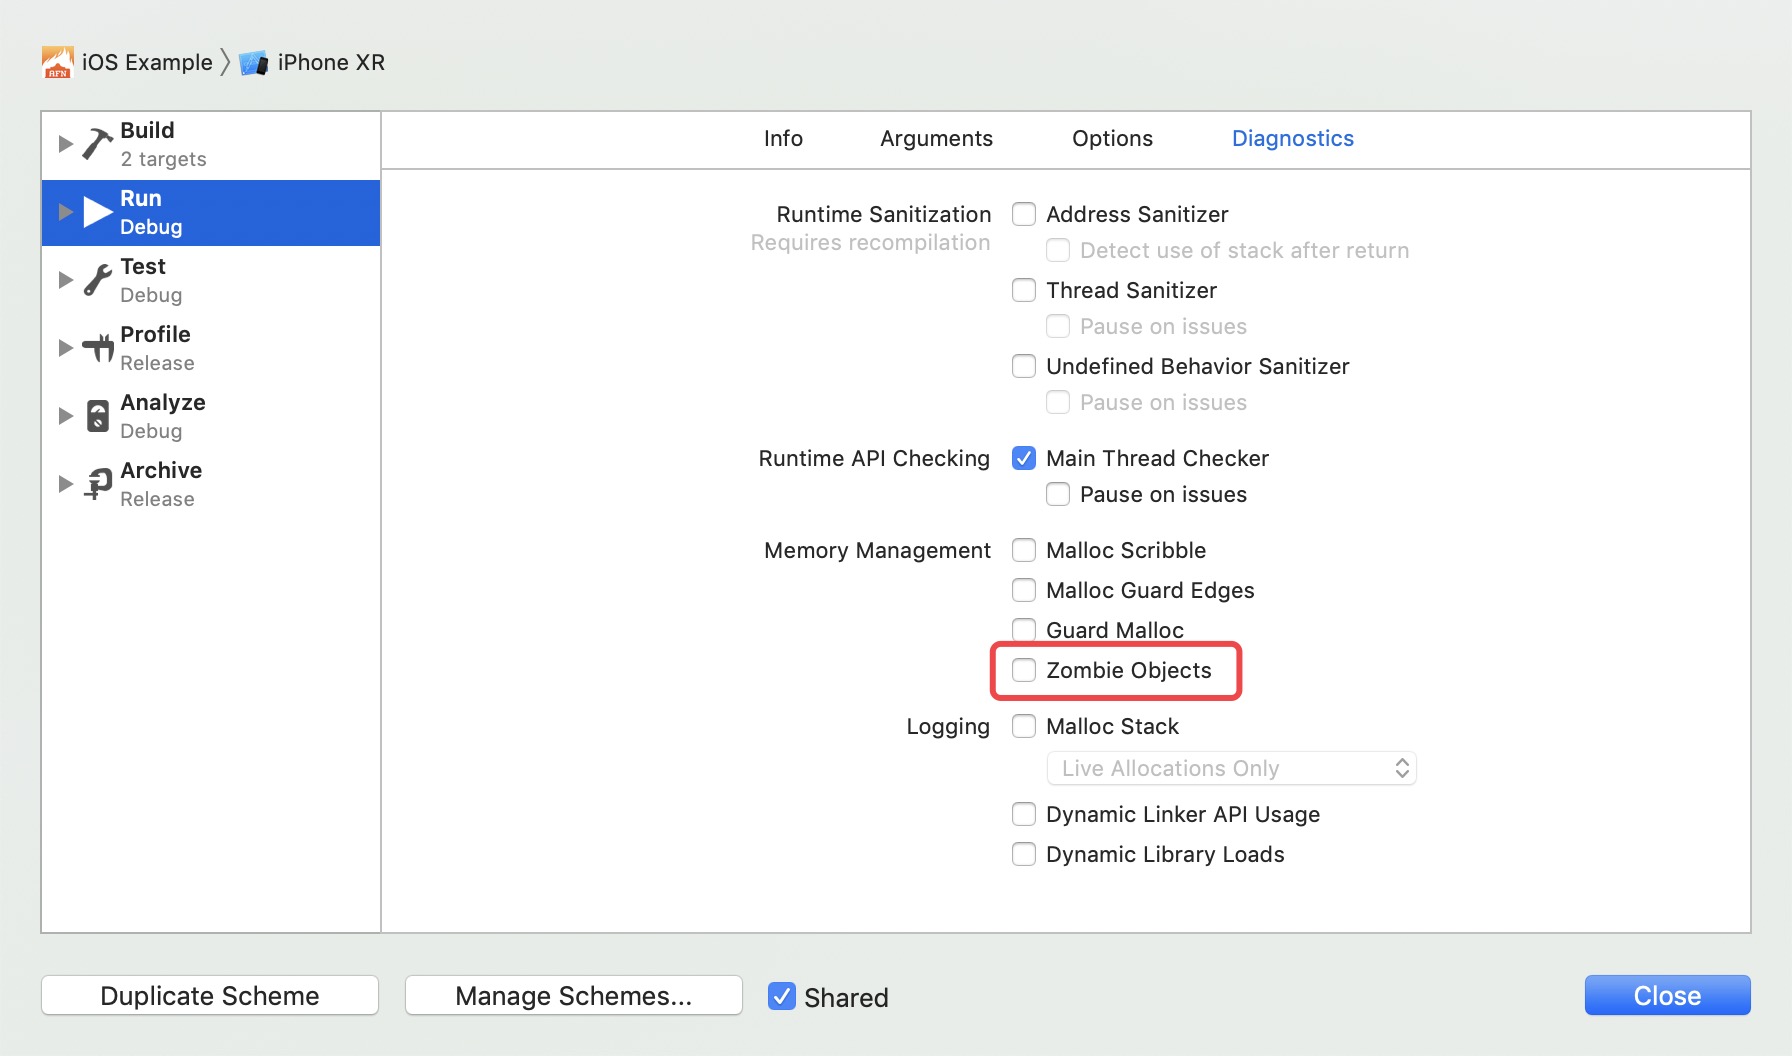
- NSZombieEnabled is an environment variable used to debug memory related problems and track the release process of objects. When enabled, it will use a zombie implementation to convert the object into a zombie object when the object calls dealloc, that is, when the reference count drops to 0. The purpose of the zombie object is to display a log and automatically jump into the debugger when sending a message to it.
- Therefore, when NSZombie is enabled in the application instead of causing the application to crash directly, an incorrect memory access will become an unrecognized message sent to the zombie object. The zombie object displays the received message and jumps into the debugger so that you can see what's wrong. Enable as shown in the figure:
② SIGSEGV
- Segment error message (SIGSEGV) is a more serious problem caused by the operating system. This error occurs when the hardware makes an error, accesses an unreadable memory address, or writes data to a protected memory address.
- It is not common to receive SIGSEGV when the data stored in RAM is to be read and there is a problem with the ram hardware at this location. The following two situations occur more frequently:
-
- When a pointer in the application points to the code page and attempts to modify the value pointing to the position;
-
- When the value of a pointer is to be read, it is initialized to a garbage value pointing to an invalid memory address.
- SIGSEGV errors are more difficult to debug, and the most common cause of SIGSEGV is incorrect type conversion. Avoid overusing pointers or trying to manually modify pointers to read private data structures. If you do that and don't pay attention to memory alignment and filling when modifying the pointer, you will receive SIGSEGV.
③ SIGBUS
- The bus error signal (SIGBUG) represents an invalid memory access, that is, the accessed memory is an invalid memory address.
- In other words, the location pointed to by that address is not a physical memory address at all (it may be the address of a hardware chip). SIGSEGV and SIGBUS are exc_ BAD_ Subtype of access.
④ SIGTRAP
- Sigrap represents a trap signal. It is not a real crash signal. It will be sent when the processor executes the trap instruction.
- The LLDB debugger typically processes this signal and stops running at the specified breakpoint. If you receive an unexplained sigrap, you can usually solve this problem by clearing the last output and then rebuilding it.
⑤ EXC_ARITHETIC
- When you want to divide by zero, the application will receive EXC_ARITHMETIC signal. This error should be easy to solve.
⑥ SIGILL
- SIGILL stands for signal illegal instruction.
- It occurs when an illegal instruction is executed on the processor. Executing an illegal instruction means that when a function pointer is given to another function, the function pointer is bad for some reason, pointing to a released memory or a data segment. Sometimes you get EXC_BAD_INSTRUCTION is not SIGILL. Although they are the same thing, EXC_* Equivalent to this signal, independent of architecture.
⑦ SIGABRT
- SIGABRT stands for SIGNAL ABORT.
- When the operating system finds an unsafe situation, it can control this situation more; If necessary, it can ask the process to clean up. There is no trick in debugging the underlying error that causes this signal. Frameworks such as Cocos2d or UIKit usually call the C function abort (which sends this signal) when specific preconditions are not met or some bad situations occur.
- When SIGABRT appears, the console usually outputs a lot of information to explain what went wrong. Since it is a controllable crash, you can type the bt command on the LLDB console to print the backtrace information.
⑧ Watchdog timeout
- This kind of crash is usually easier to distinguish, because the error code is fixed 0x8badf00d (the programmer humorously reads it as Ate Bad Food).
- On iOS, it often occurs when executing a synchronous network call and blocking the main thread. Therefore, never make synchronous network calls.
3, Crash capture
- In daily development, the following crash collection methods can be used:
-
- Third party platforms: Fabric, Youmeng, Tencent Bugly, Flurry, Crashlytics, etc. data will be uploaded to these platforms;
-
- Third party tools: KSCrash, plcrashreporter, etc., which can handle the collected crash by themselves;
-
- Custom capture + stack symbolization.
① Mach exception capture
- If you want to capture mach exceptions, you need to register an exception port, which will be valid for all threads of the current task. If you want to target a single thread, you can use thread_set_exception_ports registers its own exception port. When an exception occurs, it will first throw the exception to the exception port of the thread, and then try to throw it to the exception port of the task. When we catch an exception, we can do some work, such as current stack collection.
② NSException exception capture
- NSException exception is a crash caused by OC code.
- NSException exception and Signal signal exception can be caught by registering related functions:
	// Save the registered exception capture method
	NSUncaughtExceptionHandler * oldExceptionHandler;
	// Custom exception handling
	void ExceptionHandler(NSException * exception);

	void RegisterExceptionHandler()  {
	    if(NSGetUncaughtExceptionHandler() != ExceptionHandler) {
	        oldExceptionHandler = NSGetUncaughtExceptionHandler();
	    }
	    NSSetUncaughtExceptionHandler(ExceptionHandler);
	}
- NSSetUncaughtExceptionHandler is used for exception handling and has very limited functions. Most of the causes of the crash are memory access errors, repeated release errors, etc. it can't do anything because it throws a Signal.
- At the same time, it is worth noting that if multiple crash collection components are registered in an application, there will inevitably be a conflict problem. At this time, we need to judge whether the handler has been registered before registration. If it has been registered, we need to save the previously registered handler function pointer, and throw out the corresponding handler after the crash is processed.
	/**
	 *  @brief  exception Crash handling
	 */
	void ExceptionHandler(NSException * exception) {
	    // Increment UncaughtExceptionCount
	    int32_t exceptionCount = OSAtomicIncrement32(&UncaughtExceptionCount);

	    // The number of times allowed to catch errors has been exceeded
	    if (exceptionCount > UncaughtExceptionMaximum) {
	        return;
	    }

	    // Get call stack
	    NSMutableDictionary * userInfo = [NSMutableDictionary dictionaryWithDictionary:[exception userInfo]];
	    userInfo[kUncaughtCallStackKey] = [exception callStackSymbols];

	    NSException * exp = [NSException exceptionWithName:exception.name
	                                                reason:exception.reason
	                                              userInfo:userInfo];
	    // Execute method in main thread
	    [[[UncaughtExceptionHandler alloc] init] performSelectorOnMainThread:@selector(dealException:)
	                                                              withObject:exp
	                                                           waitUntilDone:YES];

	    // Call the saved handler
	    if (oldExceptionHandler) {
	        oldExceptionHandler(exception);
	    }
	}
③ Signal signal acquisition
- The Signal signal is an exception thrown by the Signal signal Signal after the exception conversion of the MAC Signal at the bottom of iOS. Since it is a posix compliant exception, you can also register the corresponding Signal through the sigaction function.
- Because there are many signal signals, some signals will not be generated in iOS applications. Only several common types of signals need to be registered:
| signal | value | introduce | scene |
|---|---|---|---|
| SIGILL | 4 | Illegal instruction | 1. Illegal instructions were executed 2. It is usually due to an error in the executable file itself or an attempt to execute a data segment 3. This signal may also be generated when the stack overflows |
| SIGABRT | 6 | Call abort | When the program finds an error and calls abort, some C library functions (such as strlen) are generated |
| SIGSFPE | 8 | Floating point operation error | For example, divide by 0 |
| SIGSEGV | 11 | Segment illegal error | 1. Attempt to access memory that is not allocated to you 2. Or try to write data to a memory address without write permission 3. Null pointer 4. Array out of bounds 5. Stack overflow, etc |
- Next, register a SIGABRT signal. Before registering a handler, you need to save the previously registered handler:
	typedef void (* SignalHandlerClass)(int, struct __siginfo *, void *);

	// Registered singal capture method
	SignalHandlerClass oldSignalHandler;

	static void MySignalHandler(int signal, siginfo_t* info, void* context) {

	    // do something. . .

	    if (signal == SIGABRT) {
	        if (oldSignalHandler) {
	            oldSignalHandler(signal, info, context);
	        }
	    }
	}

	void registerSignalHandler() {
	    // Get registered handler
	    struct sigaction old_action;
	    sigaction(SIGABRT, NULL, &old_action);
	    if (old_action.sa_flags & SA_SIGINFO) {
	        SignalHandlerClass handler = old_action.sa_sigaction;
	        if (handler != MySignalHandler) {
	            oldSignalHandler = handler;
	        }
	    }

	    struct sigaction action;
	    action.sa_sigaction = MySignalHandler;
	    action.sa_flags = SA_NODEFER | SA_SIGINFO;
	    sigemptyset(&action.sa_mask);
	    sigaction(signal, &action, 0);
	}
4, Collect call stack
- The call stack can be collected by using the system api, or by referring to third-party implementations such as PLCrashRepoter to obtain all thread stacks. The key codes of using system api are as follows:
	+ (NSArray *)backtrace {
	    /*  Pointer list.

	        ①,backtrace It is used to obtain the call stack of the current thread, and the obtained information is stored in the callstack here
	        ②,128 Used to specify how many void * elements can be saved in the current buffer
	     */
	    void * callstack[128];

	    // The return value is the number of pointers actually obtained
	    int frames = backtrace(callstack, 128);

	    // backtrace_symbols converts the information obtained from the backtrace function into a string array. Each string contains a printable information relative to the corresponding element in callstack, including function name, offset address and actual return address.
	    // Returns a pointer to an array of strings
	    char **strs = backtrace_symbols(callstack, frames);

	    NSMutableArray * backtrace = [NSMutableArray arrayWithCapacity:frames];
	    for (int i = 0; i < frames; i++) {
	        [backtrace addObject:[NSString stringWithUTF8String:strs[i]]];
	    }
	    free(strs);
	    return backtrace;
	}
5, Stack symbolization
- The stack information obtained through the system api may only be a string of memory addresses, which is difficult to obtain useful information to help troubleshoot problems. Therefore, it is necessary to symbolize the stack information:
	// Before unsigned
	Thread 0 name:  Dispatch queue: com.apple.main-thread
	Thread 0 Crashed:
	0   libobjc.A.dylib                 0x000000018b816f30 0x18b7fc000 + 110384 (objc_msgSend + 16)
	1   UIKit                           0x0000000192e0a79c 0x192c05000 + 2119580 (<redacted> + 72)
	2   UIKit                           0x0000000192c4db48 0x192c05000 + 297800 (<redacted> + 312)
	3   UIKit                           0x0000000192c4d988 0x192c05000 + 297352 (<redacted> + 160)
	4   QuartzCore                      0x00000001900d6404 0x18ffc5000 + 1119236 (<redacted> + 260)

	// After symbolization
	Thread 0 name:  Dispatch queue: com.apple.main-thread
	Thread 0 Crashed:
	0   libobjc.A.dylib                 0x000000018b816f30 objc_msgSend + 16
	1   UIKit                           0x0000000192e0a79c -[UISearchDisplayController _sendDelegateDidBeginDidEndSearch] + 72
	2   UIKit                           0x0000000192c4db48 -[UIViewAnimationState sendDelegateAnimationDidStop:finished:] + 312
	3   UIKit                           0x0000000192c4d988 -[UIViewAnimationState animationDidStop:finished:] + 160
	4   QuartzCore                      0x00000001900d6404 CA::Layer::run_animation_callbacks(void*) + 260
- The idea of symbolization is to find the dsym symbol table file for the current application, and restore the symbol name corresponding to the crash stack memory address by using tools such as symbol cache (built in the Organizer of Xcode), dwarfdump, atos, etc. It should be noted that if the application uses its own or a third-party dynamic library, the application crashes in the dynamic library Image instead of the main program Image. We need a dsym symbol table corresponding to the dynamic library to symbolize it.
- After the idea is clear, the next two problems are faced. One problem is how to map the current crash application to the dsym symbol table. Another problem is how to symbolize by memory address. Before solving these two problems, you need to understand the binary format and loading process of executable files.
① Mach-O file format
- Different operating systems define different executable file formats. For example, ELF format of Linux platform, PE format of Windows platform and executable file format of iOS are called Mach-O. Executable files, dynamic libraries and dsym files are all in this file format.
- The following figure shows the official Mach-O format structure:
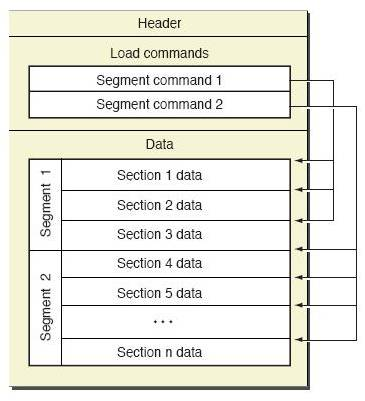
- As you can see, the Mach-O file is divided into three parts:
-
- Header: the handler defines the basic information of the file, including file size, file type, platform used, etc. you can find the relevant definitions in the loader.h header file:
	/*
	 * The 64-bit mach header appears at the very beginning of object files for
	 * 64-bit architectures.
	 */
	struct mach_header_64 {
	    uint32_t    magic;      /* mach magic number identifier */
	    cpu_type_t  cputype;    /* cpu specifier */
	    cpu_subtype_t   cpusubtype; /* machine specifier */
	    uint32_t    filetype;   /* type of file */
	    uint32_t    ncmds;      /* number of load commands */
	    uint32_t    sizeofcmds; /* the size of all the load commands */
	    uint32_t    flags;      /* flags */
	    uint32_t    reserved;   /* reserved */
	};
-
- load commands: this section defines detailed load instructions, indicating how to load into memory. From the definition of the ab initio file, you can see the basic load_ The command structure contains only cmd and cmdsize. The cmd type can be escaped into different types of load command structures:
	struct load_command {
	    uint32_t cmd;       /* type of load command */
	    uint32_t cmdsize;   /* total size of command in bytes */
	};
-
- Data part: including code segment, data segment, symbol table and other specific binary data.
-
-
- You can use otool to view the specific contents of binary files. More intuitively, you can use Mach-O View to browse the specific contents of executable files.
-
-
-
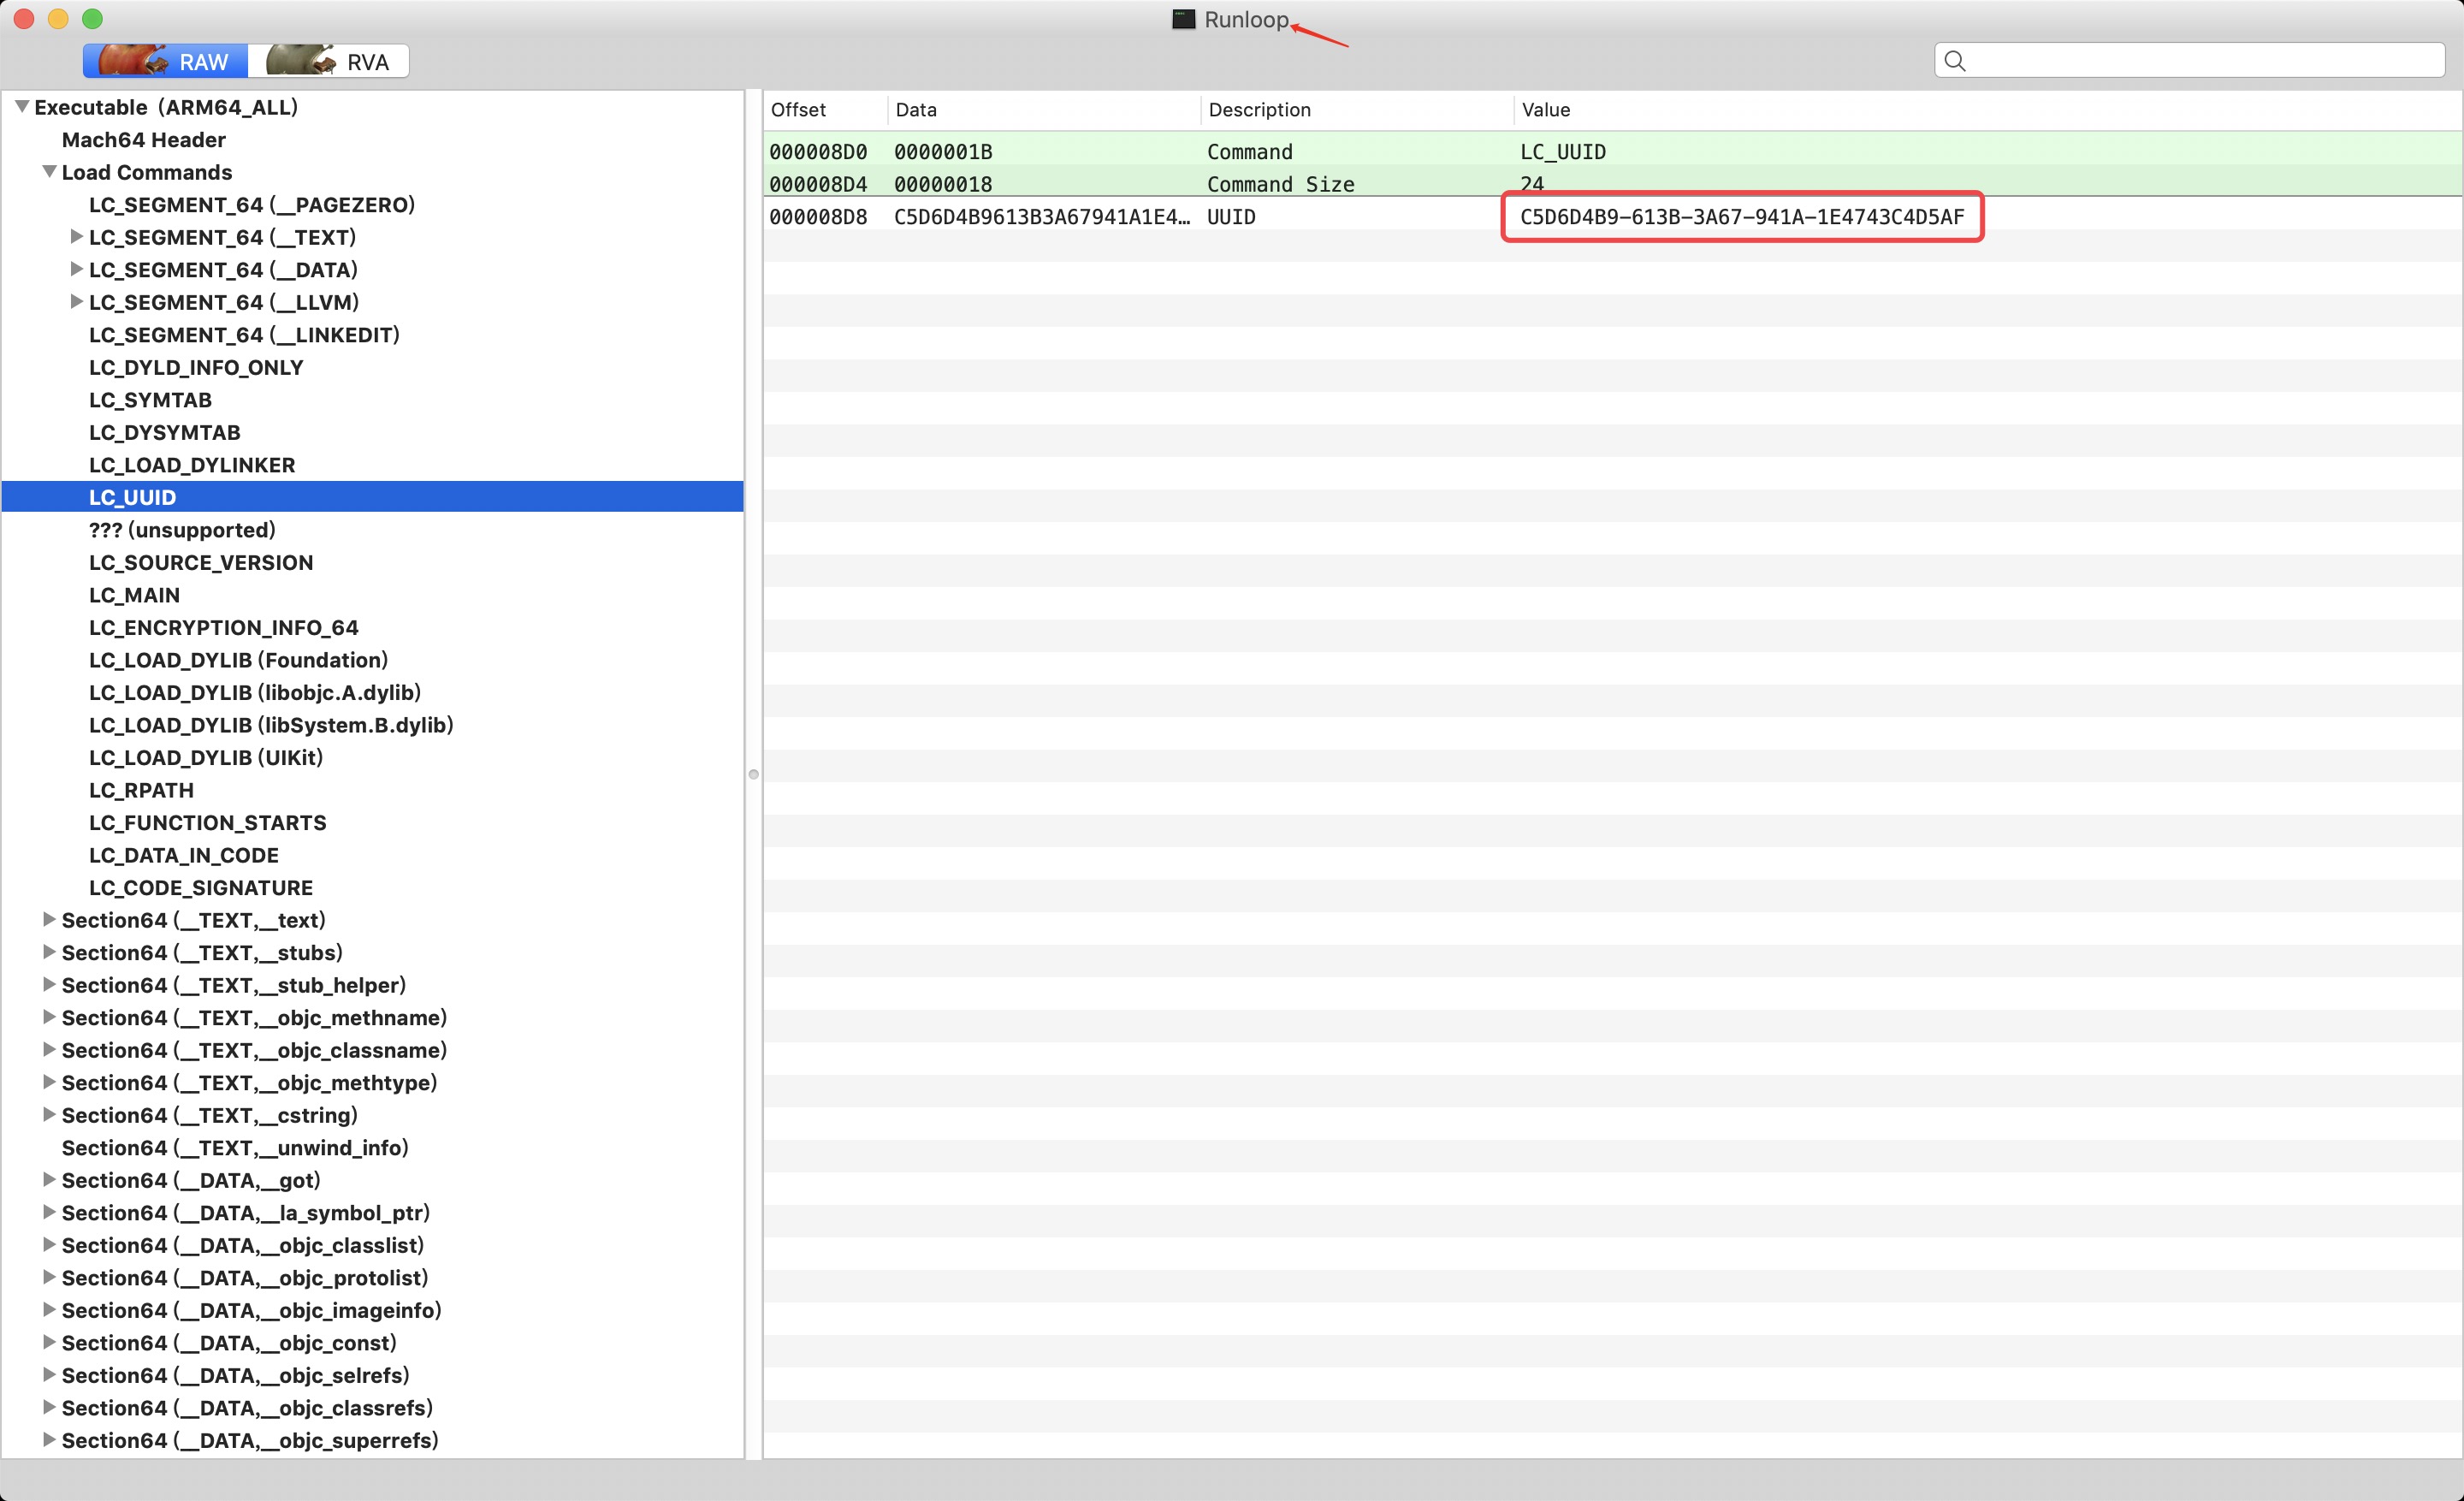
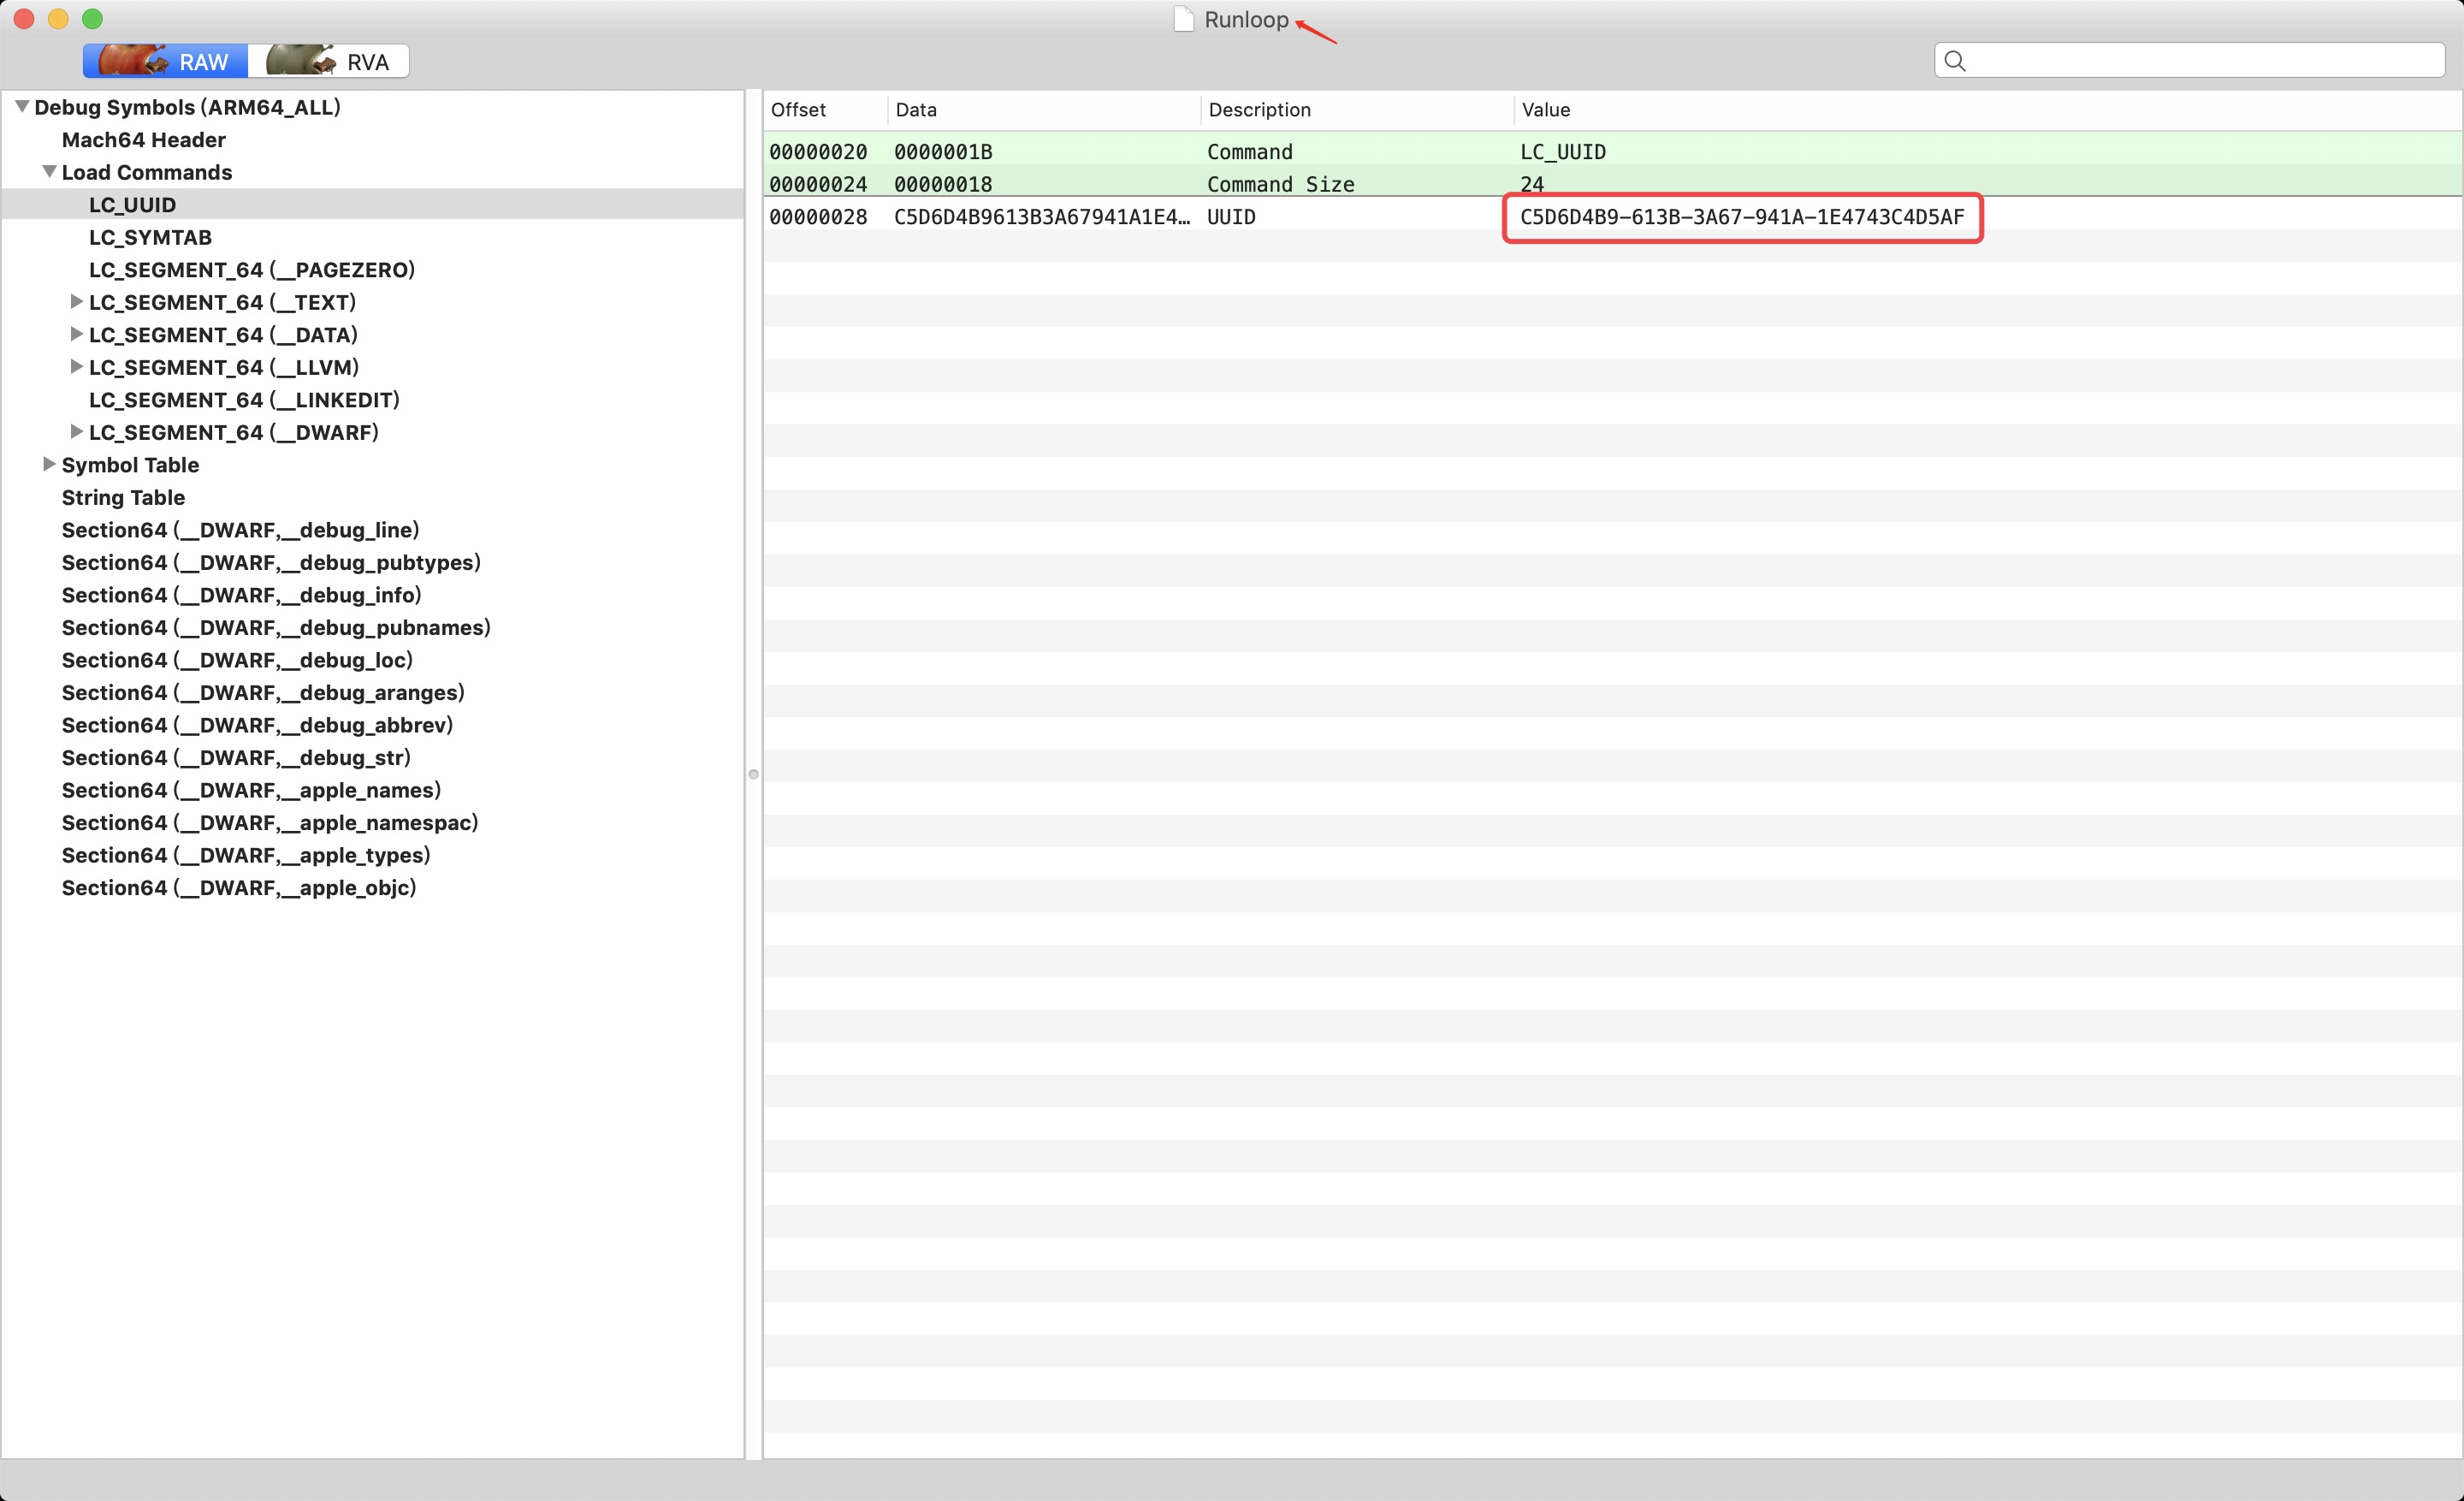
- The following figure shows an executable file and its corresponding symbol table file. There are many load command s for executable files, including code segments, data segments, function entries, loading dynamic libraries and other instructions. Where LC_UUID field and LC in symbol table_ UUID is exactly corresponding, that is, the executable and dsym symbol table can be matched through the UUID field.
-
② Executable loading process
- The loading process of an iOS application is as follows:
-
- Firstly, the kernel loads the executable file (Mach-O) and obtains the path of dyld from it;
-
- Then load dyld, and dyld takes over the dynamic library loading, symbol binding and other work. The initialization of runtime is also carried out at this stage;
-
- Finally, dyld calls the main function, which brings you to the main function entry.
- In this process, the operating system uses ASLR technology for security. Address space layout randomization is to use a random address space every time an application is loaded, which can effectively prevent being attacked.
- VM Address is the starting position of the compiled Image, Load Address is the starting position loaded into the virtual memory at runtime, and Slide is the offset loaded into the memory. This offset value is a random value, which is different every time. There is the following formula:
Stack Address = Symbol Address + Slide
- Symbolization is the process of finding the corresponding symbol information from Symbol Address to dsym file.
③ Get Binary Images information
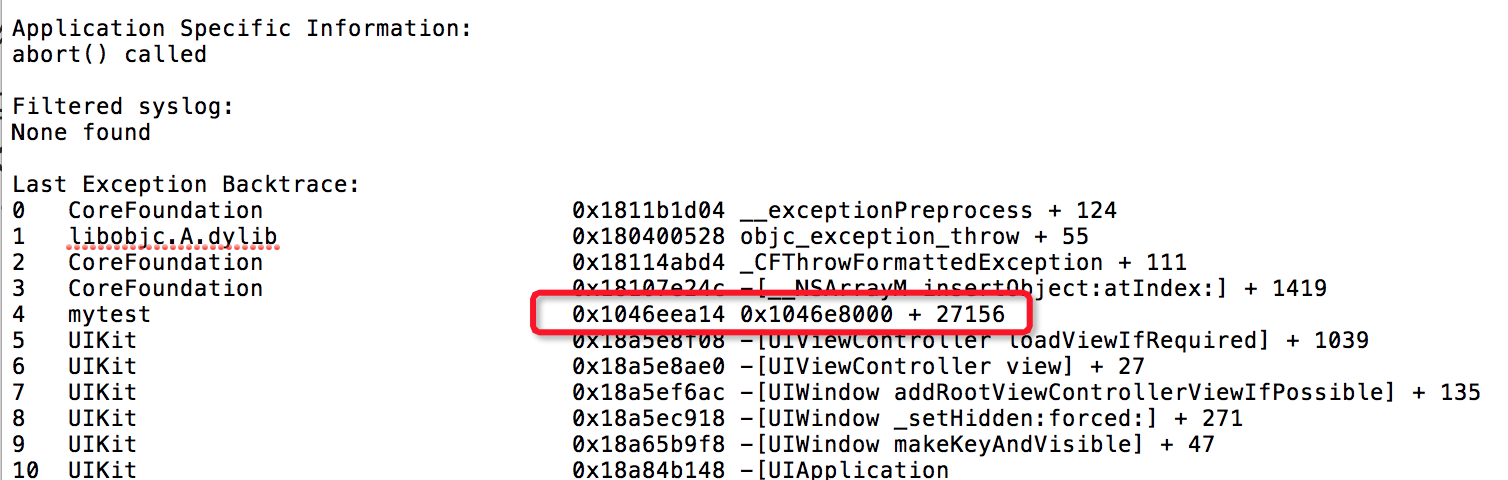
- For the currently collected crash log, the error address Stack Address is located at 0x1046eea14, which is 27156 offset from the Load Address 0x1046e8000. 27156 here is not the random offset Slide of ASLR, but the symbol relative position offset (Symbol Address - VM Address):
- Then observe the crash log. At the end of the crash log, there is a column of Binary Images, which records all UUID s loaded with images and load addresses:
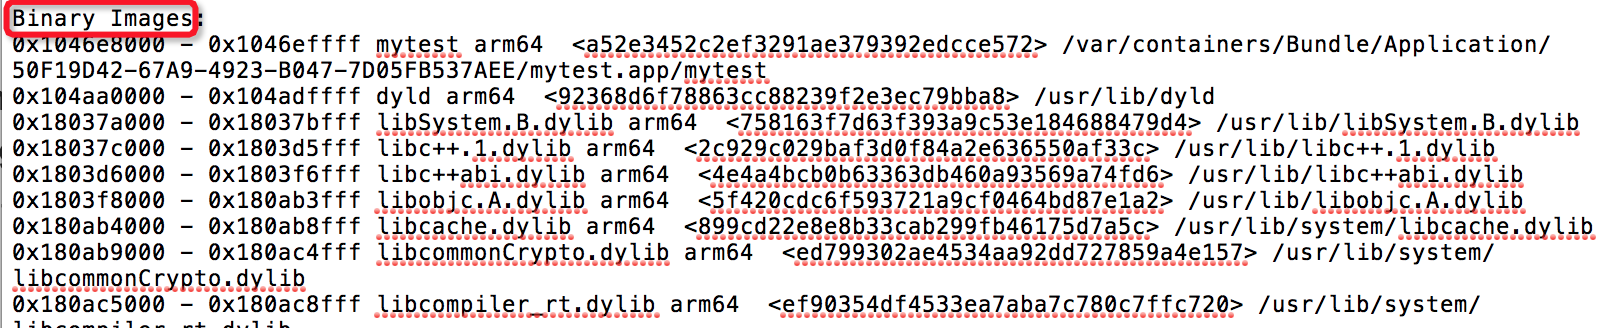
- According to the UUID correspondence mentioned above and the conversion relationship between Load Address and Symbol Address, symbolization can be realized as long as Binary Images information can be obtained.
- uuid is stored in the load command of Mach-O, corresponding to uuid_ The uuid field of the command structure can be obtained by traversing all load commands. Slide offset can be through Image_ dyld_ get_ Image_ vmaddr_ The slide method iterates through all Image acquisition.
- VM Address is also stored in load command, corresponding to segment_ The vmaddr field of the command structure. Pay attention to segment_command has many types and nuances that need to distinguish between 32-bit and 64 bit applications.
- The parsing code is as follows:
	for (uint32_t i = 0; i < _dyld_image_count(); i++) {
        uint64_t vmbase = 0;
        uint64_t vmslide = 0;
        uint64_t vmsize = 0;

        uint64_t loadAddress = 0;
        uint64_t loadEndAddress = 0;
        NSString *imageName = @"";
        NSString *uuid;

        const struct mach_header *header = _dyld_get_image_header(i);
        const char *name = _dyld_get_image_name(i);
        vmslide = (i);
        imageName = [NSString stringWithCString:name encoding:NSUTF8StringEncoding];
        BOOL is64bit = header->magic == MH_MAGIC_64 || header->magic == MH_CIGAM_64;
        uintptr_t cursor = (uintptr_t)header + (is64bit ? sizeof(struct mach_header_64) : sizeof(struct mach_header));
        struct load_command *loadCommand = NULL;
        for (uint32_t i = 0; i < header->ncmds; i++, cursor += loadCommand->cmdsize) {
            loadCommand = (struct load_command *)cursor;
            if(loadCommand->cmd == LC_SEGMENT) {
                const struct segment_command* segmentCommand = (struct segment_command*)loadCommand;
                if (strcmp(segmentCommand->segname, SEG_TEXT) == 0) {
                    vmsize = segmentCommand->vmsize;
                    vmbase = segmentCommand->vmaddr;
                }
            } else if(loadCommand->cmd == LC_SEGMENT_64) {
                const struct segment_command_64* segmentCommand = (struct segment_command_64*)loadCommand;
                 if (strcmp(segmentCommand->segname, SEG_TEXT) == 0) {
                    vmsize = segmentCommand->vmsize;
                    vmbase = (uintptr_t)(segmentCommand->vmaddr);
                }
            }
            else if (loadCommand->cmd == LC_UUID) {
                const struct uuid_command *uuidCommand = (const struct uuid_command *)loadCommand;
                NSString *uuidString = [[[NSUUID alloc] initWithUUIDBytes:uuidCommand->uuid] UUIDString];
                uuid = [[uuidString stringByReplacingOccurrencesOfString:@"-" withString:@""] lowercaseString];
            }
        }

        loadAddress = vmbase + vmslide;
        loadEndAddress = loadAddress + vmsize - 1;
    }
  // do something...
④ Symbolization
- Through the above code, you can collect the same crash log as the system. Next, you can use dwarfdump and atos for symbolization.
- dwarfdump symbolization:
-
- After getting the crash log, first determine whether the dsym file matches. You can use the dwarfdump --uuid command to view the UUIDs of all schemas in the dsym file:
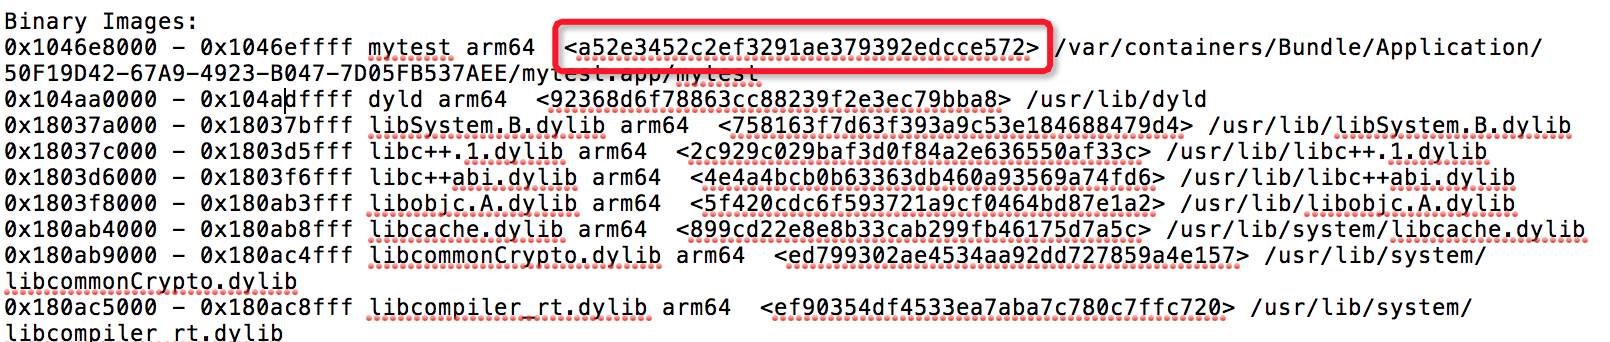
	$ dwarfdump --uuid mytest.app.dSYM
	UUID: B4217D5B-0349-3D9F-9D70-BC7DD60DA121 (armv7) mytest.app.dSYM/Contents/Resources/DWARF/mytest

	UUID: A52E3452-C2EF-3291-AE37-9392EDCCE572 (arm64) mytest.app.dSYM/Contents/Resources/DWARF/mytest
-
- You can see that the A52E3452-C2EF-3291-AE37-9392EDCCE572 contained in the arm64 architecture of the dsym file matches the UUID in Binary Images.
-
- You can use the dwarfdump --lookup command to symbolize the error stack. The format is as follows:
dwarfdump --arch [arch type] --lookup [Symbol Address] [dsym file path]
-
- For the Stack Address 0x1046eea14 of the error stack, a conversion is required. Given that the VM Address is 0x100000000, the Load Address is 0x1046e8000, and the Slide is 0x46e8000. Calculate the Symbol Address as 0x100006a14 through the formula Symbol Address = Stack Address - Slider. Enter the command:
	$ dwarfdump --arch arm64 --lookup 0x100006a14 mytest.app.dSYM
	----------------------------------------------------------------------
	File: mytest.app.dSYM/Contents/Resources/DWARF/mytest (arm64)
	----------------------------------------------------------------------
	Looking up address: 0x0000000100006a14 in .debug_info... found!

	0x0003ebb7: Compile Unit: length = 0x000000d4  version = 0x0004  abbr_offset = 0x00000000  addr_size = 0x08  (next CU at 0x0003ec8f)

	0x0003ebc2: TAG_compile_unit [120] *
	             AT_producer( "Apple LLVM version 9.1.0 (clang-902.0.39.2)" )
	             AT_language( DW_LANG_ObjC )
	             AT_name( "/Users/worthyzhang/Desktop/mytest/mytest/ViewController.m" )
	             AT_stmt_list( 0x00009151 )
	             AT_comp_dir( "/Users/worthyzhang/Desktop/mytest" )
	             AT_APPLE_optimized( true )
	             AT_APPLE_major_runtime_vers( 0x02 )
	             AT_low_pc( 0x00000001000069bc )
	             AT_high_pc( 0x000000a4 )

	0x0003ebf9:     TAG_subprogram [122] *
	                 AT_low_pc( 0x00000001000069bc )
	                 AT_high_pc( 0x00000070 )
	                 AT_frame_base( reg29 )
	                 AT_object_pointer( {0x0003ec12} )
	                 AT_name( "-[ViewController viewDidLoad]" )
	                 AT_decl_file( "/Users/worthyzhang/Desktop/mytest/mytest/ViewController.m" )
	                 AT_decl_line( 17 )
	                 AT_prototyped( true )
	                 AT_APPLE_optimized( true )
	Line table dir : '/Users/worthyzhang/Desktop/mytest/mytest'
	Line table file: 'ViewController.m' line 25, column 1 with start address 0x0000000100006a14

	Looking up address: 0x0000000100006a14 in .debug_frame... not found.
-
- You can locate the function name [ViewController viewDidLoad] and file name, line number and other information where the error is reported.
- Symbolize atos through the command line tool:
-
- If you simply get the symbol name, you can use atos to symbolize it. The command format is as follows:
atos -o [dsym file path] -l [Load Address] -arch [arch type] [Stack Address]
-
- Note: dsym file path is a dSYM file, not a folder ending in. dSYM. Enter the command:
	$ atos -o mytest.app.dSYM/Contents/Resources/DWARF/mytest -l 0x1046e8000 --arch arm64 0x1046eea14
	-[ViewController viewDidLoad] (in mytest) (ViewController.m:25)
-
- It is easy to use when there are multiple. app,. dSYM,. crash. It is used to symbolize a single address (you can use script batching).
-
- Each executable program has a build UUID to uniquely identify it (each build is different). The crash log contains the build UUID of the application (app) where the crash occurred and the [build UUID] of all library files loaded by the application when the crash occurred.
	# Gets the UUID of the crash file
	grep "appName armv" *crash
	# perhaps
	grep --after-context=2 "Binary Images:" *crash

	# Get UUID of app
	xcrun dwarfdump --uuid appName.app/appName
	# Get UUID of dSYM
	xcrun dwarfdump --uuid appName.dSYM

	# Compare UUID s of app and crash for matching

	# Use the atos command to symbolize the loading address of a specific module (all three methods can be used)
	# 0x4000 is the loading address of the module (it must be the address of the DWARF file, not the address of dSYM, which is just a bundle)
	xcrun atos -o appName.app.dSYM/Contents/Resources/DWARF/appName -l 0x4000 -arch armv7
	xcrun atos -o appName.app.dSYM/Contents/Resources/DWARF/appName -arch armv7
	xcrun atos -o appName.app/appName -arch armv7

	# In addition, the method of obtaining UUID in the application

	#import <mach-o/ldsyms.h>
	NSString *executableUUID() {
	    const uint8_t *command = (const uint8_t *)(&_mh_execute_header + 1);
	    for (uint32_t idx = 0; idx < _mh_execute_header.ncmds; ++idx) {
	        if (((const struct load_command *)command)->cmd == LC_UUID) {
	            command += sizeof(struct load_command);
	            return [NSString stringWithFormat:@"%02X%02X%02X%02X-%02X%02X-%02X%02X-%02X%02X-%02X%02X%02X%02X%02X%02X",
	                    command[0], command[1], command[2], command[3],
	                    command[4], command[5],
	                    command[6], command[7],
	                    command[8], command[9],
	                    command[10], command[11], command[12], command[13], command[14], command[15]];
	        } else {
	            command += ((const struct load_command *)command)->cmdsize;
	        }
	    }
	    return nil;
	}

	# If you download dSYM through the iTunes Connect website, execute each downloaded dSYM file once
	xcrun dsymutil -symbol-map ~/Library/Developer/Xcode/Archives/[...]/BCSymbolMaps [UUID].dSYM
- Example:
	# There are two lines of unsigned crash log
	* 3 appName 0x000f462a 0x4000 + 984618
	* 4 appName **0x00352aee** 0x4000 + 3468014

	# 1. Implementation
	xcrun atos -o appName.app.dSYM/Contents/Resources/DWARF/appName -l 0x4000 -arch armv7
	# 2. Then enter 0x00352aee
	# 3. Symbolic results:
	-[UIScrollView(UITouch) touchesEnded:withEvent:] (in appName) (UIScrollView+UITouch.h:26)