I. What is a sunrise chart?
Sunrise chart is a new chart added in Excel 2016. Some are similar to pie charts. The advantage of pie charts is that they can show the proportion. But pie charts can only display single-level data. Sunrise maps are used to represent the proportion of multi-level data. Sunrise maps are displayed in a hierarchical manner and are very suitable for displaying hierarchical data. The proportion of each level in the hierarchy is expressed by a circle. The more recent the surface circle is from the origin, the higher the level of the surface circle is. The innermost circle represents the top-level structure, and then the proportion of the data is looked at layer by layer.
Through a simple example, we can feel the charm of the sunrise chart.
|
quarter |
Month |
week |
Sales volume |
|
Q1 |
January |
|
29 |
|
February |
First week |
63 |
|
|
Second weeks |
54 |
||
|
Third weeks |
91 |
||
|
Fourth week |
78 |
||
|
March |
|
49 |
|
|
Q2 |
April |
|
66 |
|
May |
|
110 |
|
|
June |
|
42 |
|
|
Q3 |
July |
|
19 |
|
August |
|
73 |
|
|
September |
|
109 |
|
|
Q4 |
October |
|
32 |
|
November |
|
112 |
|
|
December |
|
99 |
Table 1 Sales statistics of a product
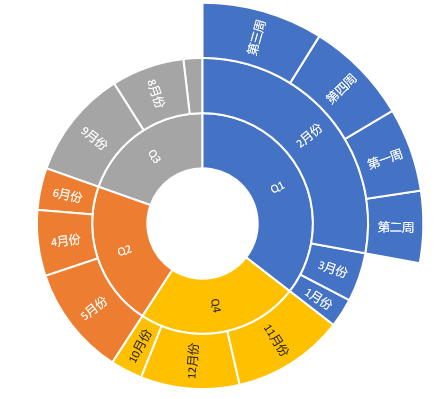
Figure 1 Sales shown in the sunrise chart
From Table 1 we can see that it is a hierarchical data, the first level is quarterly, the second level is month, and the third level is week. Figure 1 is a sunrise chart drawn in Excel according to Table 1. The inner layer shows the first quarter, the outer ring shows the second month, and the outer ring shows the third week. Each proportion shown is calculated according to its corresponding sales.
2. Simple examples
After we understand the sunrise chart, in some scenarios we want to use the sunrise chart in our system. Wijmo JS controls are provided to allow us to use sunrise maps on the pure front end of the Web. If you want to use the sunrise chart under. Net platform, you can learn about ComponentOne FlexChart . Through the following simple example, we have a preliminary understanding of how to use the sunrise chart.
HTML file:
1. Introducing Wijmo's css and js
    <!-- Styles -->
    <link href="styles/vendor/wijmo.min.css" rel="stylesheet" />
    <link href="styles/app.css" rel="stylesheet" />

    <!-- Wijmo -->
    <script src="scripts/vendor/wijmo.min.js" type="text/javascript"></script>
    <script src="scripts/vendor/wijmo.chart.min.js" type="text/javascript"></script>
<script src="scripts/vendor/wijmo.chart.hierarchical.min.js" type="text/javascript"> </script>
2. Define a DIV
This DIV user displays the sunrise chart.
<div id="introChart"></div>
3. Introducing custom js files
<script src="scripts/app.js"></script>
<script src="scripts/sunburst.js"></script>
app.js:
// Generate data
var app = {
    getData: function () {
        var data = [],
            months = [['Jan', 'Feb', 'Mar'], ['Apr', 'May', 'June'], ['Jul', 'Aug', 'Sep'], ['Oct', 'Nov', 'Dec']],
            years = [2014, 2015, 2016];

        years.forEach(function (y, i) {
            months.forEach(function (q, idx) {
                var quar = 'Q' + (idx + 1);
                q.forEach(function (m) {
                    data.push({
                        year: y.toString(),
                        quarter: quar,
                        month: m,
                        value: Math.round(Math.random() * 100)
                    });
                });
            });
        });

        return data;
    },
};
An app class is created, which contains a getData method for generating a multilevel data. Its levels are year, quarter and month.
sunburst.js:
(function(wijmo, app) {
    'use strict';

    // Create controls
    var chart = new wijmo.chart.hierarchical.Sunburst('#introChart');

    // Initialize the sunrise chart
    chart.beginUpdate();

    // Valuable attribute names contained in the sunrise chart
    chart.binding = 'value';

    // Set the name of the sub-item in the hierarchical data to generate the sub-item in the sunrise map
    chart.bindingName = ['year', 'quarter', 'month'];

    // set up data sources
    chart.itemsSource = app.getData();

    // Set the location of the data display
    chart.dataLabel.position = wijmo.chart.PieLabelPosition.Center;

    // Setting the content of the data display
    chart.dataLabel.content = '{name}';

    // Setting Selection Mode
    chart.selectionMode = 'Point';

    chart.endUpdate();
})(wijmo, app);
Create a Sunburst object based on Div's ID and set the data source and related properties. The data source is provided through app.getData().
The following is the result of the program running.

Figure 2 Running results
3. Implementing Periodic Table of Elements with "Sunrise Diagram"
With the above knowledge reserve, we can do a more complex implementation. Next, we use the "sunrise chart" to realize the periodic table of elements. When we were in high school, we should have studied the periodic table of elements, which is similar to the following table. This table shows more information about elements, but it does not show very good information about the classification of elements. Now we use the sunrise chart to do it and improve on it.

Figure 3. Periodic table of elements
HTML file:
Similar to the simple example, you need to introduce Wijmo-related styles and js files.
1. Introducing custom js files
<script src="scripts/DataLoader.js"></script>
<script src="scripts/app.js"></script>
2. Define a DIV
<div id="periodic-sunburst" class="periodic-sunburst"></div>
DataLoader.js:
A DataLoader class is created, which provides two methods. The readFile method reads the json file to get the data. The isInclude method determines whether a specified element exists in an array. Data is processed in the generateCollectionView method.
var DataLoader = {};

// First class classification
var METALS_TITLE = "Metal";
var NON_METALS_TITLE = "Nonmetal";
var OTHERS_TITLE = "Transition element";

// Two level classification
var METAL_TYPES = 'alkali metal|Alkaline-earth metal|transition metal|Lanthanide|Actinides|Other metals'.split('|');
var NON_METAL_TYPES = 'inert gas|halogen|Nonmetal'.split('|');
var OTHER_TYPES = 'Quasi metal|Super actinide system'.split('|');

DataLoader = {

    readFile: function (filePath, callback) {
        var reqClient = new XMLHttpRequest();
        reqClient.onload = callback;
        reqClient.open("get", filePath, true);
        reqClient.send();
    },

    isInclude: function (arr, data) {
        if (arr.toString().indexOf(data) > -1)
            return true;
        else
            return false;
    },

    generateCollectionView: function (callback) {
        DataLoader.readFile('data/elements.json', function (e) {

            // get data
            var rawElementData = JSON.parse(this.responseText);
            var elementData = rawElementData['periodic-table-elements'].map(function (item) {
                item.properties.value = 1;
                return item.properties;
            });

            var data = new wijmo.collections.CollectionView(elementData);

            //  utilize wijmo.collections.PropertyGroupDescription Grouping at the first level
            data.groupDescriptions.push(new wijmo.collections.PropertyGroupDescription('type', function (item, prop) {
                if (DataLoader.isInclude(METAL_TYPES, item[prop])) {
                    return METALS_TITLE;
                } else if (DataLoader.isInclude(NON_METAL_TYPES, item[prop])) {
                    return NON_METALS_TITLE;
                } else {
                    return OTHERS_TITLE;
                }
            }));

            // Grouping at the second level
            data.groupDescriptions.push(new wijmo.collections.PropertyGroupDescription('type', function (item, prop) {
                return item[prop];
            }));

            callback(data);
        });
    }
};
The generateCollectionView method calls readFile to get json data, and then uses the CollectionView provided in Wijmo to group the data in two levels. The first level is metal, non-metal and transition elements. The second level is their sublevel. Level 3 is the element, and each element has a Value of 1, indicating the same proportion of elements.
app.js:
Compared with the previous simple example, the data source bound here is CollectionView.Groups, which is the first level grouping in CollectionView.
var mySunburst;

function setSunburst(elementCollectionView) {

    // Create Sunrise Chart Control
    mySunburst = new wijmo.chart.hierarchical.Sunburst('#periodic-sunburst');

    mySunburst.beginUpdate();

    // Illustrations for setting sunrise charts are not displayed
    mySunburst.legend.position = 'None';

    // Setting the radius of the inner circle
    mySunburst.innerRadius = 0.1;

    // Setting Selection Mode
    mySunburst.selectionMode = 'Point';

    // Set the location of the data display
    mySunburst.dataLabel.position = 'Center';

    // Setting the content of the data display
    mySunburst.dataLabel.content = '{name}';

    // Data binding
    mySunburst.itemsSource = elementCollectionView.groups;

    // Property names that contain chart values
    mySunburst.binding = 'value';

    // Data item name
    mySunburst.bindingName = ['name', 'name', 'symbol'];

    // Names of attributes that generate subitems in hierarchical data.
    mySunburst.childItemsPath = ['groups', 'items'];
    mySunburst.endUpdate();

};

DataLoader.generateCollectionView(setSunburst);
Operation results:

Figure 4. Periodic table of elements represented by sunrise chart
4. Source code download
Source code for a simple example of a sunrise chart:
The sunrise chart represents the code of the periodic table of elements: