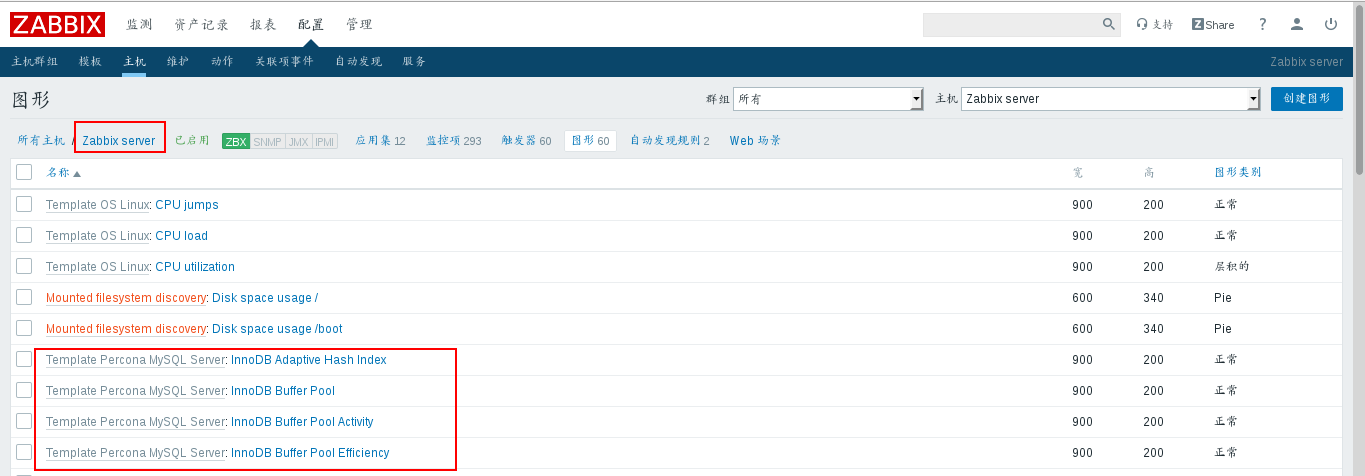
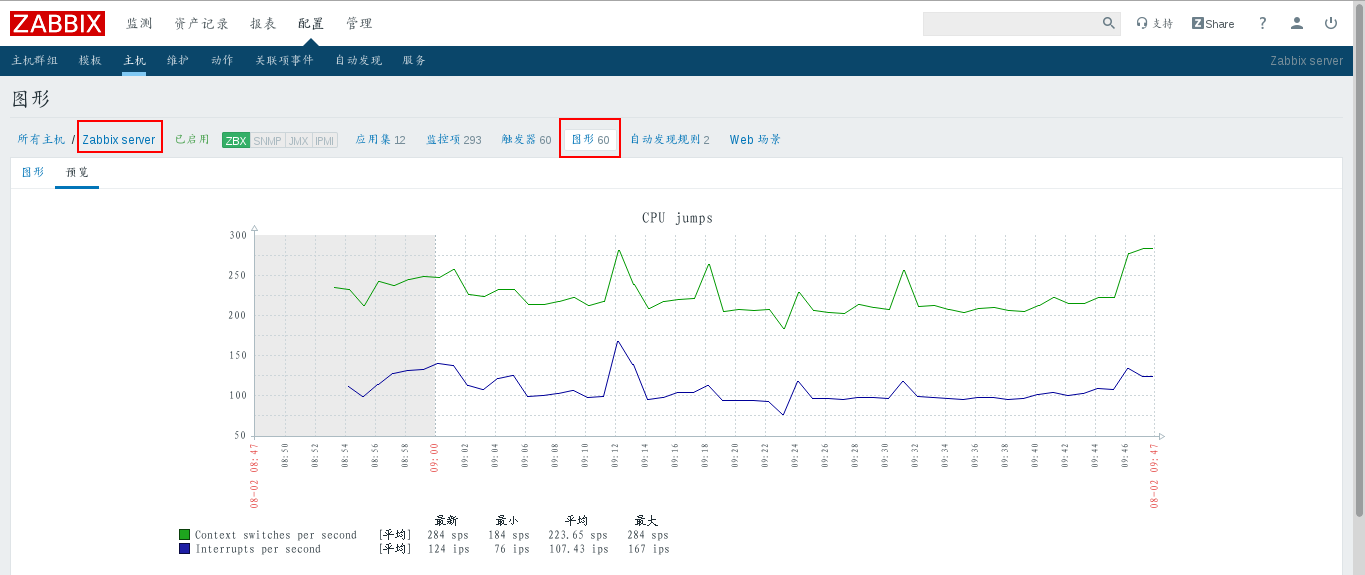
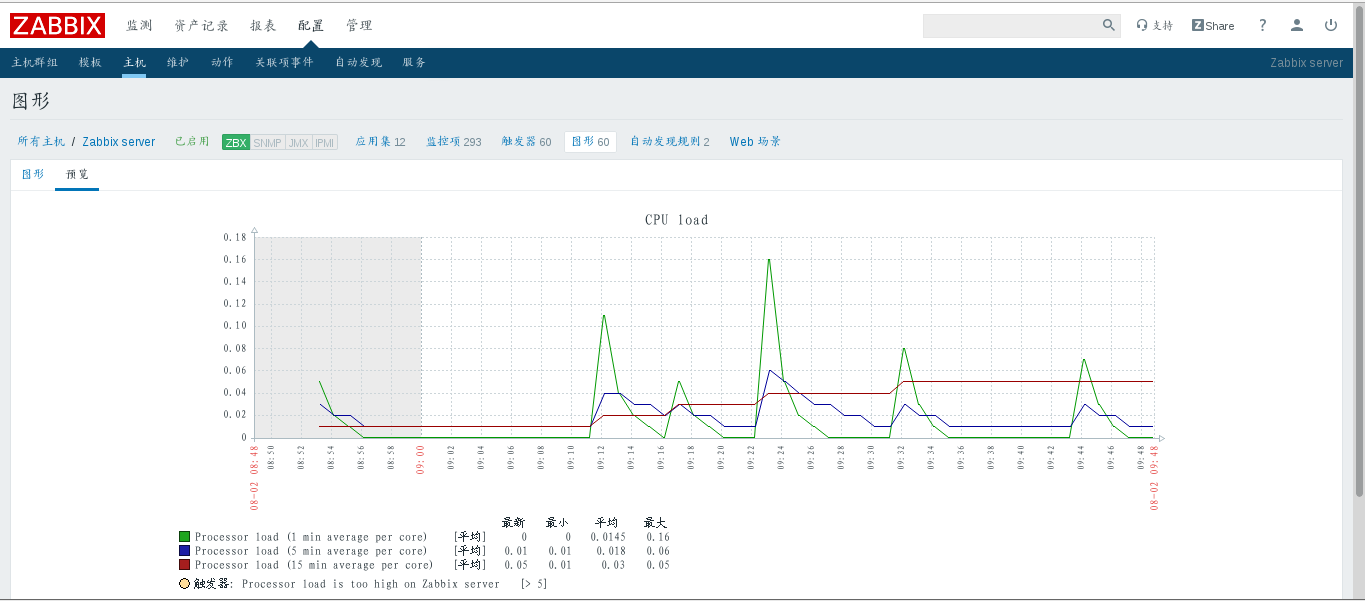
1. Add mysql monitoring items to zabbix-server
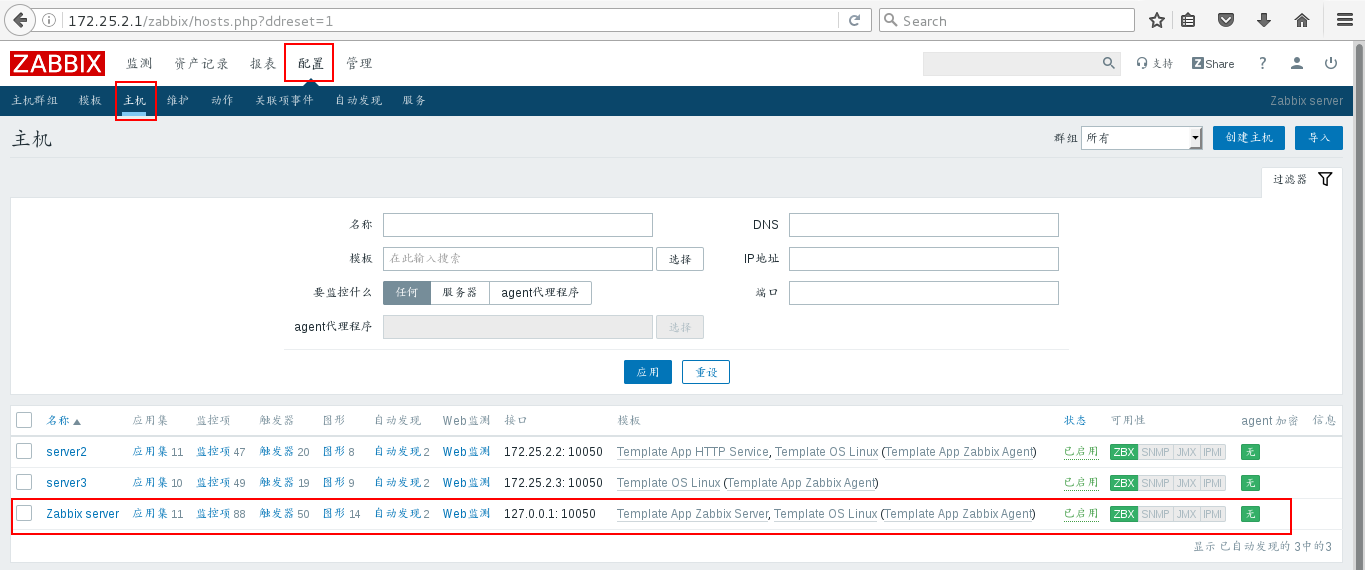

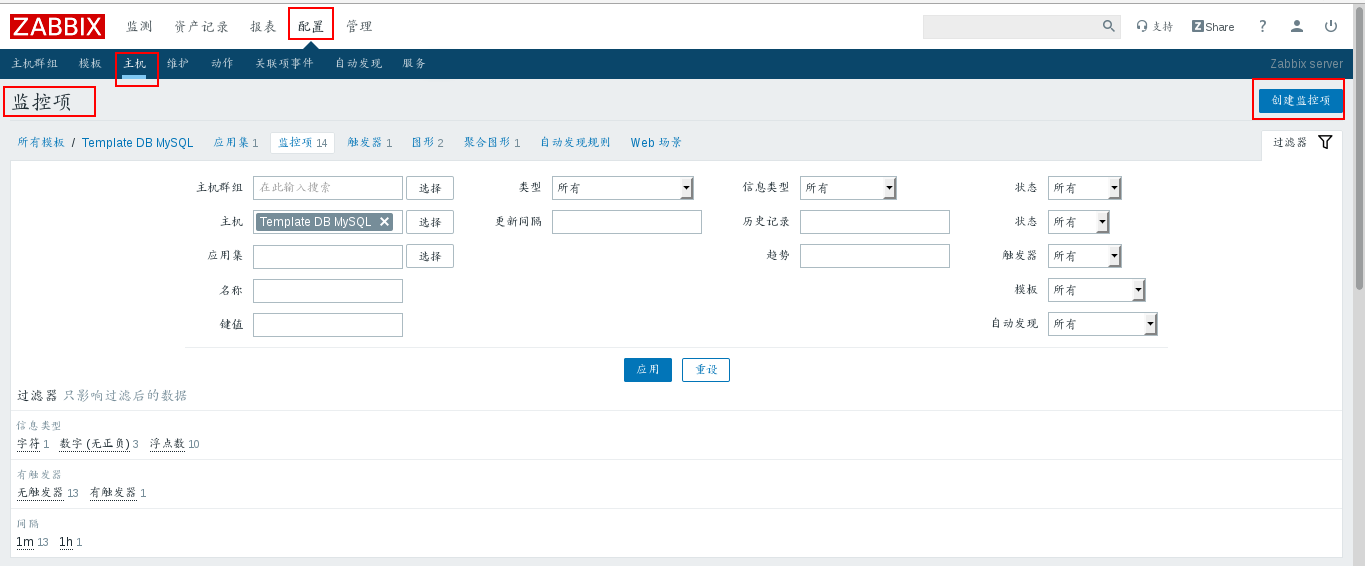
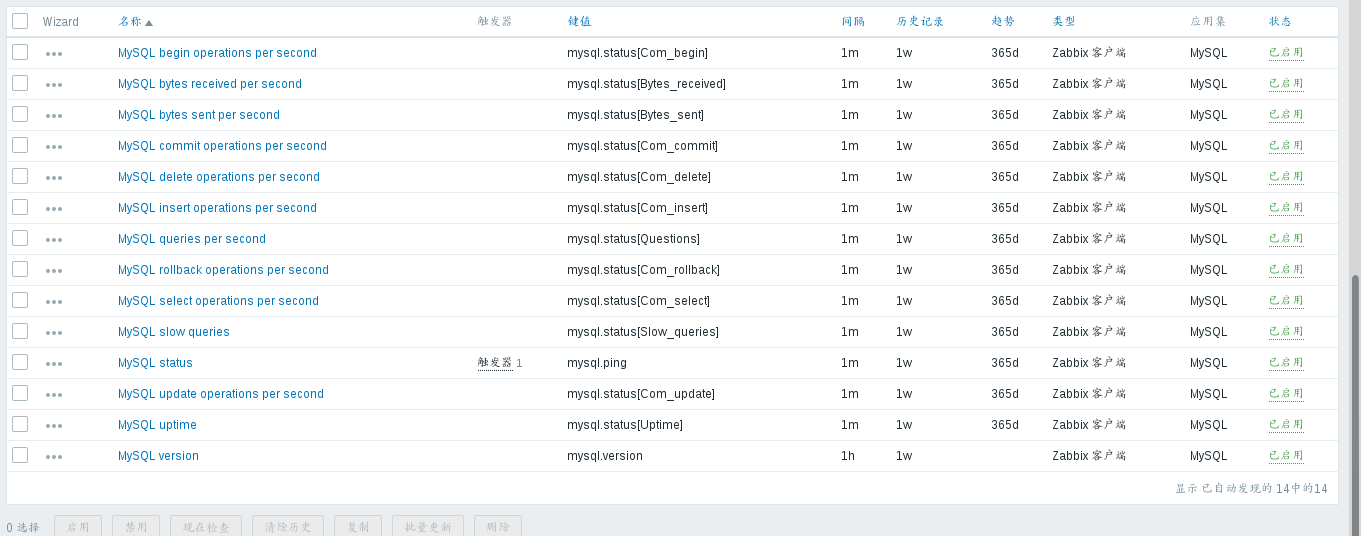

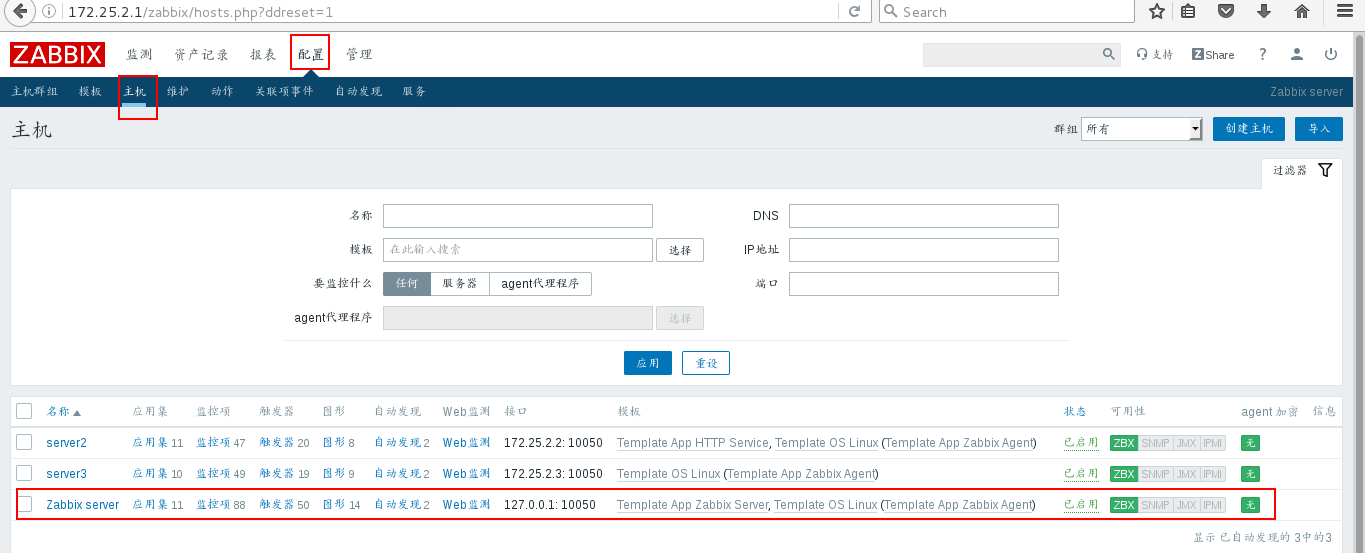
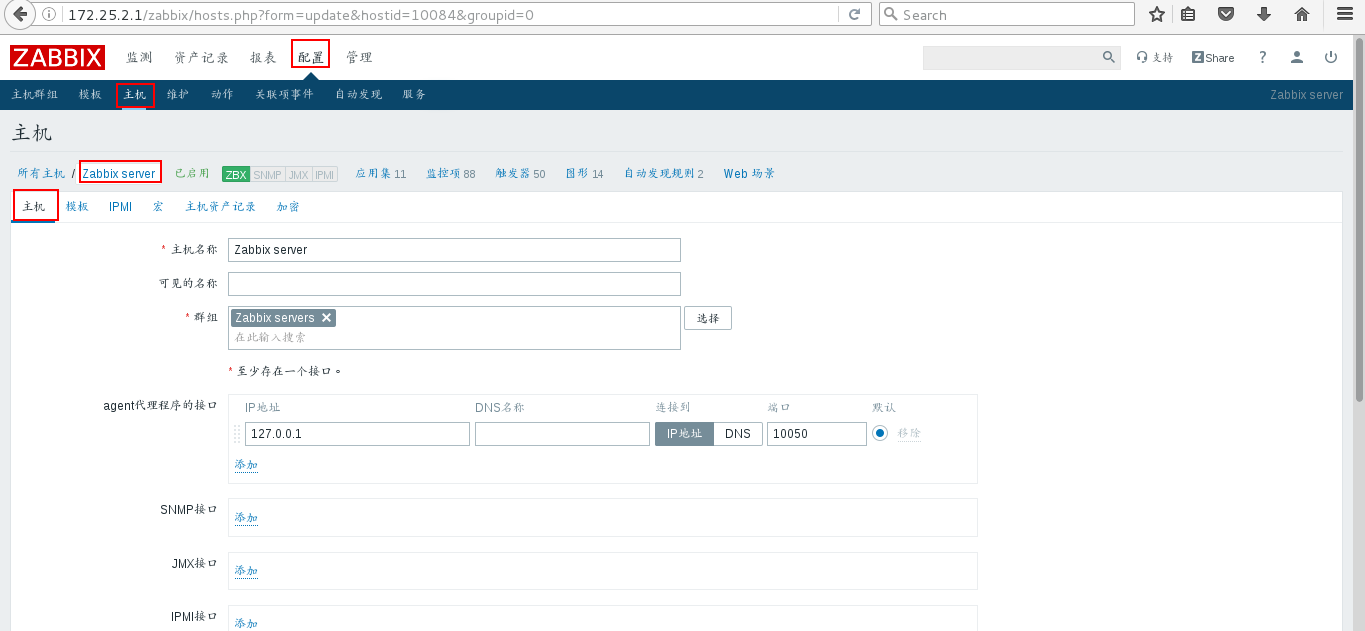
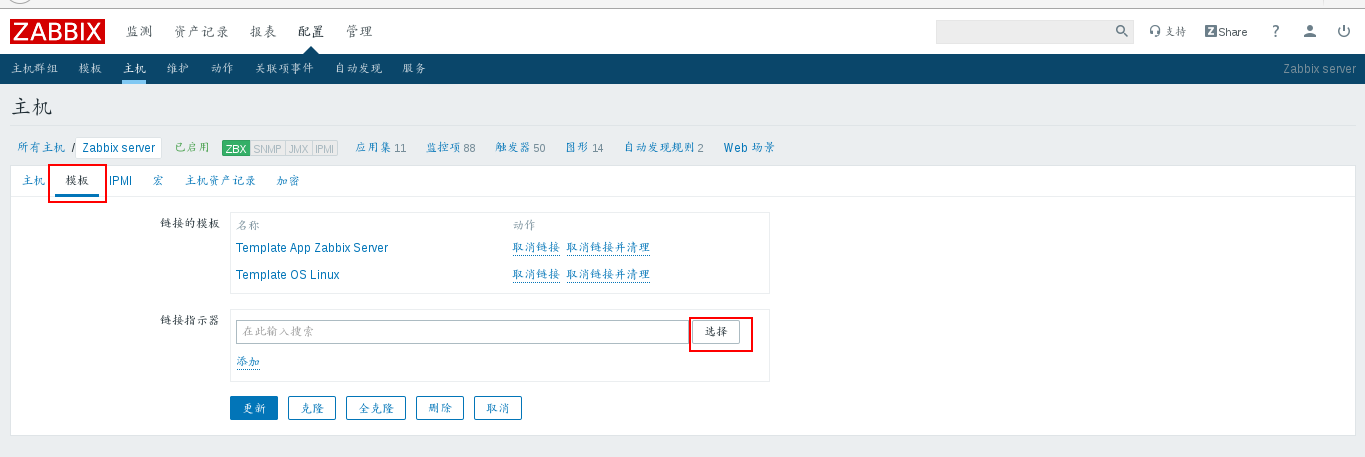
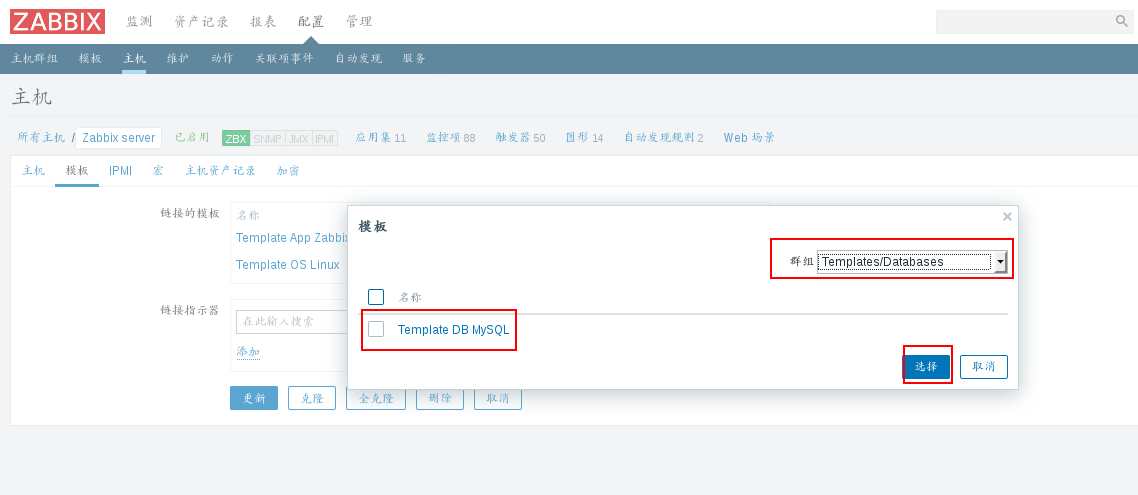
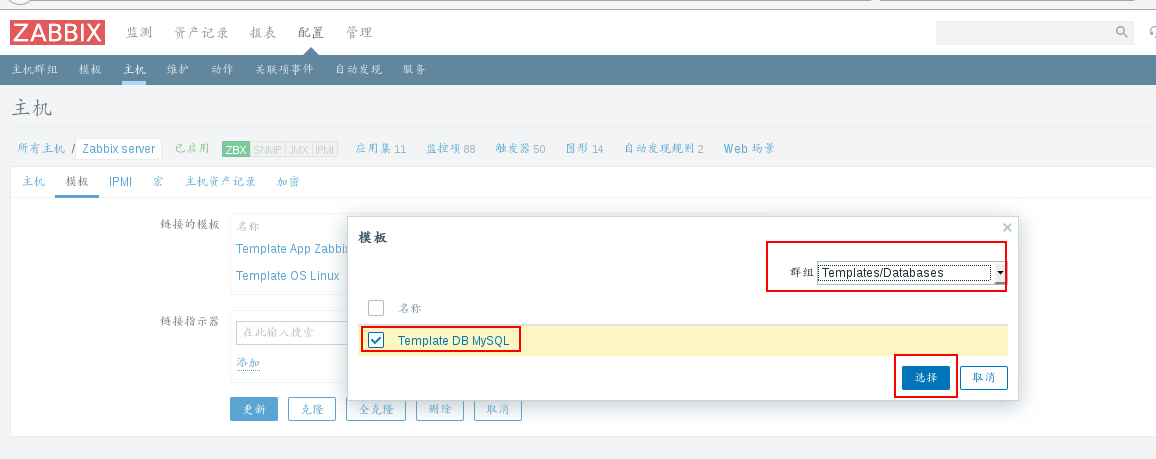
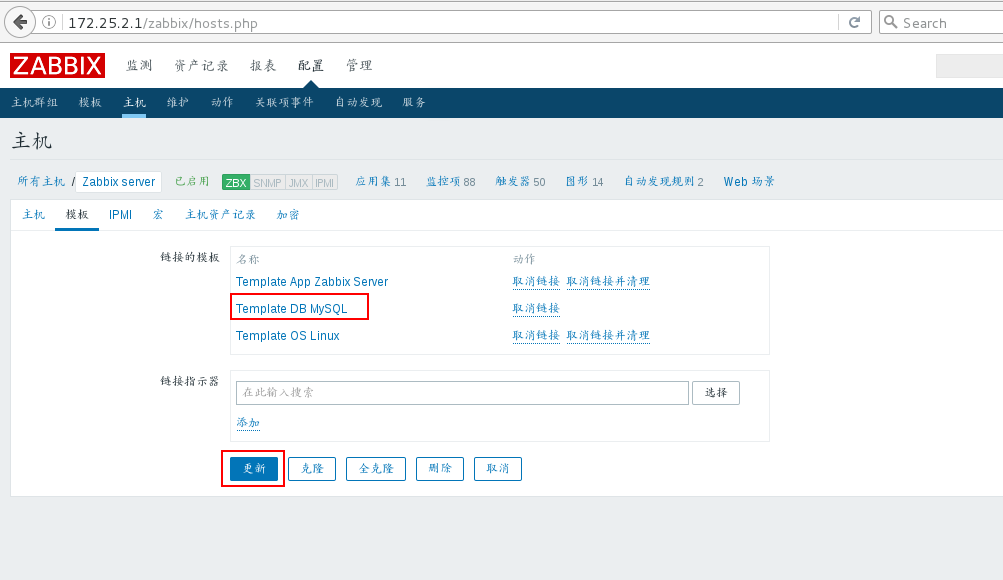
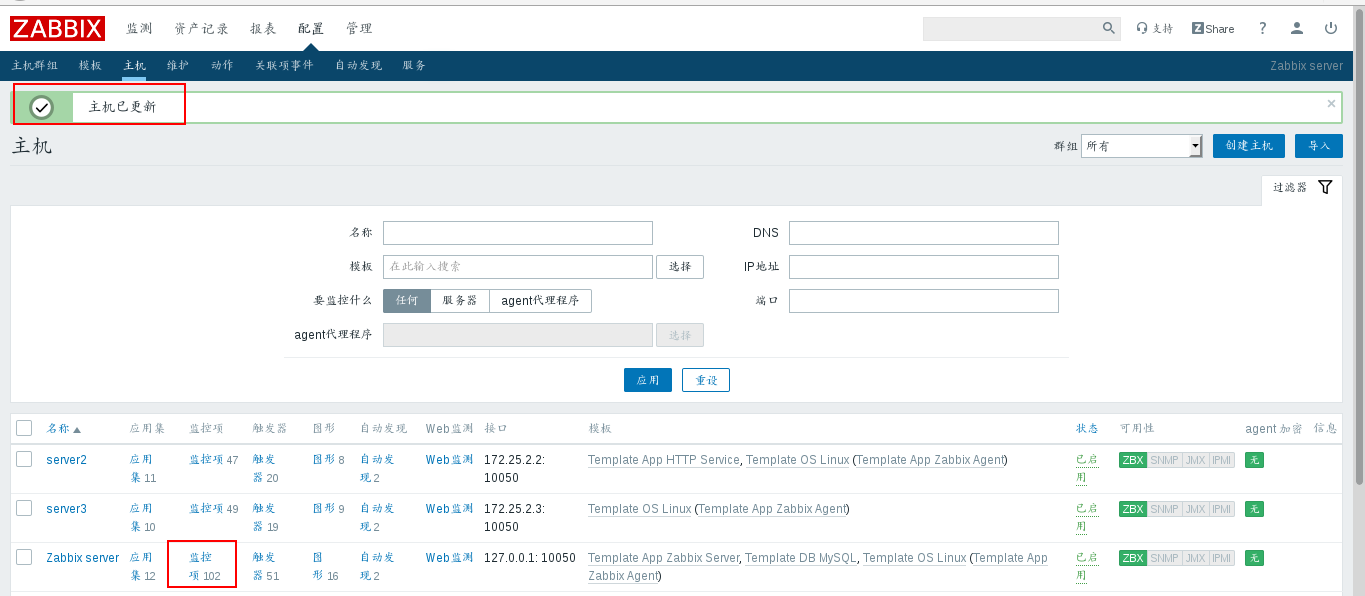
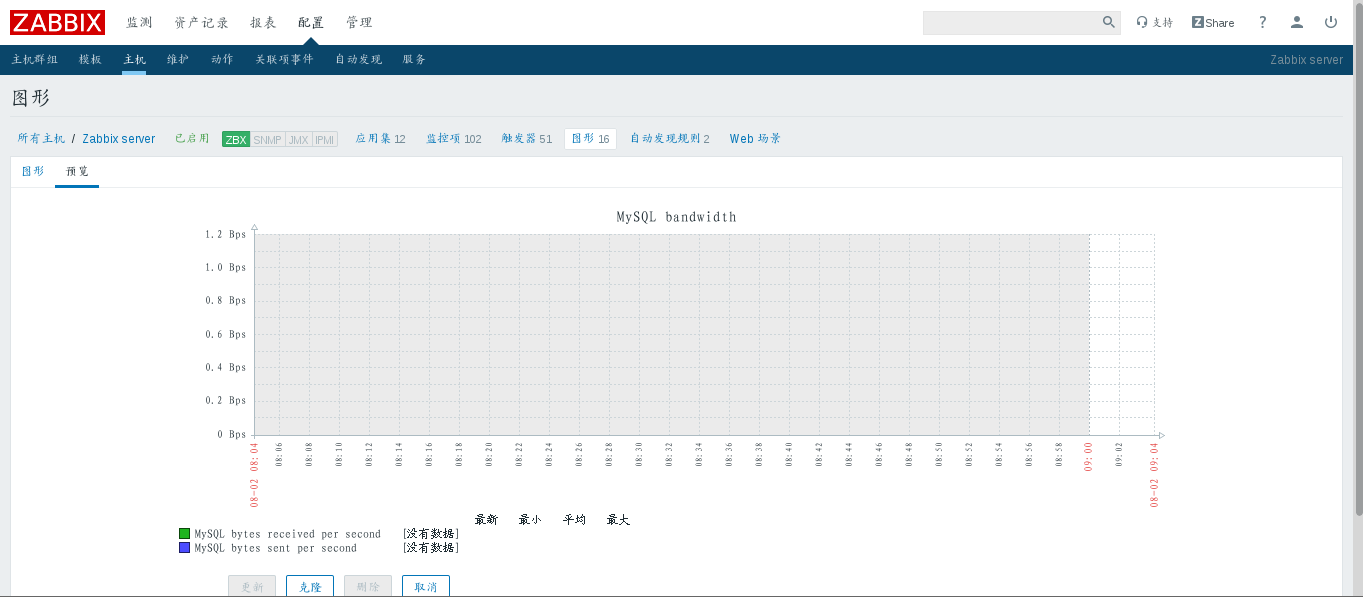
It is far from enough to find that there are few monitors and trigger graphics in the enterprise.
2. Import your own monitoring template for mysql services

Go to the agent directory and view the configuration file
[root@server1 ~]# cd /etc/zabbix/zabbix_agentd.d/
[root@server1 zabbix_agentd.d]# ls
userparameter_mysql.conf
[root@server1 zabbix_agentd.d]# cat userparameter_mysql.conf
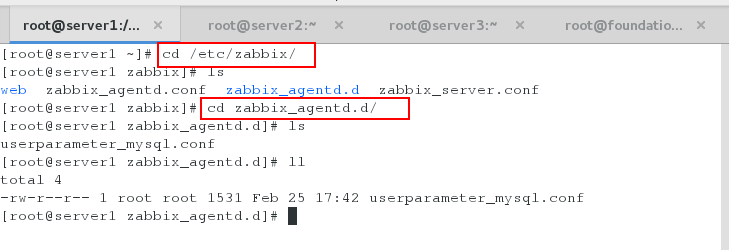

As you can see from the above file, our new configuration file contains two parts, mysql and mysqladmin.
Because the default server on this machine is localhost, you don't need to write this in either part.
[root@server1 zabbix_agentd.d]# mkdir /var/lib/zabbix    #The above directory is not available. We need to create it manually.
[root@server1 zabbix_agentd.d]# cd /var/lib/zabbix/
[root@server1 zabbix]# ll /etc/my.cnf
-rw-r--r--. 1 root root 570 Sep 21  2016 /etc/my.cnf
[root@server1 zabbix]# vim .my.cnf       #To ensure the security of the database configuration, we set the file as a hidden file.
[mysql]
user = zabbix   #The user of zabbix_server seen by ps ax is zabbix, so no root is needed. It's too big.
password = westos
socket = /var/lib/mysql/mysql.sock
[mysqladmin]
user = zabbix
password = westos
socket = /var/lib/mysql/mysql.sock
[root@server1 zabbix]# systemctl restart zabbix-agent


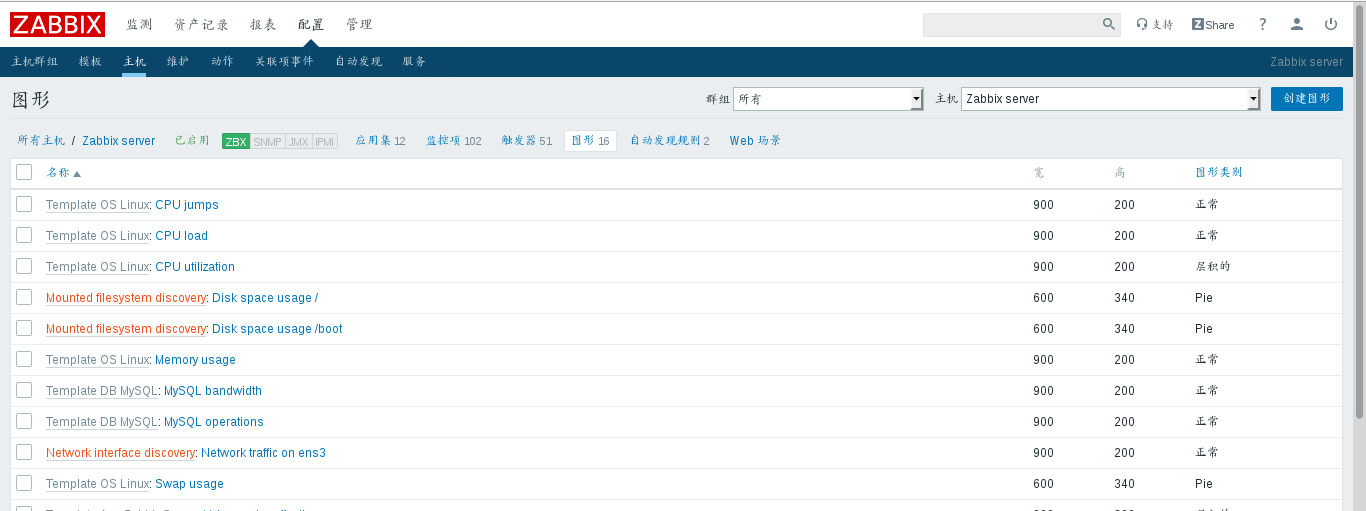
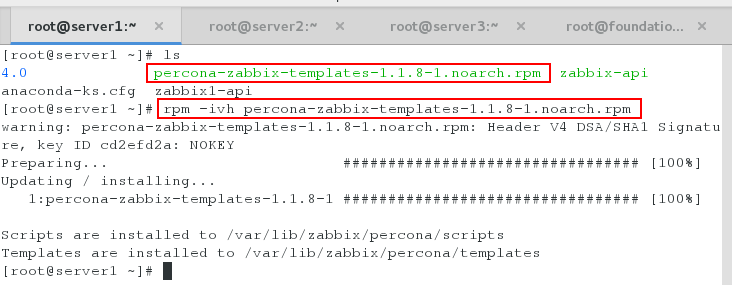
Get templates, percona is an open source mysql analysis tool, install
[root@server1 ~]# ls
4.0  percona-zabbix-templates-1.1.8-1.noarch.rpm  zabbix-api
[root@server1 ~]# rpm -ivh percona-zabbix-templates-1.1.8-1.noarch.rpm
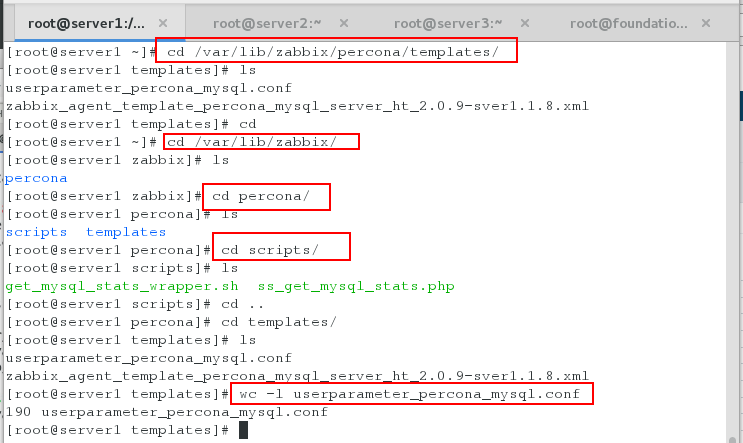
Copy the monitoring template of percona to the corresponding directory of zabbix-agent on server1
[root@server1 scripts]# cd /var/lib/zabbix/percona/scripts    #Script
[root@server1 scripts]# ls
get_mysql_stats_wrapper.sh  ss_get_mysql_stats.php
[root@server1 scripts]# cd /var/lib/zabbix/percona/templates    #Template
[root@server1 templates]# ls
userparameter_percona_mysql.conf  zabbix_agent_template_percona_mysql_server_ht_2.0.9-sver1.1.8.xml
[root@server1 templates]# wc -l userparameter_percona_mysql.conf      #The total number of monitored items is 190
190 userparameter_percona_mysql.conf
[root@server1 templates]# cp userparameter_percona_mysql.conf /etc/zabbix/zabbix_agentd.d/
[root@server1 templates]# systemctl restart zabbix-agent

percona's script is written by php to prepare the running environment of php and write zabbix's database and password into the php script
(You can also modify the file ss_get_mysql_stats.php)
[root@server1 templates]# cd -
/var/lib/zabbix/percona/scripts
[root@server1 scripts]# ls
get_mysql_stats_wrapper.sh  ss_get_mysql_stats.php
[root@server1 scripts]# vim ss_get_mysql_stats.php.cnf
<?php
$mysql_user = 'root';
$mysql_pass = 'westos';


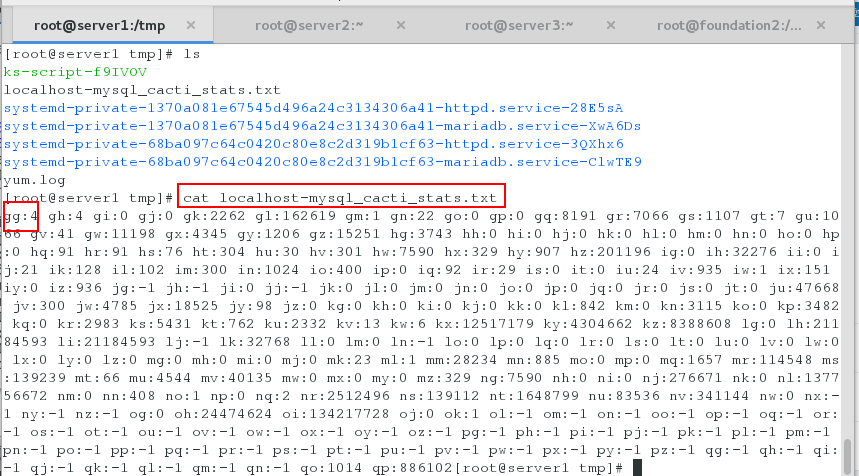
Testing percona's monitoring script and filtering monitoring items
[root@server1 scripts]# /var/lib/zabbix/percona/scripts/get_mysql_stats_wrapper.sh gg    #Read the corresponding value of gg in the / tmp/localhost-mysql_cacti_stats.txt file.
[root@server1 scripts]# /var/lib/zabbix/percona/scripts/get_mysql_stats_wrapper.sh gq
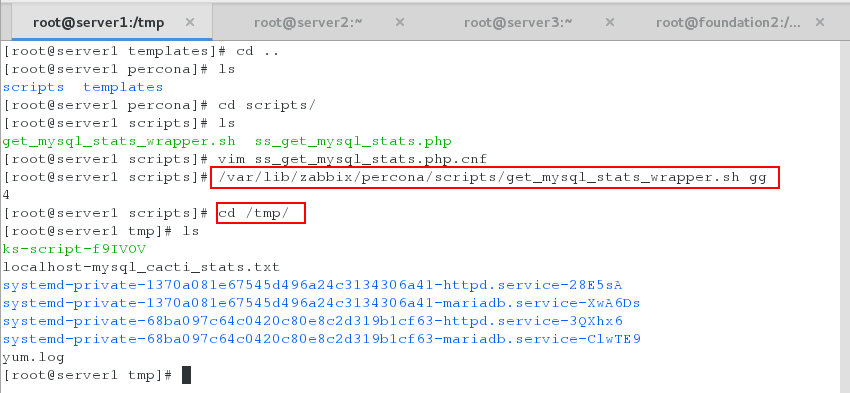
View monitoring items
[root@server1 scripts]# cd /tmp/
[root@server1 tmp]# ls
localhost-mysql_cacti_stats.txt
[root@server1 tmp]# cat localhost-mysql_cacti_stats.txt
[root@server1 tmp]# cd /etc/zabbix/zabbix_agentd.d/
[root@server1 zabbix_agentd.d]# ls
userparameter_mysql.conf userparameter_percona_mysql.conf
[root@server1 zabbix_agentd.d]# vim userparameter_percona_mysql.conf


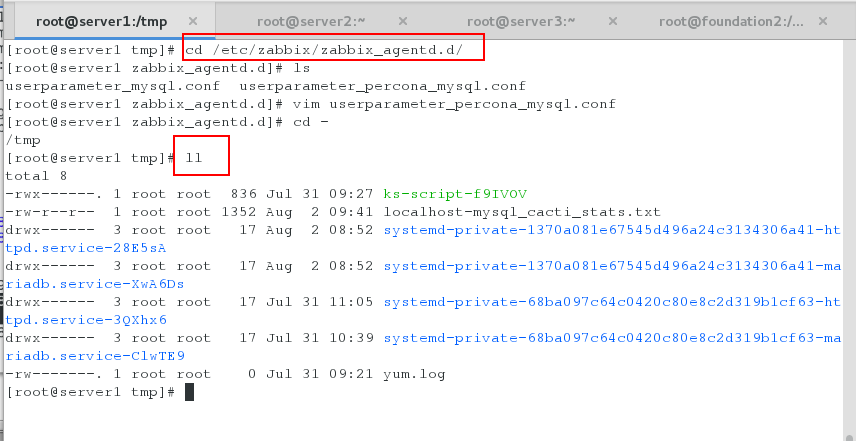
Delete the monitor file and let the system generate automatically
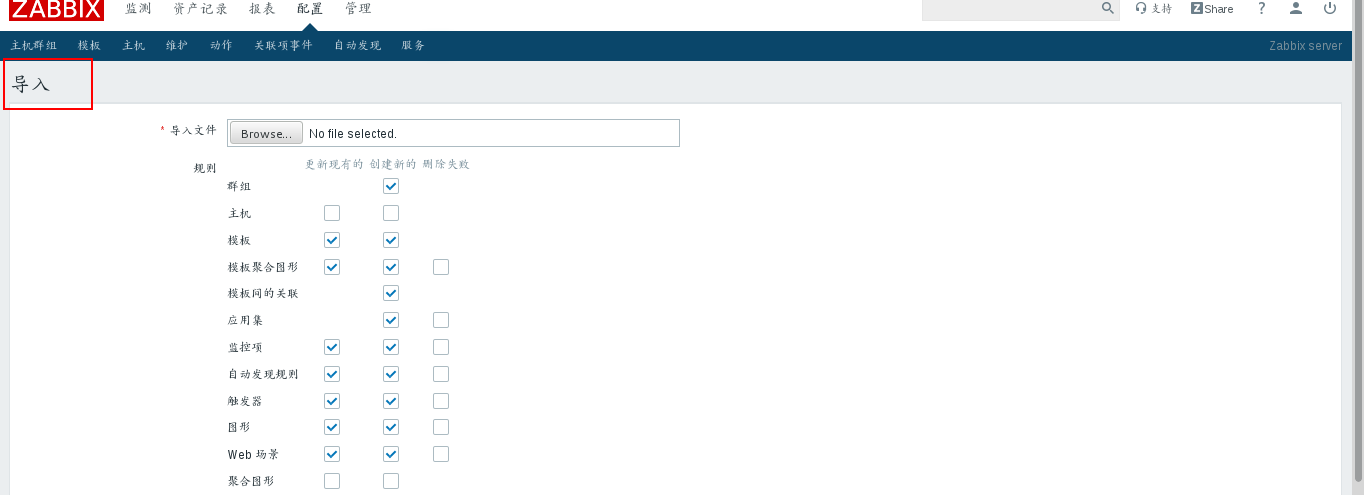
Import the template percona for monitoring mysql into the web Interface monitored by zabbix
Select Import
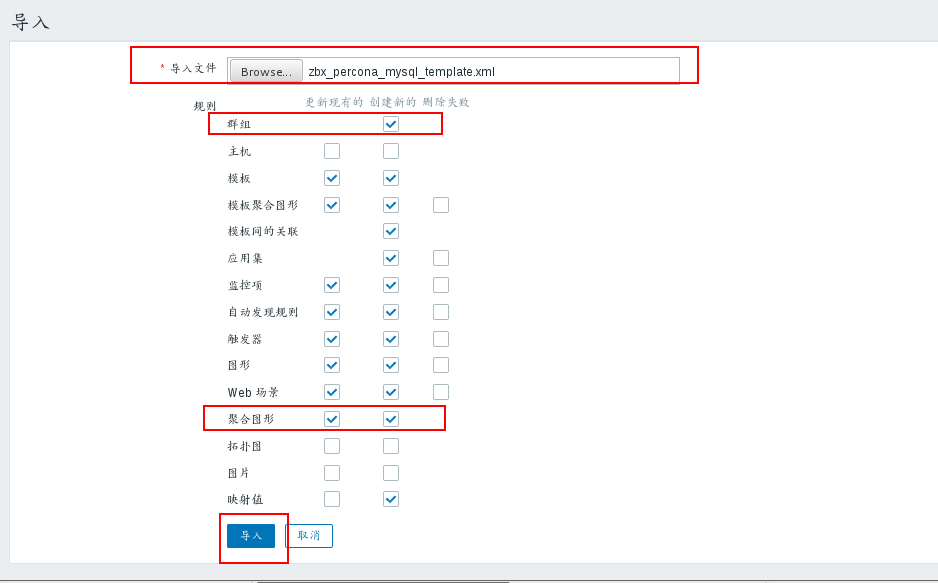
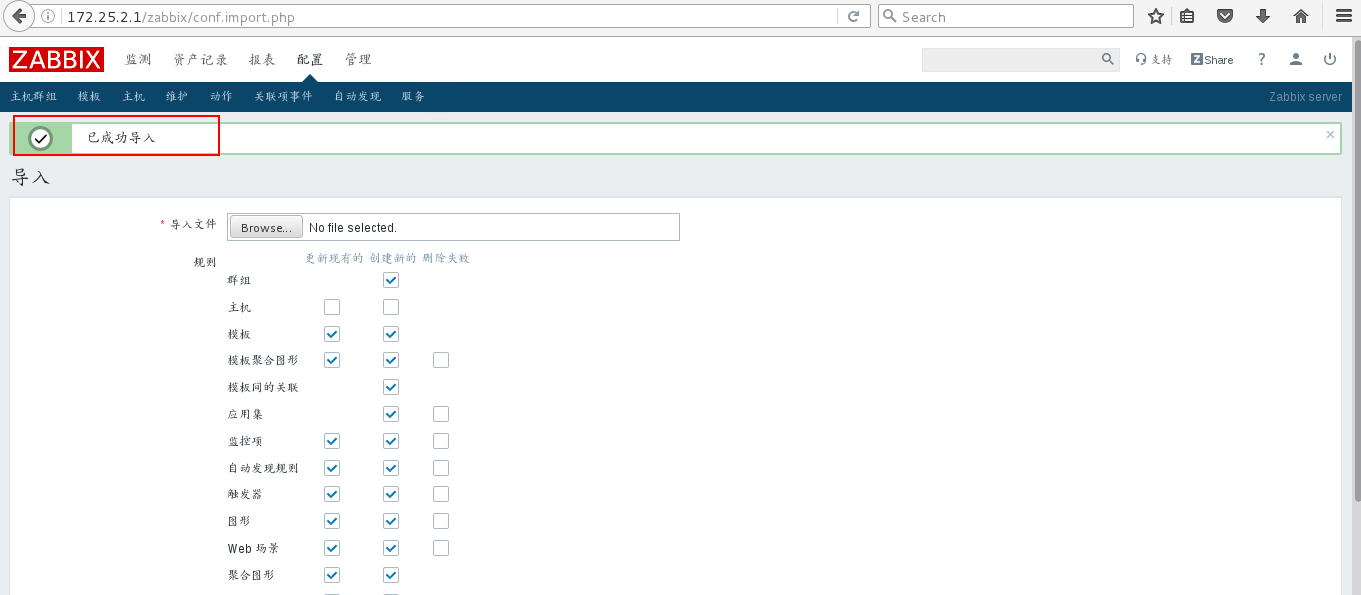

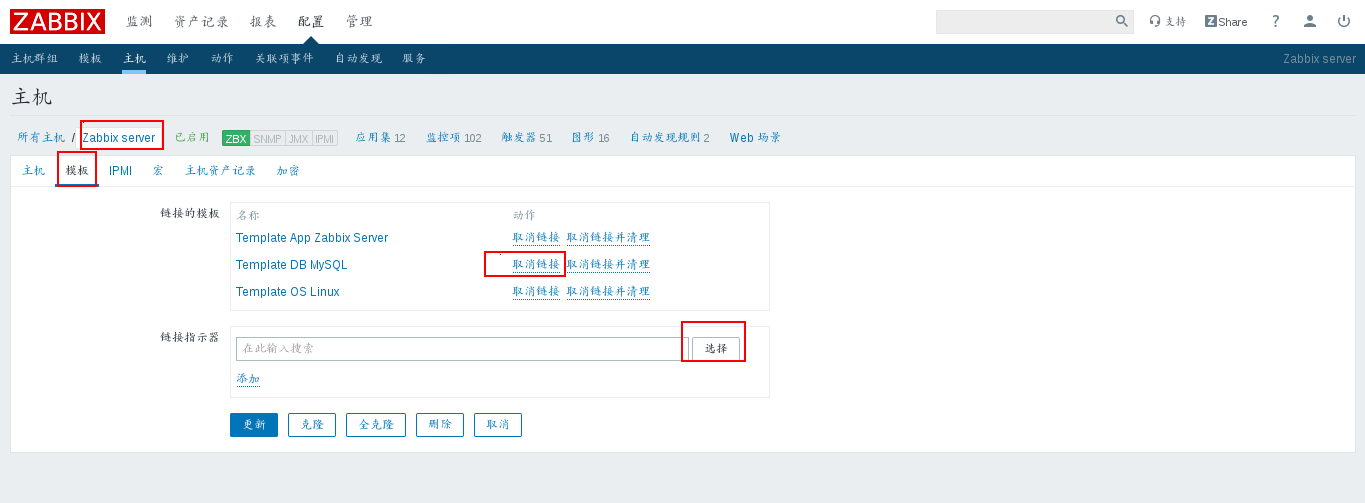
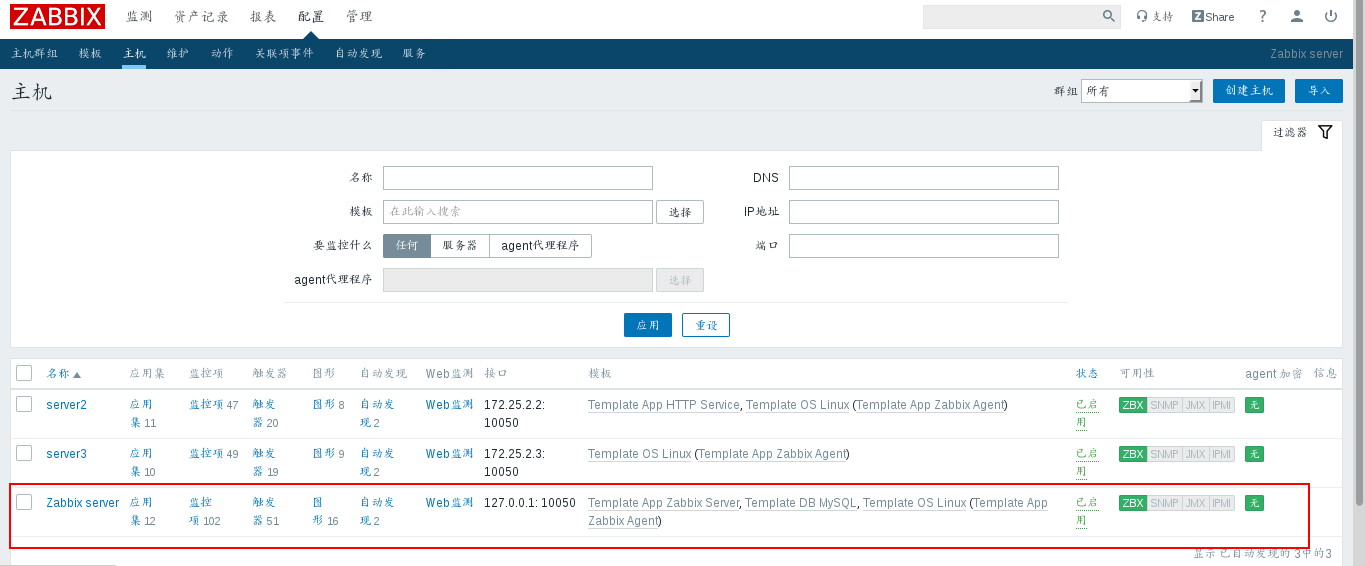 The mysql template that comes with the system that deletes previous links
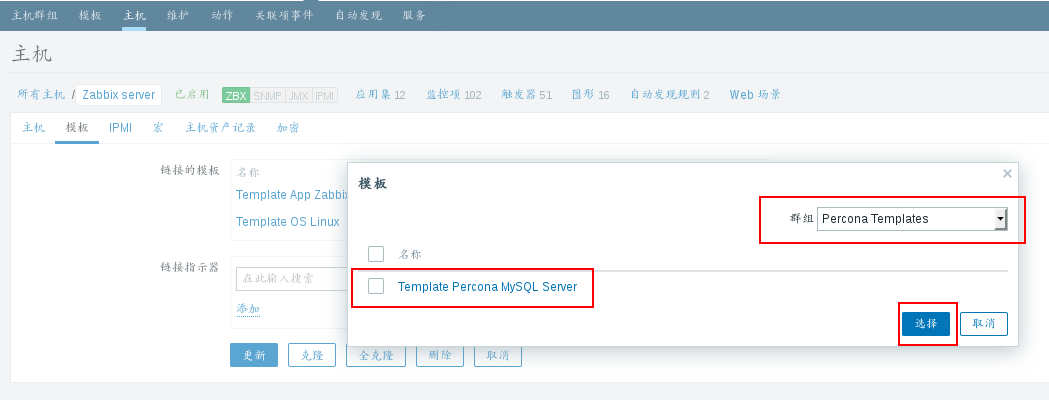
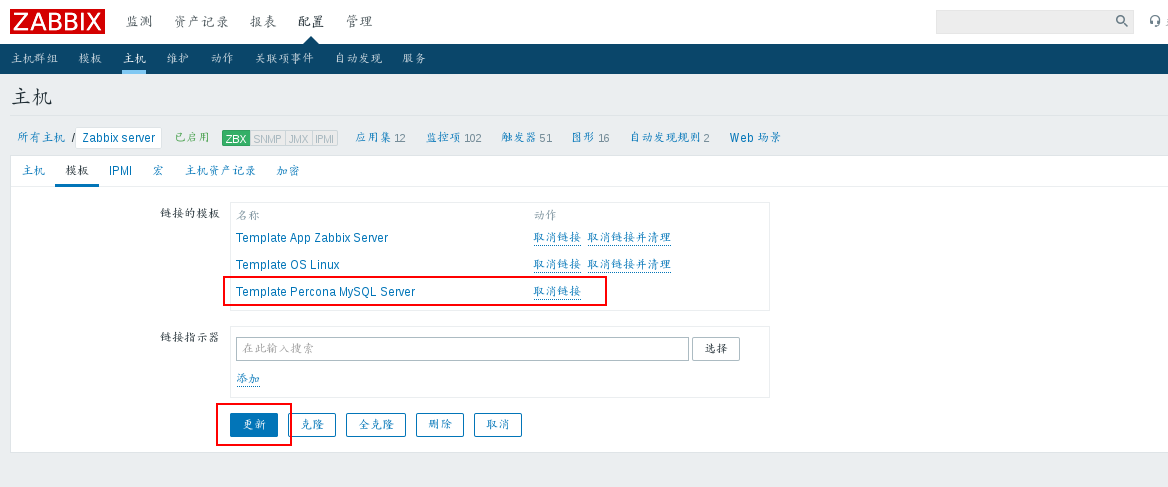
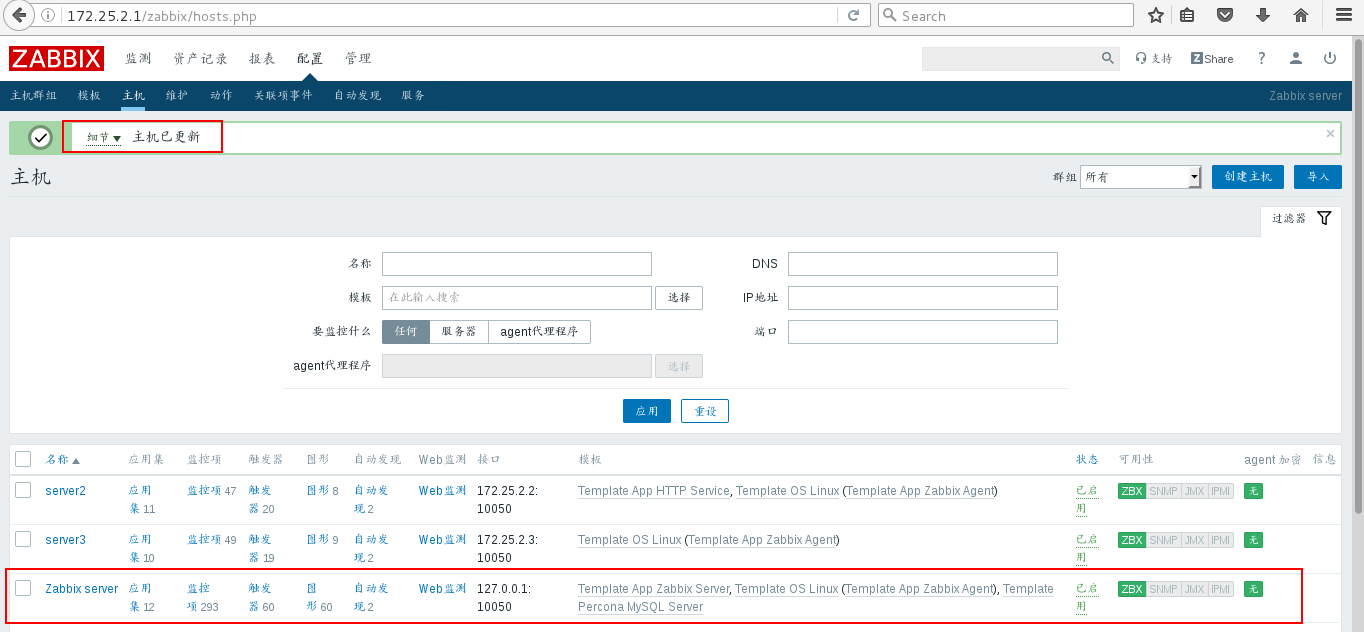
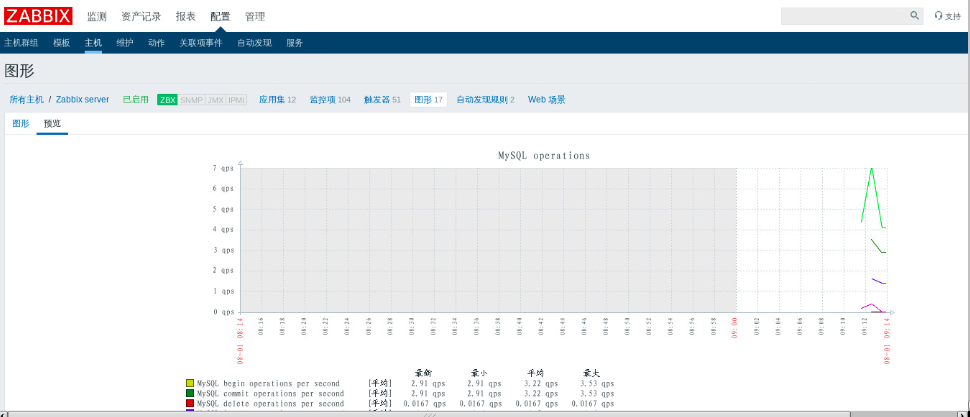
Update completed, check the monitoring items of zabbix server, you can see that the number of monitoring items changed to 297 after importing percona template, the number of monitoring items, graphics and triggers increased greatly.
More conducive to our overall monitoring of the database in the production environment