Suggested Design of Data Visualization - Random Walk:
The design is to display a certain number of random points in windows that are suitable for screen size (coordinate axes are hidden), in which the number of walking points can be determined by setting the initial amount. After a walk, the next walk can be done by inputting the value of y, or the program can be terminated by inputting n.
Create a class:
from random import choice
class RandomWalk(): #Generate a random walk class
def __init__(self,num_points=50000):
#Initialization
self.num_points=num_points
#Set the initial point to (0,0)
self.x_values=[0]
self.y_values=[0]
'''Here we first create a class with three attributes: number of strolls (number of points), list 1, and
//Listing 2. The latter two are used to store the coordinates of each point separately. ''
def fill_walk(self):
while (len(self.x_values)<self.num_points): #Number of points that generate the specified list length
#Determine the direction of progress and the displacement in this direction
x_direction=choice([1,-1])
x_distance=choice([0,1,2,3,4])
x_step=x_direction * x_distance
y_direction=choice([1,-1])
y_distance=choice([0,1,2,3,4])
y_step=y_direction * y_distance
#Remove the case where the displacement is zero
if x_step==0 and y_step==0:
continue
#Calculate the location of the next point
next_x=self.x_values[-1]+x_step
next_y=self.y_values[-1]+y_step
self.x_values.append(next_x)
self.y_values.append(next_y)
'''We also need to create a function to generate walking points.,And determine the direction.'''
//Set the walkthrough function:
import matplotlib.pyplot as plt
from random_walk import RandomWalk
while 1:
rw=RandomWalk() #Create an instance of RandomWalk and draw its points
rw.fill_walk()
plt.figure(figsize=(10,6)) #Setting the Size of Drawing Window
point_numbers=list(range(rw.num_points))
plt.scatter(rw.x_values,rw.y_values,c=point_numbers,cmap=plt.cm.Blues,
edgecolor='none',s=10) #Delete the black outline of the dots in order to make the coloring more obvious.
'''Let's use it first. range Generate a list of numbers containing the same number of numbers as the number of points.
//This list is then stored in point_numbers for use in setting the color'''of each point.
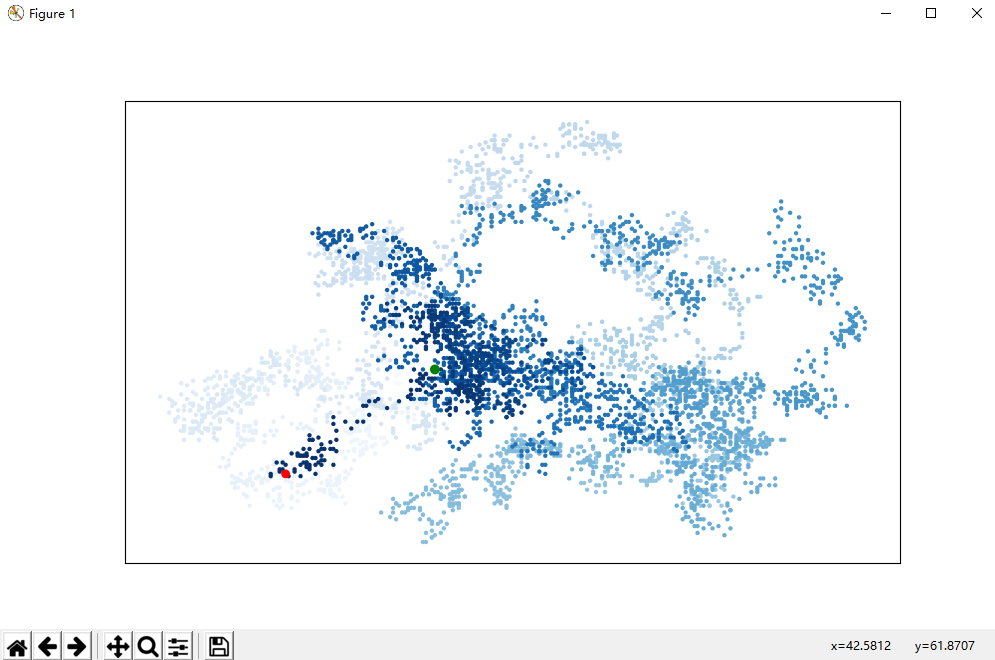
plt.scatter(0,0,c='green',edgecolors='none',s=50)
plt.scatter(rw.x_values[-1],rw.y_values[-1],c='red',edgecolors='none',s=40)
'''We highlighted the starting point with green.(0,0),To make it bigger, we also set the destination red.'''
plt.axes().get_xaxis().set_visible(False)#Hidden coordinate axis
plt.axes().get_yaxis().set_visible(False)
plt.show()
'''First import pyplot And RandomWalk Class, then create an instance and store it in rw In, call again
fill_walk()take x,y Incoming value scatter()'''
keep_running=input('Another walk?(y/n):')
if keep_running=='n':
break
'''input y The number of strolls can be achieved by inputting n Then the program can be terminated.'''
This is a screenshot of my own effect implementation: