1. Establishment of Principal-Subordinate Relations
Configure mysql-master side:
1) Modify the configuration file of mysql-master
[root@localhost ~]# vim /etc/my.cnf
[mysqld]
server_id=1
innodb_file_per_table
datadir=/data/mysql
socket=/var/lib/mysql/mysql.sock
log-bin=/data/log-bin/bin
binlog_format=row
......
2) Start the mysql service and authorize the slave user
[root@localhost ~]# systemctl start mariadb
[root@localhost ~]# systemctl enable mariadb
3) View the current binary log location
MariaDB [(none)]> show master logs;
+------------+-----------+
| Log_name   | File_size |
+------------+-----------+
| bin.000001 |      307 |
4) Grant slave user privileges
MariaDB [(none)]> grant REPLICATION CLIENT on *.* to slave@'192.168.1.16' identified by 'slave';
5) Refresh permissions
MariaDB [(none)]> flush privileges;
Configure mysql-slave end:
1) Modify the database configuration file from the service mysql-slave
[root@192 ~]# vim /etc/my.cnf
[mysqld]
server_id=2
read_only
innodb_file_per_table
datadir=/data/mysql
socket=/var/lib/mysql/mysql.sock
2) Log in to the database and set up group-slave connections
MariaDB [(none)]> change master to
master_host='192.168.1.15',
master_user='slave',
master_password='slave',
master_log_file='bin.000001',
master_log_pos=307;
3) Start master-slave connections
MariaDB [(none)]> start slave;
4) Check whether the master-slave connection is successful
ariaDB [(none)]> show slave status\G;
*************************** 1. row ***************************
                             Slave_IO_State: Waiting for master to send event
                                    Master_Host: 192.168.1.15
                                    Master_User: slave
                                    Master_Port: 3306
                                Connect_Retry: 60
                            Master_Log_File: bin.000003
                    Read_Master_Log_Pos: 321
                             Relay_Log_File: mariadb-relay-bin.000018
                                Relay_Log_Pos: 531
                Relay_Master_Log_File: bin.000003
                         Slave_IO_Running: Yes     #Two io processes start, master-slave connections start
                        Slave_SQL_Running: Yes
                            Replicate_Do_DB:
                    Replicate_Ignore_DB:
                     Replicate_Do_Table:
             Replicate_Ignore_Table:
            Replicate_Wild_Do_Table:
    Replicate_Wild_Ignore_Table:
                                     Last_Errno: 0
                                     Last_Error:
                                 Skip_Counter: 0
                    Exec_Master_Log_Pos: 321
                            Relay_Log_Space: 1113
                            Until_Condition: None
                             Until_Log_File:
                                Until_Log_Pos: 0
                     Master_SSL_Allowed: No
                     Master_SSL_CA_File:
                     Master_SSL_CA_Path:
                            Master_SSL_Cert:
                        Master_SSL_Cipher:
                             Master_SSL_Key:
                Seconds_Behind_Master: 0   #Master-slave synchronization data delay
Master_SSL_Verify_Server_Cert: No
                                Last_IO_Errno: 0
                                Last_IO_Error:
                             Last_SQL_Errno: 0
                             Last_SQL_Error:
    Replicate_Ignore_Server_Ids:
                         Master_Server_Id: 1
                             Master_SSL_Crl:
                     Master_SSL_Crlpath:
                                     Using_Gtid: No
                                    Gtid_IO_Pos:
            Replicate_Do_Domain_Ids:
    Replicate_Ignore_Domain_Ids:
                                Parallel_Mode: conservative
2. Configure zabbix-agent proxy client from mysql-slave server (centos 7.6)
1) Install zabbix-agent client
root@localhost percona-zabbix-tools]# yum install zabbix-agent -y
2) Modify the agent configuration file to
[root@localhost ~]# vim /etc/zabbix/zabbix_agentd.conf
EnableRemoteCommands=1 #Allow remote commands
Server=192.168.1.14,192.168.1.20  #The ip of both the monitoring server and proxy proxy proxy proxy server must be specified, otherwise the monitoring or proxy proxy proxy proxy proxy can't zabbix_get key value.
ServerActive=192.168.1.20 #Agent Address in Active Mode
Hostname=192.168.1.16 #Change the host name to the ip address of the machine for convenience of distinguishing between hosts
Include=/etc/zabbix/zabbix_agentd.d/*.conf #Subdirectories included
UnsafeUserParameters=1 #Allow all characters in parameters to be passed to user-defined parameters
3) Download percona-zabbix monitoring mysql database package
https://Www.percona.com/downloads/percona-monitoring-plugins/LATEST/#percona-zabbix official address
[root@localhost percona-zabbix-tools]# wget https://www.percona.com/downloads/percona-monitoring-plugins/percona-monitoring-plugins-1.1.8/binary/redhat/7/x86_64/percona-zabbix-templates-1.1.8-1.noarch.rpm
4) View the list generated by the installed percona-zabbix-templates
[root@localhost percona-zabbix-tools]# rpm -ql percona-zabbix-templates
/var/lib/zabbix/percona
/var/lib/zabbix/percona/scripts
/var/lib/zabbix/percona/scripts/get_mysql_stats_wrapper.sh
/var/lib/zabbix/percona/scripts/ss_get_mysql_stats.php
/var/lib/zabbix/percona/templates
/var/lib/zabbix/percona/templates/userparameter_percona_mysql.conf
/var/lib/zabbix/percona/templates/zabbix_agent_template_percona_mysql_server_ht_2.0.9-sver1.1.8.xml
5) Copy percona configuration file to / etc/zabbix/zabbix_agent d.d/directory
[root@localhost ~]#cp /var/lib/zabbix/percona/templates/userparameter_percona_mysql.conf /etc/zabbix/zabbix_agentd.d/
6) All that is saved in the percona configuration file is the key to obtain mysql database monitoring items
[root@localhost ~]# cat /etc/zabbix/zabbix_agentd.d/userparameter_percona_mysql.conf
UserParameter=MySQL.Com-select,/var/lib/zabbix/percona/scripts/get_mysql_stats_wrapper.sh jx
UserParameter=MySQL.Qcache-total-blocks,/var/lib/zabbix/percona/scripts/get_mysql_stats_wrapper.sh js
UserParameter=MySQL.Handler-read-prev,/var/lib/zabbix/percona/scripts/get_mysql_stats_wrapper.sh mt
UserParameter=MySQL.Sort-rows,/var/lib/zabbix/percona/scripts/get_mysql_stats_wrapper.sh ks
UserParameter=MySQL.Qcache-free-memory,/var/lib/zabbix/percona/scripts/get_mysql_stats_wrapper.sh jm
UserParameter=MySQL.pages-read,/var/lib/zabbix/percona/scripts/get_mysql_stats_wrapper.sh gu
.....
UserParameter=MySQL.Key-read-requests,/var/lib/zabbix/percona/scripts/get_mysql_stats_wrapper.sh gg
7) View the configuration file in / etc/zabbix/zabbix_agent d.d/directory
[root@localhost ~]# ls /etc/zabbix/zabbix_agentd.d/
userparameter_mysql.conf  userparameter_percona_mysql.conf
8) Delete the userparameter_mysql.conf configuration file to avoid configuration conflicts
[root@localhost ~]# rm /etc/zabbix/zabbix_agentd.d/userparameter_mysql.conf
9) Configure the php environment
[root@localhost ~]#yum install php php-mysql -y
10) php connection local database configuration
[root@localhost ~]# vim /var/lib/zabbix/percona/scripts/ss_get_mysql_stats.php.cnf
<?php
$mysql_user = 'root';
$mysql_pass = '';  #Empty without password
11) Start zabbix-agent service
[root@localhost ~]# systemctl restart zabbix-agent
12) Test the connection with the local database. If you can't get the number, it means that the database password that was not installed in the PHP environment or configured in the previous step is incorrect.
[root@localhost ~]# /var/lib/zabbix/percona/scripts/get_mysql_stats_wrapper.sh gg
4
13) When the previous test passes, the localhost-mysql_cacti_stats.txt file is automatically generated, which records the data information of the current running status of mysql.
[[root@localhost ~]# cat /tmp/localhost-mysql_cacti_stats.txt
gg:4 gh:2 gi:2 gj:2 gk:5 gl:2832 gm:0 gn:3 go:0 gp:0 gq:8191 gr:8028 gs:163 gt:0 gu:157 gv:6 gw:27 gx:24 gy:175 gz:43 hg:18 hh:0 hi:0 hj:0 hk:-1 hl:0 hm:0 hn:-1 ho:0 hp:0 hq:0 hr:0 hs:0 ht:836 hu:1208 hv:11 hw:0 hx:0 hy:0 hz:0 ig:0 ih:35 ii:0 ij:29 ik:11 il:17 im:431 in:1024 io:431 ip:0 iq:0 ir:1 is:0 it:0 iu:1 iv:2 iw:1 ix:151 iy:0 iz:6 jg:0 jh:0 ji:0 jj:0 jk:0 jl:1 jm:1031336 jn:0 jo:0 jp:0 jq:0 jr:0 js:1 jt:1048576 ju:8 jv:0 jw:0 jx:1 jy:0 jz:0 kg:0 kh:0 ki:0 kj:0 kk:0 kl:0 km:0 kn:0 ko:0 kp:2 kq:0 kr:0 ks:0 kt:0 ku:2 kv:0 kw:6 kx:4886 ky:2250 kz:16777216 lg:0 lh:1632681 li:1632681 lj:1269 lk:32768 ll:0 lm:0 ln:-1 lo:0 lp:0 lq:0 lr:0 ls:0 lt:0 lu:1 lv:0 lw:0 lx:0 ly:0 lz:0 mg:0 mh:0 mi:0 mj:0 mk:0 ml:2 mm:3 mn:1 mo:0 mp:0 mq:5 mr:2 ms:0 mt:0 mu:0 mv:42 mw:0 mx:0 my:0 mz:0 ng:4 nh:0 ni:0 nj:-1 nk:-1 nl:-1 nm:-1 nn:0 no:1 np:0 nq:2 nr:2217568 ns:139112 nt:645374 nu:817696 nv:333952 nw:0 nx:-1 ny:-1 nz:-1 og:0 oh:24484864 oi:134217728 oj:0 ok:0 ol:-1 om:-1 on:-1 oo:-1 op:-1 oq:-1 or:-1 os:-1 ot:-1 ou:-1 ov:-1 ow:-1 ox:-1 oy:-1 oz:-1 pg:-1 ph:-1 pi:-1 pj:-1 pk:-1 pl:-1 pm:-1 pn:-1 po:-1 pp:-1 pq:-1 pr:-1 ps:-1 pt:-1 pu:-1 pv:-1 pw:-1 px:-1 py:0 pz:-1 qg:-1 qh:0 qi:-1 qj:-1 qk:-1 ql:-1 qm:-1 qn:-1 qo:158 qp:676
14) You must delete the localhost-mysql_cacti_stats.txt file, which is automatically generated locally with the permission of root, otherwise you will not have permission to access the data in MySQL on the server side.
root@localhost ~]# ll /tmp/localhost-mysql_cacti_stats.txt
-rw-r--r-- 1 root root 1228 Jul 15 23:52 /tmp/localhost-mysql_cacti_stats.txt
15) Delete it
root@localhost ~]#rm -rf /tmp/localhost-mysql_cacti_stats.txt
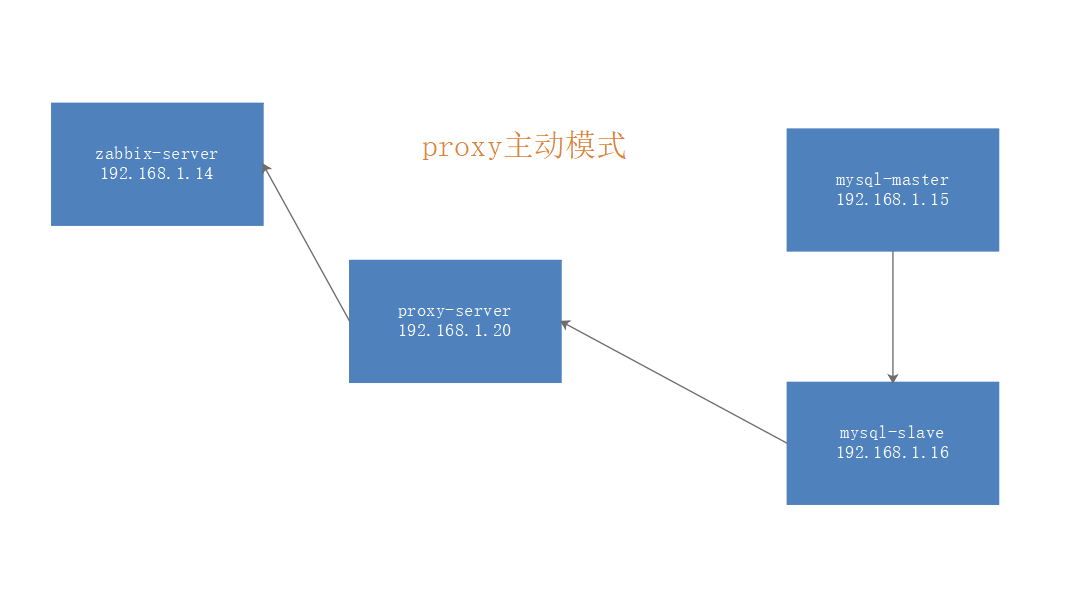
3. Configuration at zabbix-proxy proxy server (ubuntu system 18.4)
1) Configuration of warehouse sources
root@ubuntu1804:~# wget https://repo.zabbix.com/zabbix/4.0/debian/pool/main/z/zabbix-release/zabbix-release_4.0-2+stretch_all.deb
root@ubuntu1804:~# dpkg -i zabbix-release_4.0-2+stretch_all.deb
root@ubuntu1804:~# apt update
2) Download and install proxy agent software
root@ubuntu1804:~# apt install zabbix-proxy-mysql -y
3) Install the zabbix_get test command package
root@ubuntu1804:~# apt install zabbix-get -y
4) Check the installed zabbix-proxy-mysql
root@ubuntu1804:~# dpkg -l | grep zabbix
ii  zabbix-get                            1:4.0.10-1+bionic                 amd64        Zabbix network monitoring solution - get
ii  zabbix-proxy-mysql                    1:4.0.10-1+bionic                 amd64        Zabbix network monitoring solution - proxy (MySQL)
ii  zabbix-release                        1:4.0-2+bionic                    all          Zabbix official repository configuration
5) Modify the configuration file of proxy proxy proxy service
root@ubuntu1804:~# grep '^[a-Z]' /etc/zabbix/zabbix_proxy.conf
ProxyMode=0   #0 means open active mode
Server=192.168.1.14  #ip address of server
Hostname=zabbix-proxy-active  #Proxy proxy host name. Adding this proxy to the web side must be the same as the host name here
ListenPort=10051  #Ports that proxy listens on
LogFileSize=0 #Close Log Autorotation
DBHost=192.168.1.14 #Database Host
DBName=zabbix_proxy  #Database name
DBUser=zabbix  #Database users
DBPassword=zabbix  #Database password
ProxyLocalBuffer=24  #After the data access server, the local time to save data is 720 hours.
ProxyOfflineBuffer=24  #Unsubmitted data to the server, local data storage time is 720 hours
ConfigFrequency=10  #How often do you go to the server to get the monitoring item information by default of 3600 seconds?
DataSenderFrequency=5 #Data sending interval, default 1 second
CacheSize=2G #Save maximum memory for monitors by default of 8M
HistoryCacheSize=2G #The largest village to keep monitoring historical data is 16M by default.
Timeout=30 #Monitoring item timeout time, unit second
LogSlowQueries=3000  #How long will database queries be logged in milliseconds?
6) Restart the proxy service and load the configured configuration file
root@ubuntu1804:~# systemctl restart zabbix-proxy
root@ubuntu1804:~# systemctl enable zabbix-proxy
7) Check whether proxy is started
● zabbix-proxy.service - Zabbix Proxy
     Loaded: loaded (/lib/systemd/system/zabbix-proxy.service; disabled; vendor preset: enabled)
     Active: active (running) since Tue 2019-07-16 18:06:43 CST; 2h 36min ago
    Process: 4514 ExecStop=/bin/kill -SIGTERM $MAINPID (code=exited, status=0/SUCCESS)
    Process: 4515 ExecStart=/usr/sbin/zabbix_proxy -c $CONFFILE (code=exited, status=0/SUCCESS)
 Main PID: 4527 (zabbix_proxy)
        Tasks: 25 (limit: 2293)
     CGroup: /system.slice/zabbix-proxy.service
                     ├─4527 /usr/sbin/zabbix_proxy -c /etc/zabbix/zabbix_proxy.conf
                     ├─4531 /usr/sbin/zabbix_proxy: configuration syncer [synced config 4069 bytes in 0.056334 sec, idle 3600 sec]
                     ├─4532 /usr/sbin/zabbix_proxy: heartbeat sender [sending heartbeat message success in 0.001186 sec, idle 60 sec]
                     ├─4533 /usr/sbin/zabbix_proxy: data sender [sent 0 values in 0.014112 sec, idle 1 sec]
                     ├─4534 /usr/sbin/zabbix_proxy: housekeeper [deleted 1454 records in 0.135417 sec, idle for 1 hour(s)]
                     ├─4535 /usr/sbin/zabbix_proxy: http poller #1 [got 0 values in 0.003211 sec, idle 5 sec]
......
4. Configuration on the zabbix-server side
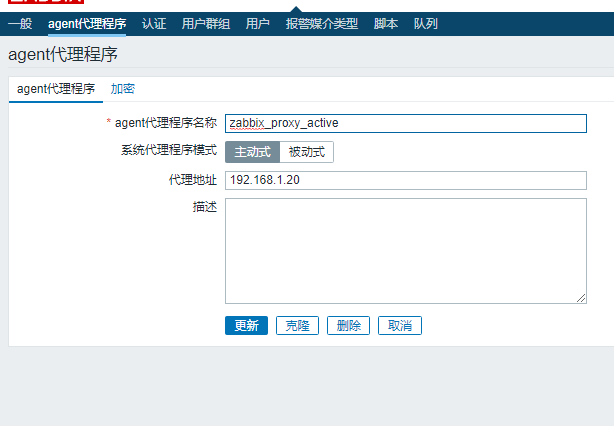
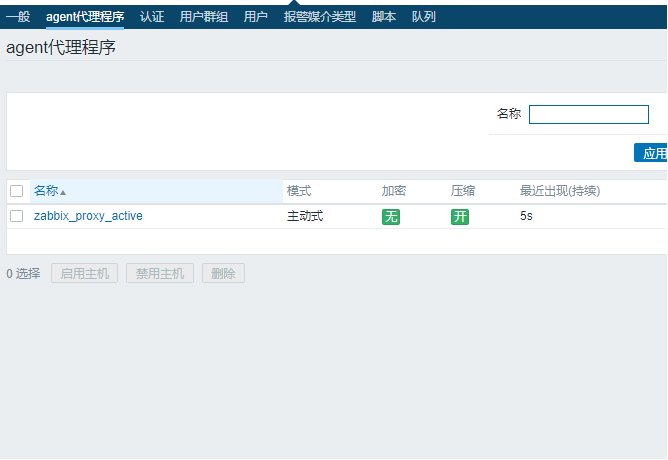
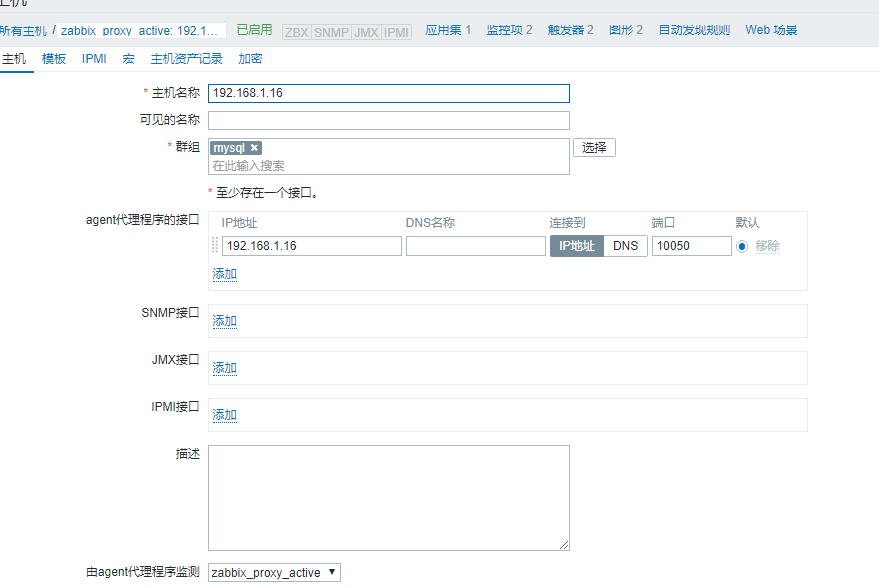
1) Add proxy proxy proxy on the web side
2) Create mysql-slave from service host and add proxy on web side
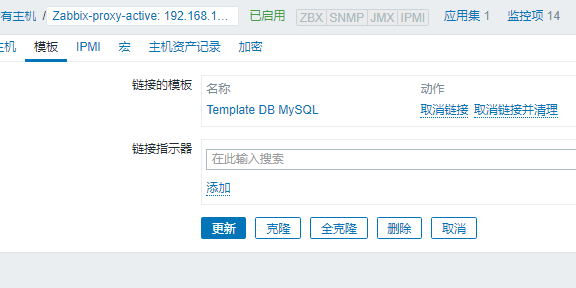
3) Add a mysql template
4) Monitor the server command line test, get the value of msyql database key, and get the value, which proves that the monitor and the monitored end successfully establish a connection.
root@ubuntu1804:~# zabbix_get -s 192.168.1.16 -p 10050 -k MySQL.Key-read-requests
4
root@ubuntu1804:~# zabbix_get -s 192.168.1.16 -p 10050 -k MySQL.Qcache-free-memory
1031336
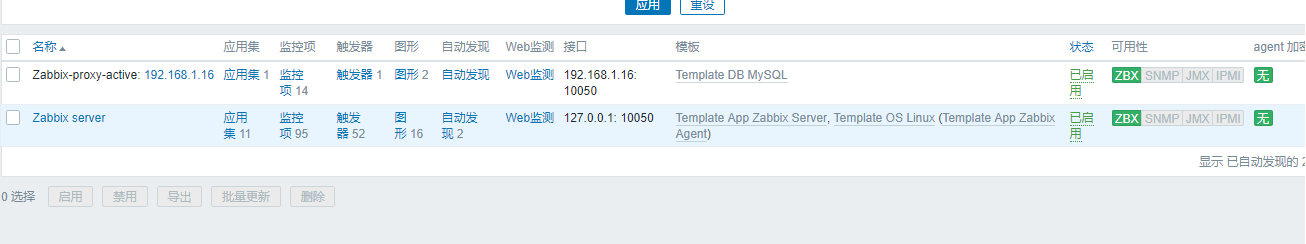
5) View the successful addition of monitored mysql slave services on the web side
6) The newly generated localhost-mysql_cacti_stats.txt file in MySQL from the server side is created by the monitoring server side, and both the owner and the subgroup are zabbix.
[root@localhost ~]# ll  /tmp/localhost-mysql_cacti_stats.txt
-rw-rw-r-- 1 zabbix zabbix 1235 Jul 16 01:00 /tmp/localhost-mysql_cacti_stats.txt
5. Create a custom mysql master-slave monitoring template, monitoring items
On the mysql-slave side:
1) Write custom monitoring scripts
[root@localhost ~]# vim /etc/zabbix/zabbix_agentd.d/mysql_monitor.sh
    #!/bin/bash
    master_slave_check(){
    num1=`mysql -uroot -e "show slave status\G" | grep "Slave_IO_Running" | awk -F":" '{print $2}'`
    num2=`mysql -uroot -e "show slave status\G" | grep "Slave_SQL_Running" | awk -F":" '{print $2}'`
    if test $num1 == "Yes" && test $num2 == "Yes";then
    echo 60
    else
    echo 120
    fi
    }
    mysql_sync_delay(){
    num=`mysql -uroot -e "show slave status\G" | grep "Seconds_Behind_Master" | awk -F":" '{print $2}'`
    echo $num
    }

    menu(){
    case $1 in
        master_slave_check)
        master_slave_check
        ;;
        mysql_sync_delay)

    mysql_sync_delay
    ;;
esac
}
menu $1
2) Write configuration files for custom monitors with key values for monitors
[root@localhost ~]# vim /etc/zabbix/zabbix_agentd.d/mysql-master-slave.conf
UserParameter=mysql_test[*],/etc/zabbix/zabbix_agentd.d/mysql_monitor.sh $1
3) The script adds execution privileges to avoid having no privilege to get the value of the key on the monitor-server side
[root@localhost ~]# chmod a+x mysql_monitor.sh
4) Restart the local agent service
[root@localhost ~]# systemctl restart zabbix-agent
Execute the test on the zabbix-server side first to see if you can get the value of the key on the monitored side
1) Using zabbix-get command to test
root@ubuntu1804:~# zabbix_get -s 192.168.1.16 -p 10050 -k "mysql_test[mysql_sync_delay]"
0
root@ubuntu1804:~# zabbix_get -s 192.168.1.16 -p 10050 -k "mysql_test[master_slave_check]"
60
2) When the mysql-slave service is stopped, you can see that the value displayed is 120, which proves that the mysql-slave service has been disconnected.
root@ubuntu1804:~# zabbix_get -s 192.168.1.16 -p 10050 -k "mysql_test[master_slave_check]"
120
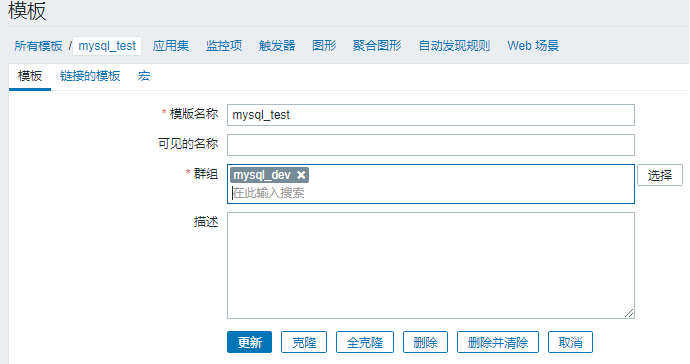
3) Template creation on monitoring web end
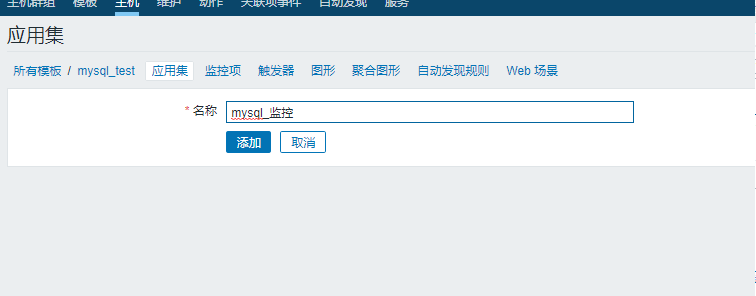
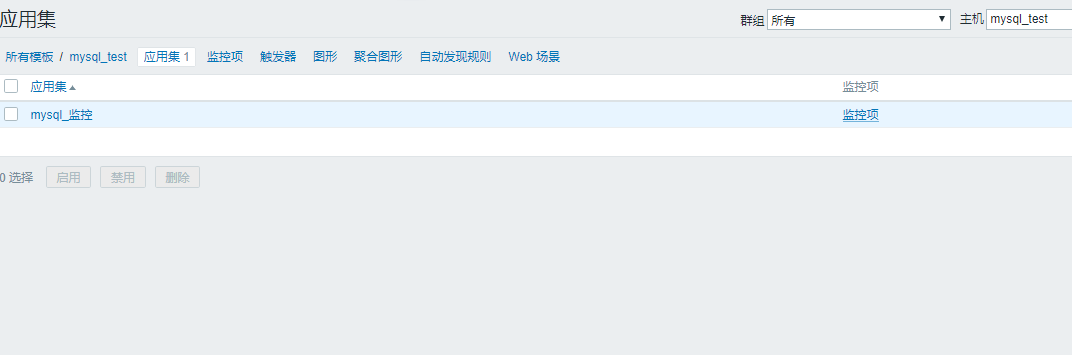
4) Create an application set for this template to categorize monitoring items
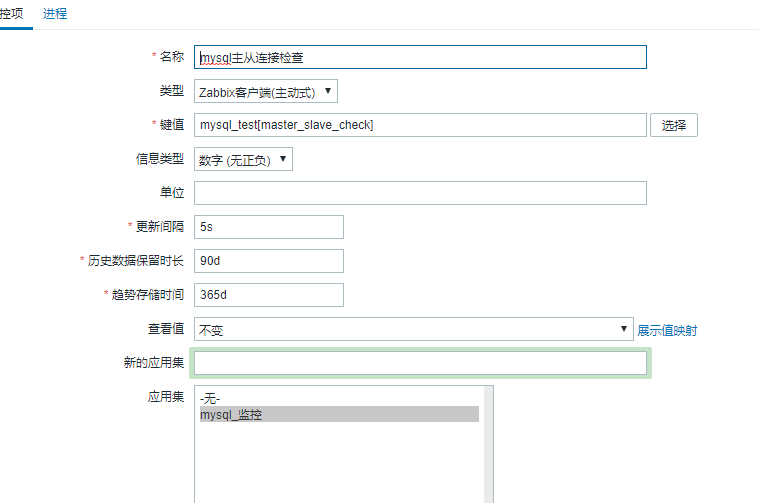
5) Adding monitoring items to application set
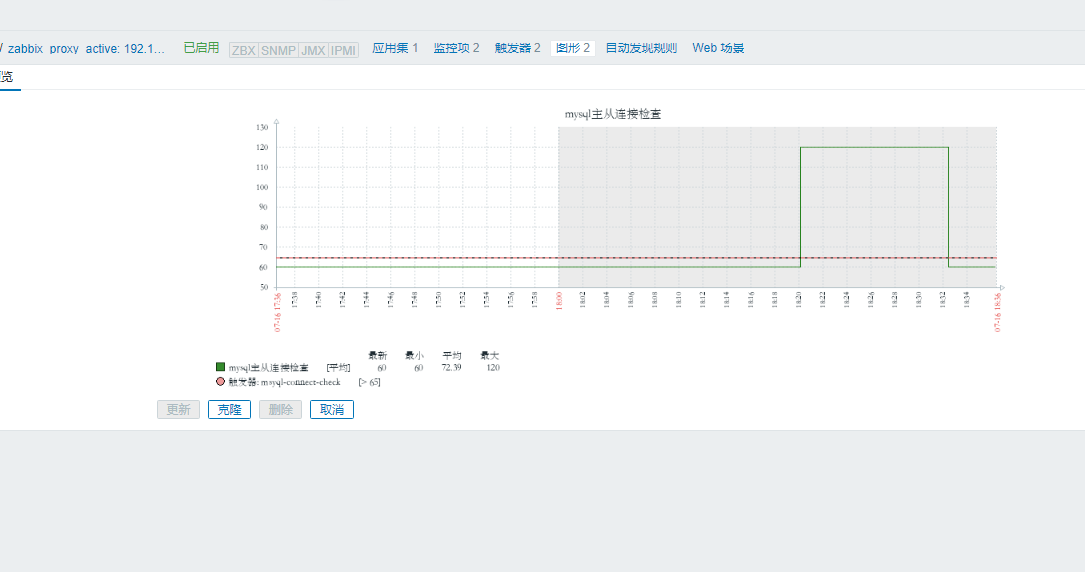
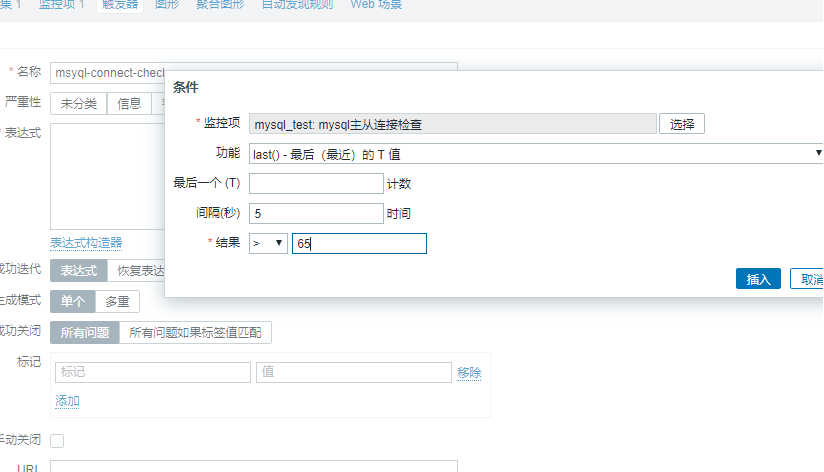
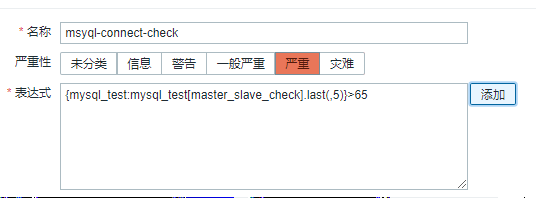
6) Add trigger action when the value is greater than 65 to prove the connection failed
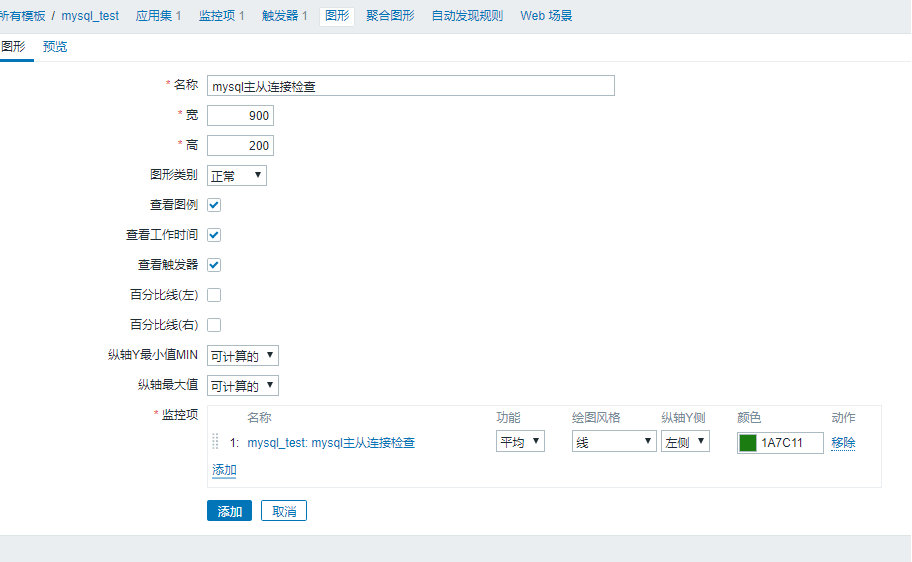
7) Create graphical displays for specified monitors
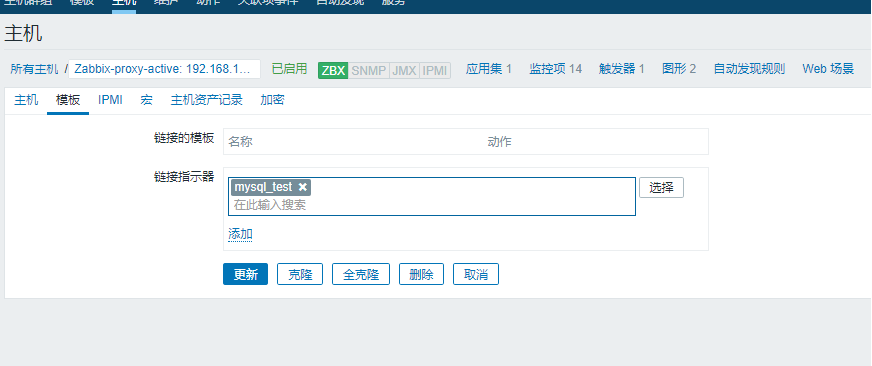
8) Add custom created templates to mysql-slave hosts that need to be monitored
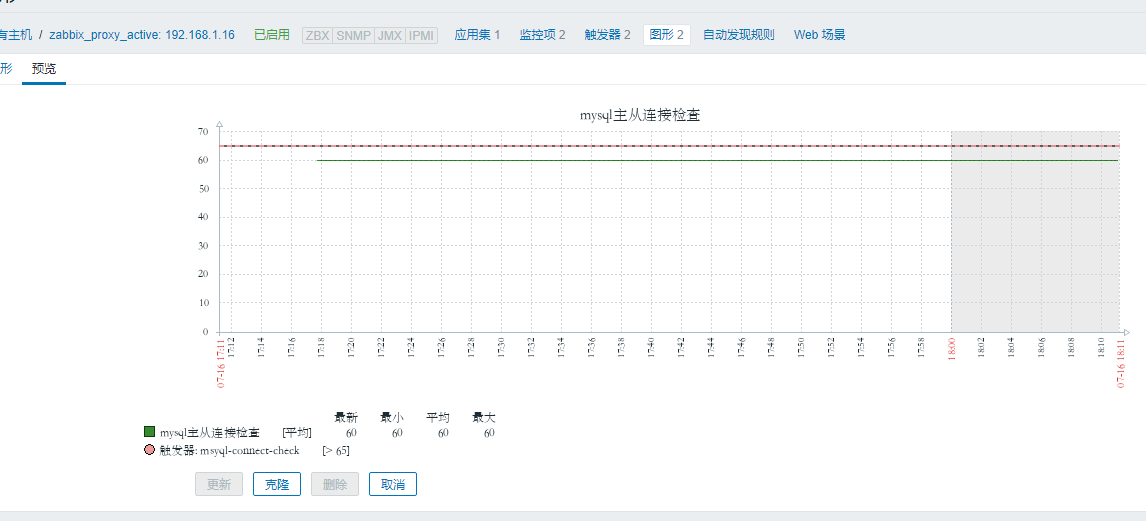
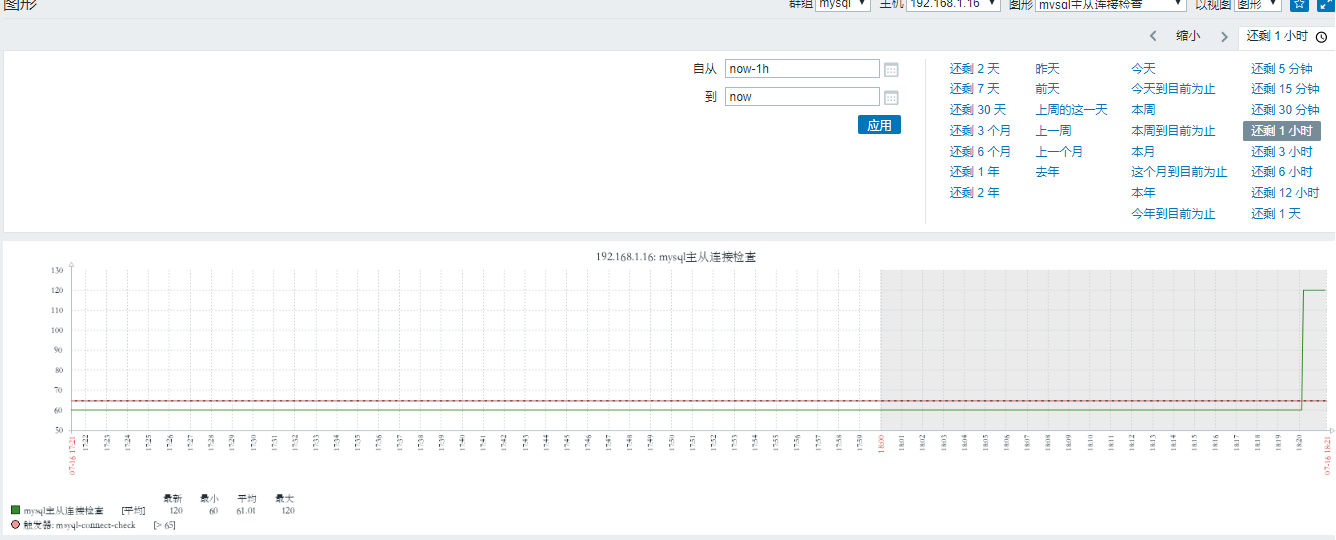
9) Look at mysql-slave host graphics again. Red is the warning line and green is normal.
10) When the mysql-slave service hangs up, look at the graph and get a value that exceeds the red alert line, proving that the master-slave connection is disconnected and hanging.
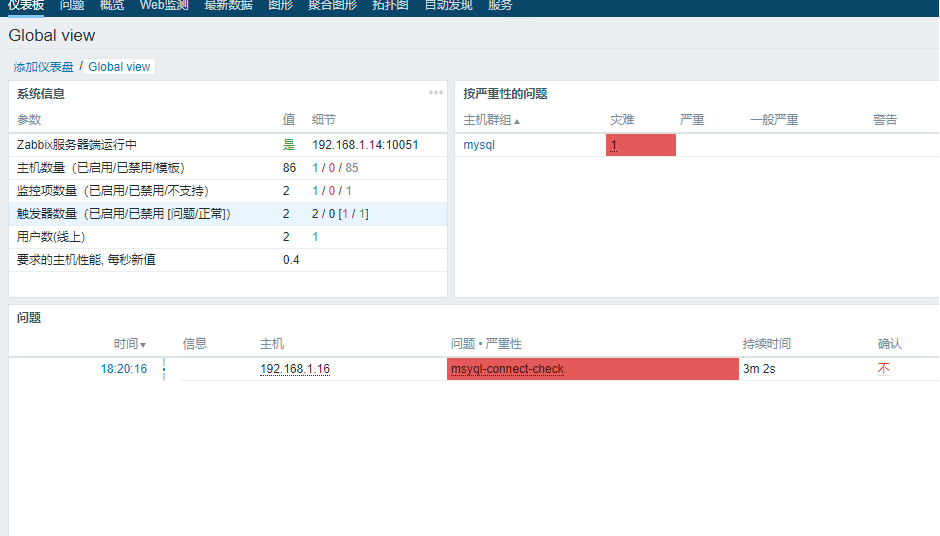
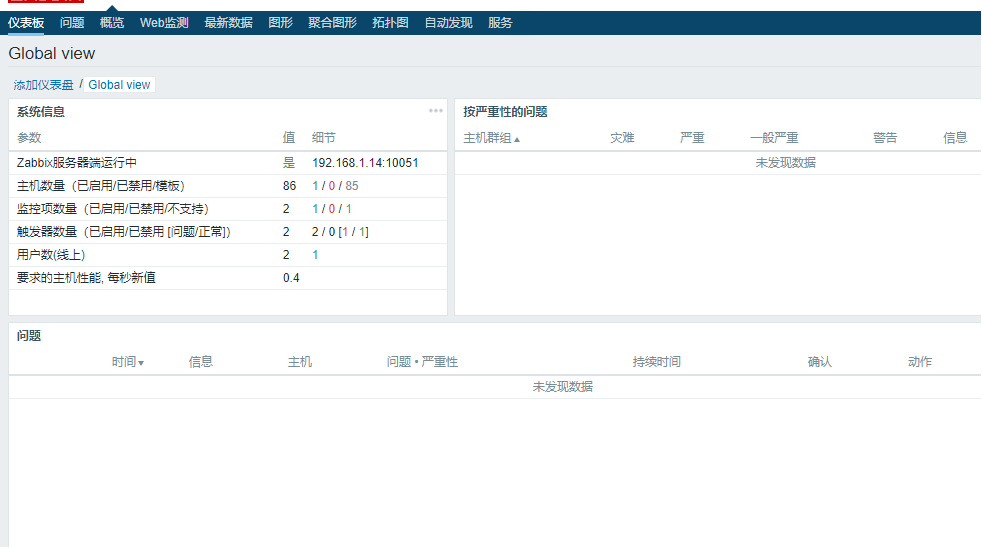
11) Fault alarm information on dashboard
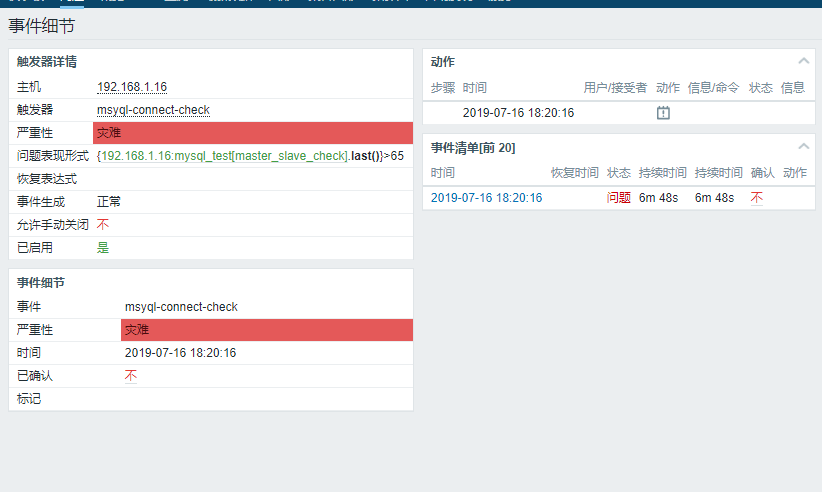
12) Enter the alarm to check the details

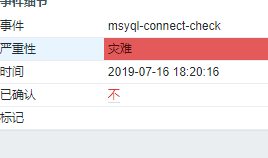
13) Display alarm details
14) Click No
15) Close alarm notification after problem solving

16) The dashboard is back to normal
17) Look at the graph again, so that it has fallen below the warning line and returned to normal. The master and slave are connected.