Image histogram for image processing
- What is image gray histogram? What is histogram equalization? What is histogram specification?
- Gray level histogram: mathematically speaking, the image histogram describes the statistical characteristics of each gray level of the image. It is a function of the gray value of the image and counts the number or frequency of each gray level in the image. In terms of image, the gray histogram is a two-dimensional image, the abscissa is the gray level of each pixel in the image, and the ordinate represents the number and frequency of pixels with each gray level in the image.
- The gray histogram of an image is a discrete function, which represents the corresponding relationship between each gray level of the image and the occurrence frequency of the gray level.
- Histogram equalization: refers to the transformation of the histogram of the original image into a uniform distribution in the whole gray range through some gray mapping (such as nonlinear stretching).
- Objective: to increase the dynamic range of pixel gray value and enhance the overall contrast of the image.
- Histogram specification: it is to adjust the histogram of the original image to approximate the specified target histogram. Selectively enhance the contrast within a certain gray range or make the image gray value meet a specific distribution.
- Normalized histogram: the number of occurrences of each gray level is divided by the total number of pixels of the image to obtain the probability of occurrence of each gray level, so as to obtain the normalized histogram.
- Code: know the image pointer unchar *ptr, image width int width, high int height, and calculate the image gray histogram.
OpenCV implements image histogram:
// RGB trichromatic component histogram. cpp: defines the entry point of the console application.
//

#include "stdafx.h"

#Include < opencv2 / core / core. HPP > / / contains core functions, especially underlying data structures and algorithm functions.
#Include < opencv2 / highgui / highgui. HPP > / / contains functions for reading and writing images and videos, as well as functions for operating the graphical user interface.
#Include < opencv2 / imgproc / imgproc. HPP > / / contains image processing functions.
#include <iostream>

using namespace std;

//Draw the histogram of each single channel after RGB image separation
void f_getRGBHist(cv::Mat& img)
{
	int bins = 256;
	int hist_size[] = {bins};
	float range[] = {0, 256};
	const float* ranges[] = {range};

	cv::MatND hist_r, hist_g, hist_b;
	int nImages = 1;
	int dims = 1;

	int channels_r[] ={0};
	cv::calcHist(&img, 1, channels_r, cv::Mat(), hist_r, 1, hist_size, ranges, true, false);

	int channels_g[] = {1};
	cv::calcHist(&img, 1, channels_g, cv::Mat(), hist_g, 1, hist_size, ranges, true, false);

	int channels_b[] = {2};
	cv::calcHist(&img, 1, channels_b, cv::Mat(), hist_b, 1, hist_size, ranges, true, false);


	double max_val_r, max_val_g, max_val_b;
	double min_val_r, min_val_g, min_val_b;
	cv::minMaxLoc(hist_r, &min_val_r, &max_val_r, 0, 0);
	cv::minMaxLoc(hist_g, &min_val_g, &max_val_g, 0, 0);
	cv::minMaxLoc(hist_b, &min_val_b, &max_val_b, 0, 0);

	int scale = 1;
	int hist_height = 256;
	cv::Mat hist_img = cv::Mat::zeros(hist_height, bins*3, CV_8UC3);
	for (int i=0; i<bins; i++)
	{
		float bin_val_r = hist_r.at<float>(i);
		float bin_val_g = hist_g.at<float>(i);
		float bin_val_b = hist_b.at<float>(i);

		int intensity_r = cvRound(bin_val_r*hist_height/max_val_r); //Height to draw
		int intensity_g = cvRound(bin_val_g*hist_height/max_val_g);
		int intensity_b = cvRound(bin_val_b*hist_height/max_val_b);

		//cv::rectangle();
		cv::rectangle(hist_img, cv::Point(i*scale, hist_height-1), cv::Point((i+1)*scale-1,hist_height-intensity_r), CV_RGB(255,0,0));
		cv::rectangle(hist_img, cv::Point((i+bins)*scale, hist_height-1), cv::Point((i+bins+1)*scale-1,hist_height-intensity_g), CV_RGB(0,255,0));
		cv::rectangle(hist_img, cv::Point((i+bins*2)*scale, hist_height-1), cv::Point((i+bins*2+1)*scale, hist_height-intensity_b), CV_RGB(0,0,255));
	}
	cout << "finish drawing histogram." << endl;
	cv::imwrite("../RGB_Histogram.bmp", hist_img);
	cv::namedWindow("RGB Histogram", 1);
	cv::imshow("RGB Histogram", hist_img);
	cv::waitKey();
}

int _tmain(int argc, _TCHAR* argv[])
{
	cv::Mat src;
	src = cv::imread("../baboon.bmp");
	if (src.data==NULL)
	{
		cout << "fail to load image." << endl;
		return 0;
	}
	cv::namedWindow("source", 1);
	cv::imshow("source", src);

	f_getRGBHist(src);
	f_getRGBHist2(src);


	return 0;
}
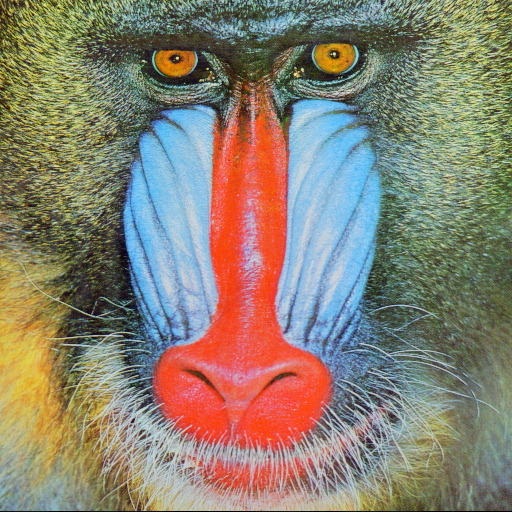
Figure 1 original src
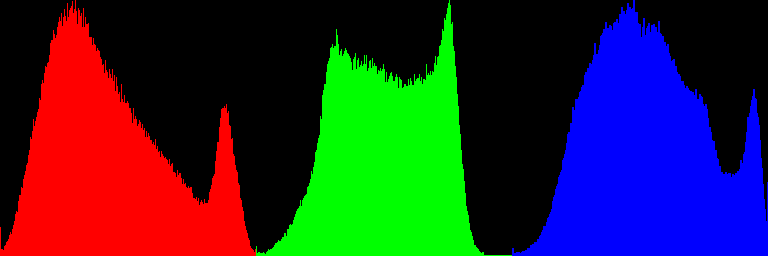
Fig. 2 histogram of RGB three color component
int f_getRGBHist2(cv::Mat& src)
{
	//Mat src;
	Mat dst;

	/ Load image
	//src = imread( "../baboon.jpg", 1 );

	if( !src.data )
	{
		return -1;
	}

	Mat gray_Image;
	cvtColor(src, gray_Image, CV_BGR2GRAY);
	imshow("gray_Image", gray_Image);
	imwrite("../gray_Image.bmp", gray_Image);

	Mat result;
	//Histogram equalization
	equalizeHist(gray_Image, result);

	imshow("equalizeHist", result);
	imwrite("../equalizeHist.bmp", result);


	///BGR color image is divided into 3 single channel images (R, G and B)
	vector<Mat> rgb_planes;
	split( src, rgb_planes );

	///Set bin number
	int histSize = 255;

	///Set value range (R,G,B))
	float range[] = { 0, 255 } ;
	const float* histRange = { range };

	bool uniform = true;
	bool accumulate = false;

	Mat r_hist, g_hist, b_hist;

	///Calculate histogram:
	calcHist( &rgb_planes[0], 1, 0, Mat(), r_hist, 1, &histSize, &histRange, uniform, accumulate );
	calcHist( &rgb_planes[1], 1, 0, Mat(), g_hist, 1, &histSize, &histRange, uniform, accumulate );
	calcHist( &rgb_planes[2], 1, 0, Mat(), b_hist, 1, &histSize, &histRange, uniform, accumulate );

	// Create histogram canvas
	int hist_w = 600; int hist_h = 400;
	int bin_w = cvRound( (double) hist_w/histSize );

	Mat rgb_hist[3];
	//initialization
	for(int i=0; i<3; ++i)
	{
		rgb_hist[i] = Mat(hist_h, hist_w, CV_8UC3, Scalar::all(0));
	}

	Mat histImage( hist_h, hist_w, CV_8UC3, Scalar( 0,0,0) );

	///Normalize the histogram to the range [0, histImage.rows]
	normalize(r_hist, r_hist, 0, histImage.rows-10, NORM_MINMAX, -1, Mat() );
	normalize(g_hist, g_hist, 0, histImage.rows-10, NORM_MINMAX, -1, Mat() );
	normalize(b_hist, b_hist, 0, histImage.rows-10, NORM_MINMAX, -1, Mat() );

	///Draw the histogram on the histogram canvas
	for( int i = 1; i < histSize; i++ )
	{
		line( histImage, Point( bin_w*(i-1), hist_h - cvRound(r_hist.at<float>(i-1)) ) ,
			Point( bin_w*(i), hist_h - cvRound(r_hist.at<float>(i)) ),
			Scalar( 0, 0, 255), 2, 8, 0  );
		line( histImage, Point( bin_w*(i-1), hist_h - cvRound(g_hist.at<float>(i-1)) ) ,
			Point( bin_w*(i), hist_h - cvRound(g_hist.at<float>(i)) ),
			Scalar( 0, 255, 0), 2, 8, 0  );
		line( histImage, Point( bin_w*(i-1), hist_h - cvRound(b_hist.at<float>(i-1)) ) ,
			Point( bin_w*(i), hist_h - cvRound(b_hist.at<float>(i)) ),
			Scalar( 255, 0, 0), 2, 8, 0  );
	}
	///Display histogram
	namedWindow("calcHist Demo", 1);
	imshow("calcHist Demo", histImage );
	imwrite("../calcHist_Demo.bmp", histImage );


	for (int j=0; j<histSize; ++j)
	{
		int val = saturate_cast<int>(r_hist.at<float>(j));
		rectangle(rgb_hist[0], Point(j*2+10, rgb_hist[0].rows), Point((j+1)*2+10, rgb_hist[0].rows-val), Scalar(0,0,255),1,8);

		val = saturate_cast<int>(g_hist.at<float>(j));
		rectangle(rgb_hist[1], Point(j*2+10, rgb_hist[1].rows), Point((j+1)*2+10, rgb_hist[1].rows-val), Scalar(0,255,0),1,8);

		val = saturate_cast<int>(b_hist.at<float>(j));
		rectangle(rgb_hist[2], Point(j*2+10, rgb_hist[2].rows), Point((j+1)*2+10, rgb_hist[2].rows-val), Scalar(255,0,0),1,8);
	}

	imshow("R", rgb_hist[0]);
	imshow("G", rgb_hist[1]);
	imshow("B", rgb_hist[2]);
	cv::imwrite("../R_Histogram.bmp", rgb_hist[0]);
	cv::imwrite("../G_Histogram.bmp", rgb_hist[1]);
	cv::imwrite("../B_Histogram.bmp", rgb_hist[2]);

	waitKey(0);

	return 0;
}
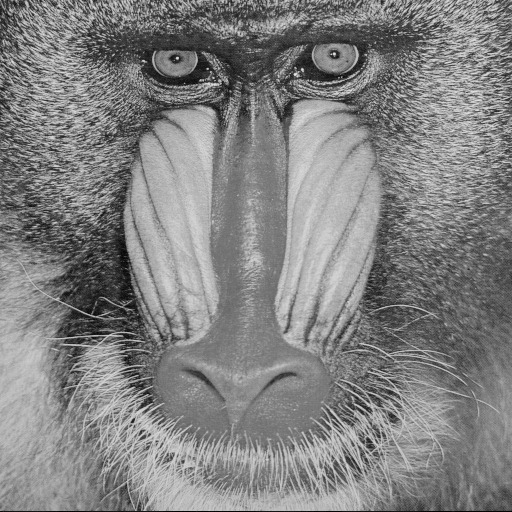
Figure 3 gray image (BGR - > gray)
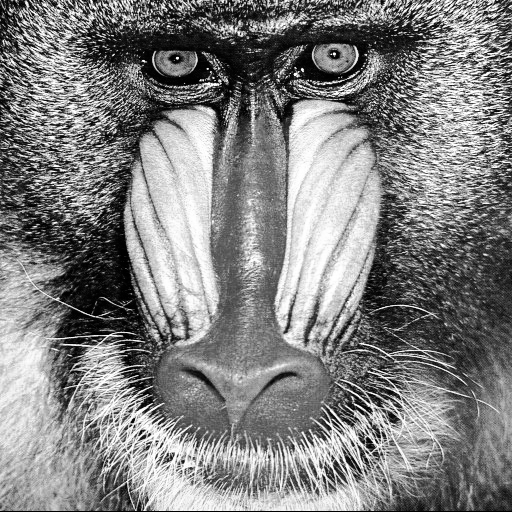
Figure 4 Image after gray histogram equalization
Comparing Fig. 3 and Fig. 4, it is obvious that the overall contrast of Fig. 4 is much stronger and the brightness is much brighter than that of Fig. 3. It can be seen that the function of image histogram equalization is to increase the dynamic range of pixel gray value and enhance the overall contrast of the image.
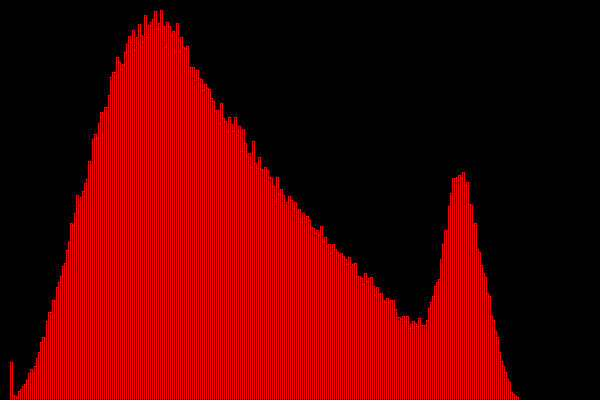
Figure 5 Image histogram of R channel
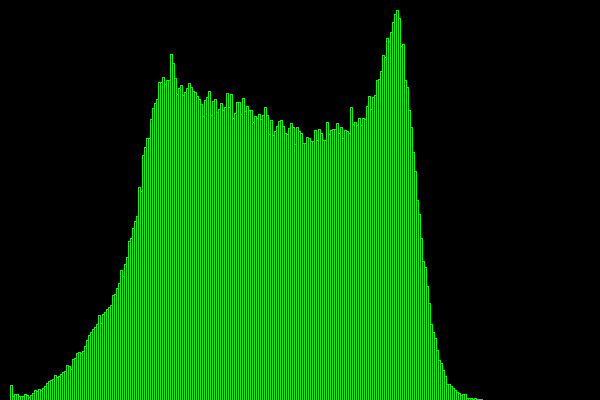
Figure 6 Image histogram of G-channel
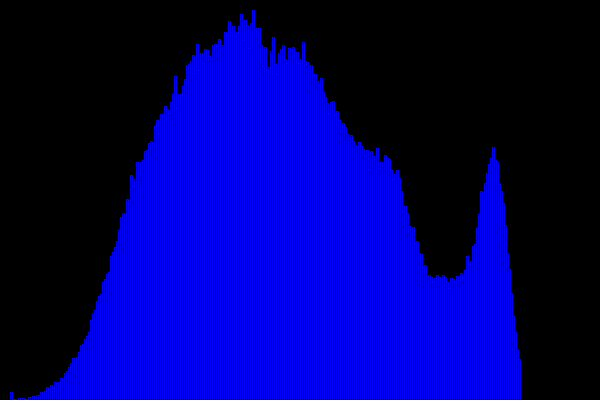
Figure 7 Image histogram of channel B