iClient for OpenLayers drawing graphics library
By yangjl
In the process of support, I once met a small customer partner who asked me how to store the drawn graphics. In fact, there are many ways. I chose a simpler way to create my own service by using nodejs and connect mysql to store the graphics in the database. This implementation mainly uses iClient for OpenLayers and Express to build node.js Web.
Not much, get to the point.
Implementation principle:
- Using express to build simple web services,
- Using Node.js GET/POST request, rendering web page, and submitting painted geojson object to server
- Monitor the success of warehousing and return the success information
Development preparation:
The presentation and implementation of the graphics warehousing function requires the knowledge of node.js and the SuperMap iClient for OpenLayers.
- node.js, Express framework, nodejs connection mysql database related knowledge address:
https://www.runoob.com/nodejs/nodejs-express-framework.html. - SuperMap iClient for OpenLayers product development guide address:
http://iclient.supermap.io/web/introduction/openlayersDevelop.html.
Based on iClient for OpenLayers+nodejs to realize the graph Warehousing:
First of all, we build web services by using experts. The specific steps are as follows
The specific steps are as follows:
- Use require to introduce the interpreters, mysql driver, render engine, and the body parser interface of nodejs to parse the post request parameters.
var express = require('express');
var mysql=require('mysql');
var app=new express();
//render's engine needs npminstall
app.engine('html',require('express-art-template'))
//post request get parameters
var bodyParser = require('body-parser');
app.use(bodyParser.urlencoded({ extended: true }));
- Render html as a get request sent by the client
app.get('/',function(req,res){
    console.log(req.body)
    res.render('index.html')
});
- Build index.html home page, use CDN online to introduce OpenLayers file for simple code implementation, and develop a single web page.
<link href="https://cdnjs.cloudflare.com/ajax/libs/openlayers/4.6.5/ol.css" rel="stylesheet" />
<link href='http://iclient.supermap.io/dist/openlayers/iclient-openlayers.min.css' rel='stylesheet' />
<script type="text/javascript" src="https://cdnjs.cloudflare.com/ajax/libs/openlayers/4.6.5/ol.js"></script>
<script type="text/javascript" src="http://iclient.supermap.io/dist/openlayers/iclient-openlayers.min.js"></script>
- Initialize map
   map = new ol.Map({
        target: 'map',
        controls: ol.control.defaults({attributionOptions: {collapsed: false}})
            .extend([new ol.supermap.control.Logo()]),
        view: new ol.View({
            center: [100, 0],
            zoom: 3,
            projection: 'EPSG:4326'
        })
    });
    var layer = new ol.layer.Tile({
        source: new ol.source.TileSuperMapRest({
            url: baseUrl,
            wrapX: true
        }),
        projection: 'EPSG:4326'
    })
    map.addLayer(layer);
- Add interactive controls and click to draw the face graph
//Draw
$("#draw").click(function(){
     draw = new ol.interaction.Draw({
                source: source,
                type: "Polygon",
                snapTolerance: 20
            });
     map.addInteraction(draw);
     draw.on("drawend",function(e){
           feas_geojson.push(format.writeFeature(e.feature))

     });
     map.addLayer(vector)
})
- Render index.html through get request in server.js
app.get('/',function(req,res){
    console.log(req.body)
    res.render('index.html')
});
- server.js setting to start web Service
//Startup service
app.listen(3000,function(){
    console.log("localhost:3000")
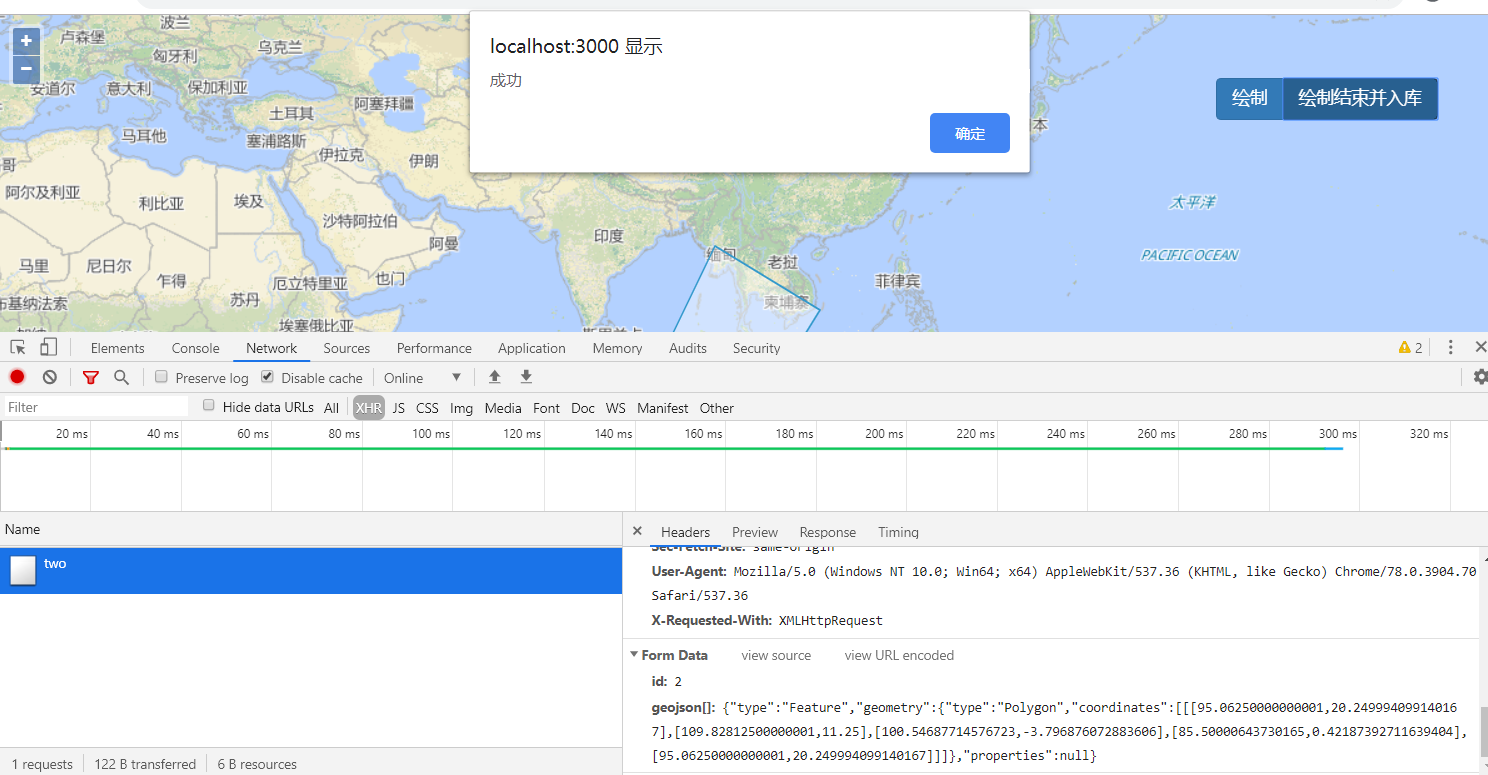
- In index.html, when the drawing is completed, the feature object drawn is parsed as geojson, and a post request is sent to the service to transmit the data to the server.
var format=new ol.format.GeoJSON();
feas_geojson.push(format.writeFeature(e.feature))//Convert feature to geojson
        $.ajax({
            url:'/two',
            type:"post",
            data:{
                id:cout,
                geojson:feas_geojson
            },
            contentType:"application/x-www-form-urlencoded",
            success:function(e){
                alert(e)
            }
        })
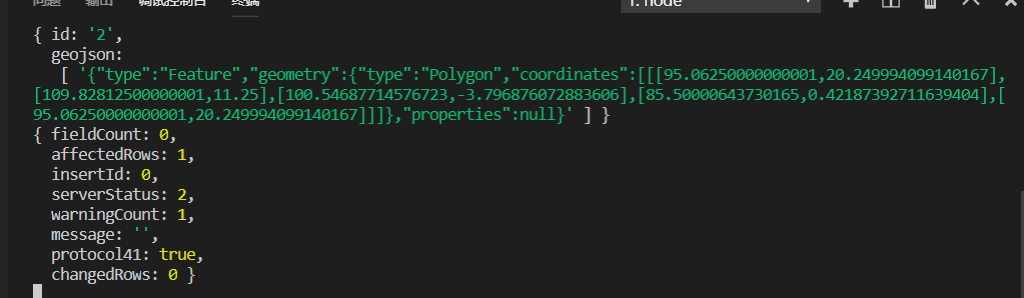
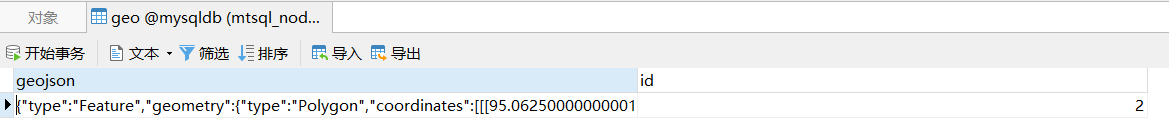
- The server.js listens for the post request, parses the geojson parameter and inserts the data into mysql. If the database operation is successful, the success character is returned to the client.
//post requests to send data and return results
app.post('/two',function(req,res){
    console.log(req.body) //Parsing the parameters passed in by the post request
   for(var i=0;i<req.body.geojson.length;i++)
   {
       //Add data
    var sql="insert into mysqldb.geo(id,geojson) values(?,?)"
    var sqlpar=[req.body.id,req.body.geojson[i]]
    conn.query(sql,sqlpar,function(err,e){
        if(err){
           throw err
        }
        else{
            results=JSON.parse(JSON.stringify(e));
            console.log(results);
             res.end("Success")
        }

             });
   }
})
- Connect to database
var conn=mysql.createConnection({
    host:"localhost",
    user:'mysql',
    password:'123456',
    port:'3306',
    database:'mysqldb',
    dateStrings:true
})
conn.connect();
Finally, we start the service node server.js and enter localhost:3000 in the browser.
Effect display
The above is all the content of drawing graphics storage.