Introducer
Large data presentation is more and more widely used, and SDK supporting large data presentation has higher levels of echarts, highchart and D3. However, in the function of map presentation, most of them can only draw vector maps, but can not present a map with real effect. In view of this, this paper focuses on how to make a vector map that can see the real effect and interact with each other.
Be all eagerness to see it

As if thinking of sth.
Technology choice
To achieve the above effect, the first SDK to come to mind is TWaver, and the idea is very simple.
Using Node to present a map background picture, the bigger the pixel, the better the zooming effect.
Using ShapeNode to load map data, and set the location, scaling ratio and other factors, just overlap with the map;
3. The Layer of the control map is the bottom layer, which can not be selected; ShapeNode is the upper layer, which can interact;
iChart & ZRender
In this paper, ichart + zrender technology is used to draw the above effect.
Why Use zrender What about it? In fact, zrender is a relatively simple function for drawing basic shapes; in fact, careful you will find that the bottom of echarts is the use of zrender;
Why is it used? ichart What about it? ichart is used to draw commonly used charts, and the bottom layer is based on Canvas, which is easier to transform; while echarts uses SVG, so it is not so easy to modify it! __________
Experimental world
Goal 1: Achieving the effect of column single section chart
It's not so easy to achieve the effect of bar chart. What if ichart does not support it? Customized!
Find ichart's histogram class: Cylinder.js, so start with reforming him!
Find a way to draw network elements buildPath
Cylinder.prototype = {
            type: 'cylinder',
            /**
             * Create a Round Path
             * @param {CanvasRenderingContext2D} ctx
             * @param {module:zrender/shape/Cylinder~ICircleStyle} style
             */
             buildPath : function (ctx, style) {
                 //Get your brush, and I'll just paint.
            }
}
As mentioned above, get the brush of Canvas, draw a rectangle freely, each ellipse up and down, or is it over?
this.ellipse(ctx, style.x, style.y, style.a, style.b);
ctx.fillRect(style.x - style.a, style.y - a, style.a * 2 , d);
this.ellipse(ctx, style.x, style.y - a, style.a, style.b);
Encapsulation, packaging, confusion, plus test code, see the effect;
<!DOCTYPE html>
<html>
<head>
    <meta charset="utf-8" />
    <title>Cylinder</title>
    <script type="text/javascript" src="../doc/asset/js/esl/esl.js"></script>
</head>
<body>
    <script type="text/javascript">
     var fileLocation = '../build/zrender';
     require.config({
        paths:{
            zrender: fileLocation,
            'zrender/shape/Circle': fileLocation,
            'zrender/shape/Cylinder': fileLocation,
        }
    });
     require(["zrender", 'zrender/shape/Circle','zrender/shape/Cylinder'], function(zrender,CircleShape,CylinderShape){
        var zr = zrender.init( document.getElementById("Main") );
        var shape = new CylinderShape({
            style: {
                x: 300,
                y: 300,
                a: 10,
                b: 5,
                height:200,
                brushType: 'both',
                color: 'orange',
                strokeColor: 'red',
                lineWidth: 1,
                text: 'Cylinder'
            },
            highlightStyle:{
                color: 'orange',
                strokeColor: 'red',
                lineWidth: 2,
                text: 'Cylinder'
            },
            draggable : true,
            hoverable:true,
            clickable:true,
        });
        zr.addShape(shape);
    })
</script>
<div id="Main" style="width:1000px;height:600px;"></div>
</body>
</html>

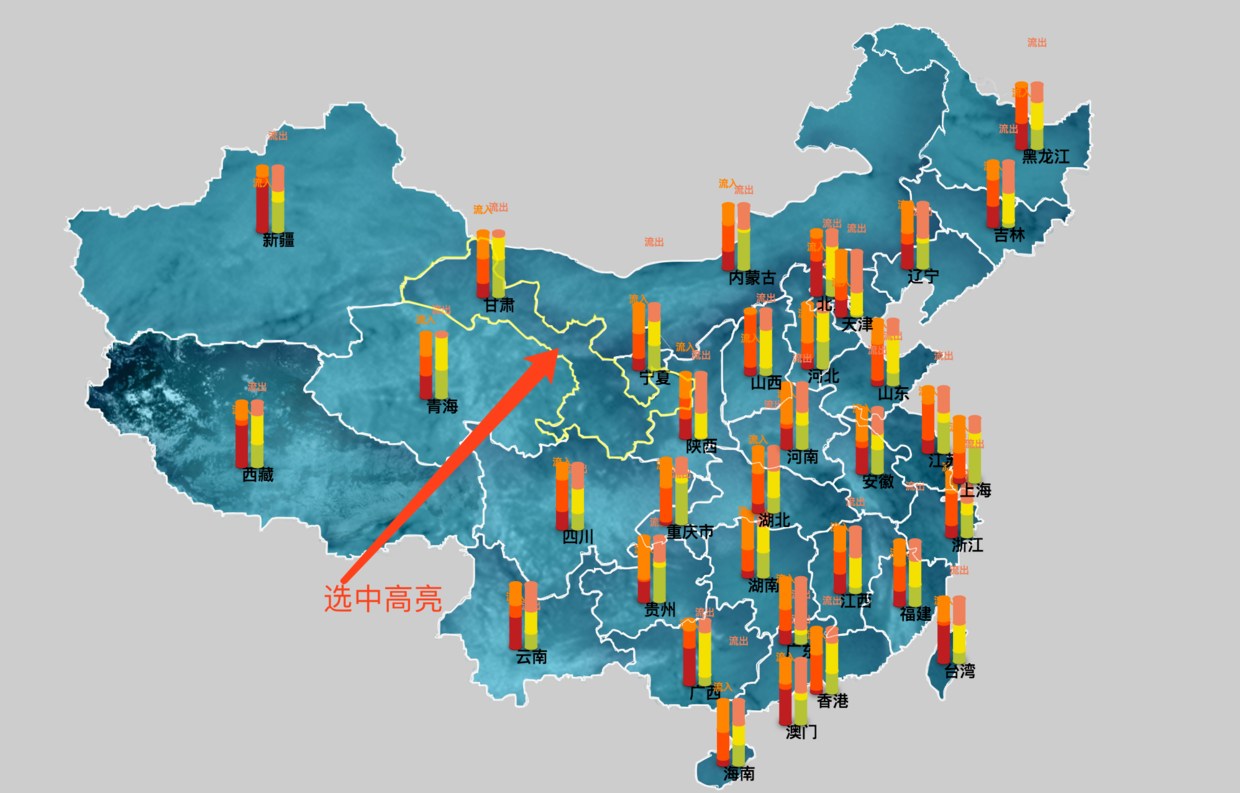
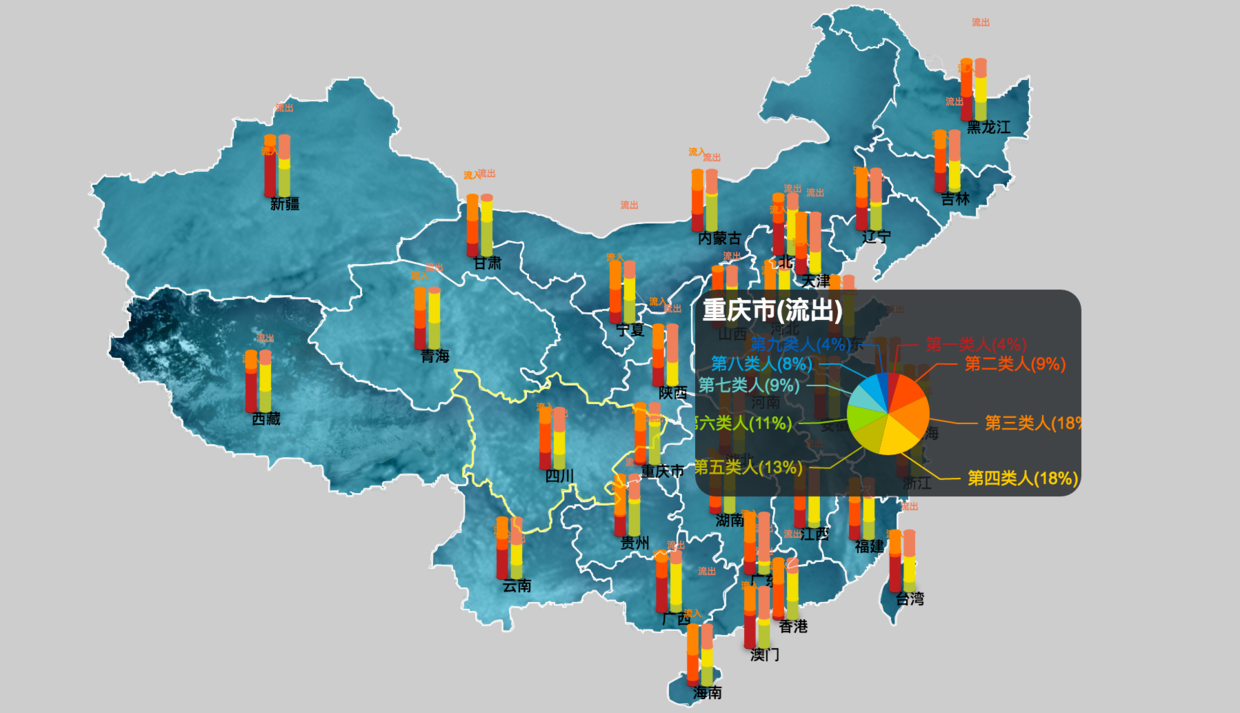
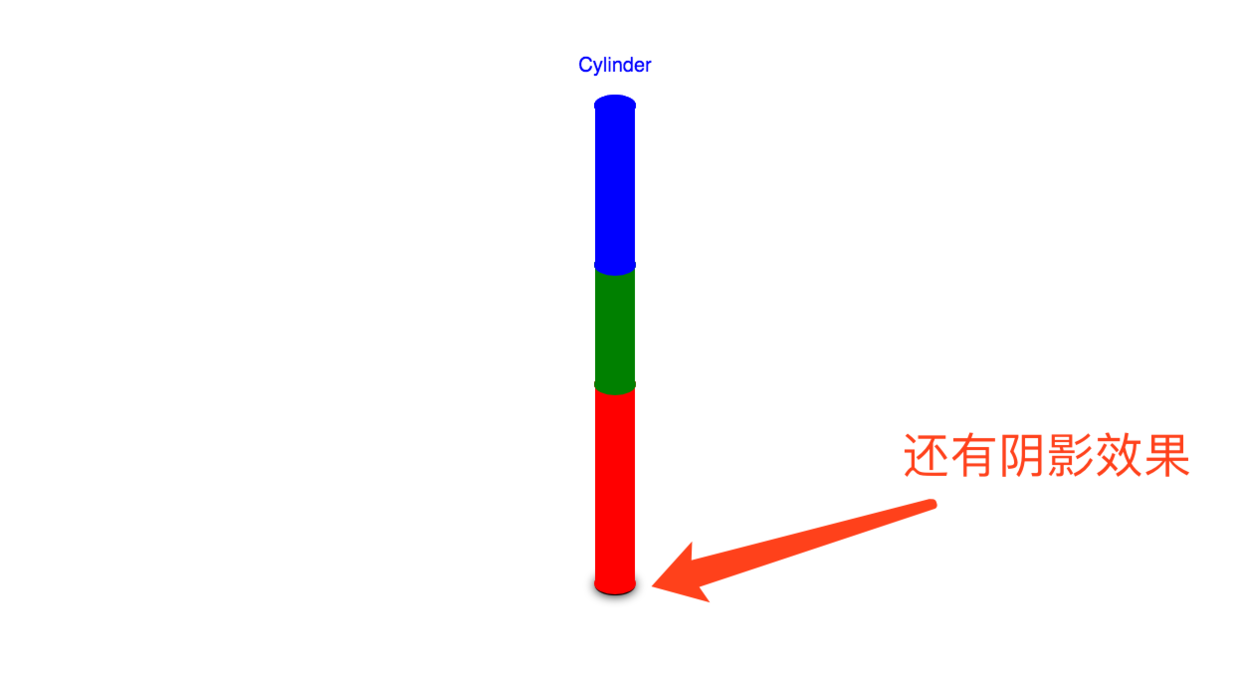
Goal 2: Achieving Column Multi-section Column Map Effect
The question arises. What if you want to implement a multi-segment bar graph? I think you've already got your own ideas; will you finish drawing more paragraphs?
buildPath : function (ctx, style) {
                var rect = this.getRect(style);
                // ctx.strokeRect(rect.x,rect.y,rect.width,rect.height);
                // Better stroking in ShapeBundle
                // ctx.moveTo(style.x + style.a, style.y - style.height/2);
                // ctx.arc(style.x, style.y, style.r, 0, Math.PI * 2, true);
                // ctx.arc(style.x, style.y, style.a, 0, Math.PI * 2, true);
                // this.endDraw(style,ctx);
                var data = style.data, color = style.color, isPercent = style.isPercent || false, maxHeight = style.maxHeight || 100;
                if(isPercent) {
                    if(data instanceof Array) {
                        var data2 = [];
                        var all = 0;
                        for(var i = 0;i<data.length; i++) {
                            all += data[i];
                        }
                        for(var i = 0;i<data.length; i++) {
                            data2.push(maxHeight * data[i]/all);
                        }
                        data = data2;
                    }
                }
                if(data instanceof Array){
                    ctx.fillStyle = 'black';
                    ctx.shadowBlur=15;
                    ctx.shadowColor="black";
                    ctx.strokeStyle = 'rgba(0,0,0,0.1)';
                    ctx.lineWidth = 1;
                    this.ellipse(ctx, style.x, style.y+1, style.a, style.b);
                    ctx.fill();
                    ctx.shadowBlur=0;
                    ctx.lineWidth = 1;
                    this.ellipse(ctx, style.x, style.y, style.a, style.b);
                    var a = 0;
                    for(var i = 0;i < data.length;i++){
                        var d = data[i];
                        if(color instanceof Array){
                            ctx.fillStyle = color[i];
                            ctx.strokeStyle = color[i];
                        }
                        this.endDraw(style,ctx);
                        a += d;
                        ctx.fillRect(style.x - style.a, style.y - a, style.a * 2 , d);
                        this.ellipse(ctx, style.x, style.y - a, style.a, style.b);
                        if(color instanceof Array){
                            ctx.fillStyle = color[i];
                            ctx.strokeStyle = color[i];
                        }
                        this.endDraw(style,ctx);
                    }
                }else{
                    this.ellipse(ctx, style.x, style.y + style.height/2, style.a, style.b);
                    this.endDraw(style,ctx);
                    ctx.fillRect(style.x - style.a, style.y - style.height/2, style.a * 2 , style.height);
                    // ctx.strokeRect(style.x - style.a, style.y - style.height/2, style.a * 2 , style.height);
                    this.ellipse(ctx, style.x, style.y - style.height/2, style.a, style.b);
                    this.endDraw(style,ctx);
                    ctx.moveTo(style.x - style.a, style.y - style.height/2);
                    ctx.lineTo(style.x - style.a,style.y + style.height/2);
                    ctx.fill();
                    ctx.moveTo(style.x + style.a, style.y - style.height/2);
                    ctx.lineTo(style.x + style.a,style.y + style.height/2);
                    ctx.fill();
                }
                // ctx.strokeRect(style.x - style.a, style.y - style.height/2, style.lineWidth , style.height);
                // ctx.strokeRect(style.x + style.a, style.y - style.height/2, style.lineWidth , style.height);
                // this.ellipse(ctx, style.x, style.y+100, style.r, style.r/3);
                return;
            }
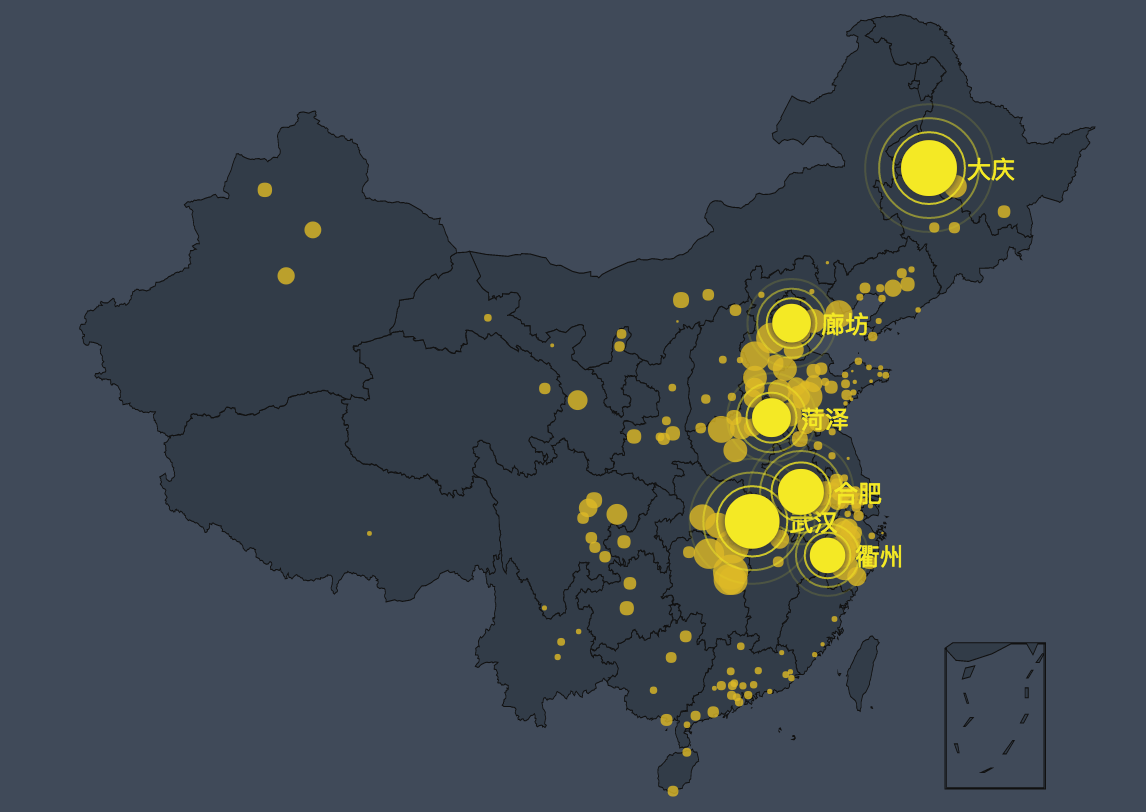
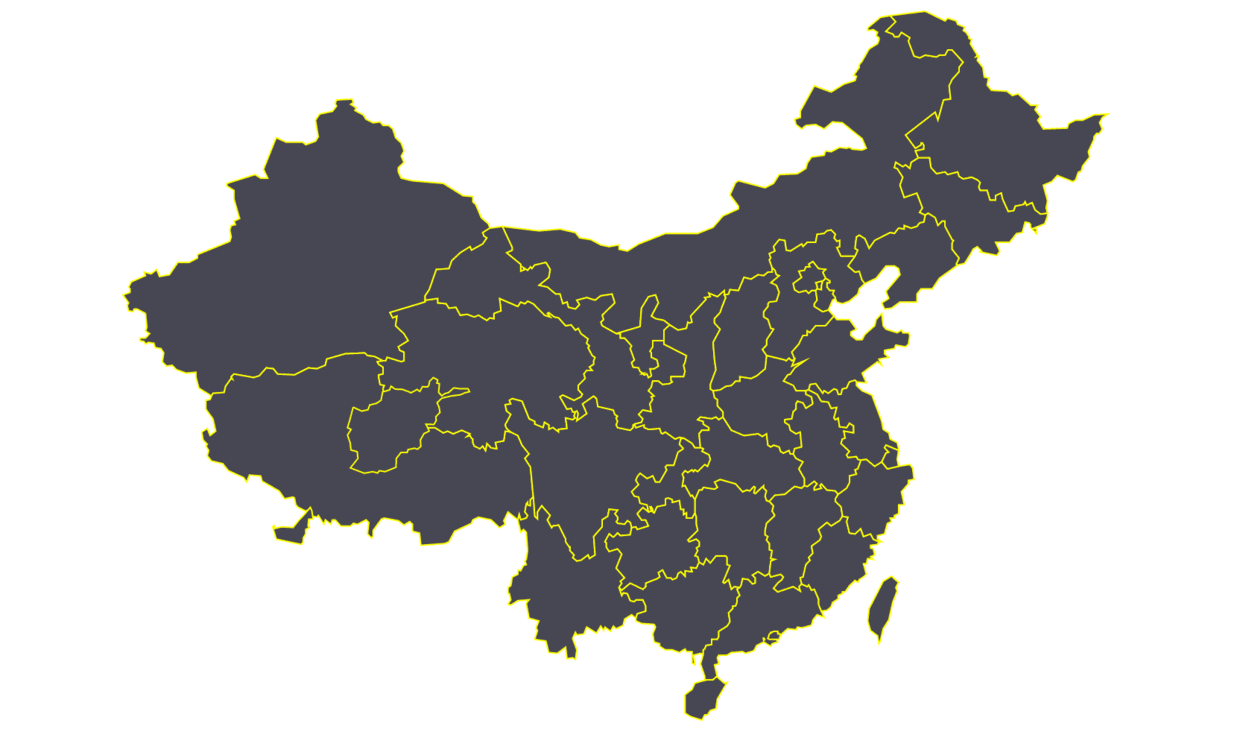
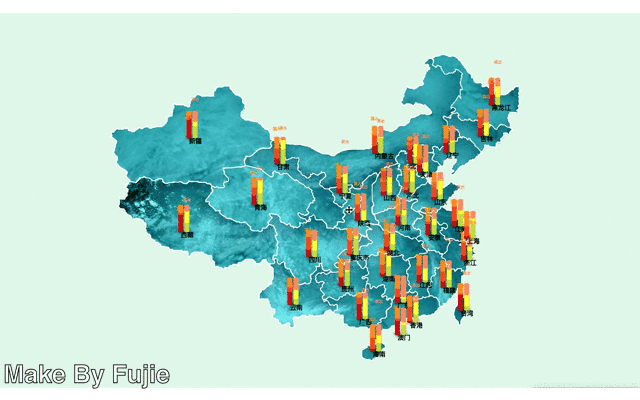
Goal 3: Mapping
Using zrender's Polygon Shape to draw vector maps; but the premise is, where does the data exactly match the bottom image?
Smart, I thought of using TWaver's own editor to deduct map data perfectly, and get the results in the form of the following data format:
< px="1209.5549397107488" y="1242.081312831646"/>
< px="1209.5549397107488" y="1233.5993604641965"/>
< px="1179.8681064246748" y="1212.3944795455723"/>
< px="1184.1090826083996" y="1199.6715509943976"/>
< px="1171.3861540572252" y="1161.502765340874"/>
< px="1162.9042016897754" y="1157.2617891571492"/>
After a little processing, the following data are obtained:
{"type": "Feature","properties":{"id":"65","size":"550","name":"Xinjiang","cp":[471.08525328117855,-97.6746544555845],"childNum":18},"geometry":{"type":"Polygon","coordinates":[[[1143.6222085570992,-80.96566177792188],
            [1131.0904640488523,-76.78841360850622],
            [1131.0904640488523,-93.49740628616884],
            [1126.9132158794366,-135.26988798032542],
Start adding data and creating vector maps.
var smoothLine = new PolylineShape({
            style : {
              pointList : points,
              smooth : 'spline',
              brushType : 'stroke',
              color : 'white',
              strokeColor : "white",
              lineWidth : 2,
              lineType : 'dotted'
            },
            zlevel:1,
            draggable : true,
          });
          zr.addShape(smoothLine);
Finally, complete code is attached:
<!DOCTYPE html>
<html>
<head>
  <title></title>
  <meta charset="utf-8">
  <style type="text/css">
    #bg{
      z-index:1;
      width:1300px;
      height:700px;
      position:absolute;
      background-color: black,
    }
    #chart{
      z-index:2;
      width:280px;
      height:150px;
      position:absolute;
      -moz-border-radius: 15px;
      -webkit-border-radius: 15px;
      border-radius:15px;
    }
  </style>
</head>
<body>
  <div id="bg" ></div>
  <div id="chart" ></div>
  <script type="text/javascript" src="esl.js"></script>
  <script type="text/javascript" src="jquery.js"></script>
  <script type="text/javascript" src="echarts-all.js"></script>
  <script>
    var fileLocation = 'zrender';
    require.config({
      paths:{
        zrender: fileLocation,
        'zrender/shape/Image': fileLocation,
        'zrender/shape/Polygon': fileLocation,
        'zrender/shape/Polyline': fileLocation,
        'zrender/shape/Circle': fileLocation,
        'zrender/shape/Cylinder': fileLocation,
        'zrender/shape/Text': fileLocation,
      }
    });
    var myChart = echarts.init(document.getElementById('chart'));
    $.getJSON('china.json', function(json, textStatus) {
      require(["zrender", 'zrender/shape/Image','zrender/shape/Polygon', "zrender/shape/Polyline",'zrender/shape/Circle','zrender/shape/Cylinder','zrender/shape/Text'], function(zrender, ImageShape,PolygonShape,PolylineShape,CircleShape, CylinderShape,TextShape){
        zr = zrender.init( document.getElementById("bg"));
        var config = require('zrender/config');
        zr.on(config.EVENT.CLICK,
          function(params) {
            if (!params.target) {
              $('#chart').css('z-index',-1);
              myChart.clear();
            }
          }
          );
        zr.modLayer(0,{
         zoomable:true,
         panable:true,
         clearColor:'#cdcdcd',
         position:[160,50],
         rotation:[0,0],
         scale:[0.25,0.25],
       });
        zr.modLayer(1,{
         zoomable:true,
         panable:true,
         clearColor:'rgba(0,0,0,0)',
         position:[205.5,240.5],
         rotation:[0,0],
         scale:[0.25,0.25],
       });
        var image = new ImageShape({
         position : [0, 0],
         scale : [1, 1],
         style : {
           x : 0,
           y : 0,
           image : "bg_china3.png",
         },
         draggable : false,
         clickable: false,
         hoverable:false,
         zlevel:0,
       });
        zr.addShape( image );
        json.features.forEach(function (feature) {
          var points = [];
          if (feature.geometry.type === 'MultiPolygon') {
            feature.geometry.coordinates.forEach(function (polygon) {
              polygon.forEach(function (coordinate) {
                coordinate.forEach(function (point, i) {
                  points.push(convertPoint(point));
                });
              });
            });
          } else if (feature.geometry.type === 'Polygon') {
            feature.geometry.coordinates.forEach(function (coordinate) {
              coordinate.forEach(function (point, i) {
                points.push(convertPoint(point));
              });
            });
          } else {
            console.log(feature.geometry.type);
          }
          var smoothLine = new PolylineShape({
            style : {
              pointList : points,
              smooth : 'spline',
              brushType : 'stroke',
              color : 'white',
              strokeColor : "white",
              lineWidth : 2,
              lineType : 'dotted'
            },
            zlevel:1,
            draggable : true,
          });
          zr.addShape(smoothLine);

          zr.addShape(new PolygonShape({
            style : {
              pointList : points,
              lineCape:'butt',
              // text:feature.properties.name,
              // textPosition:'inside',
              // textPosition:'inside',//'inside','top','bottom','left','right':
              // textColor:'black',
              // textAlign:'start',//
              // textBaseline:'hanging',//'hanging'
              // textFont:'bold 32px verdana',
              // smooth : 0.5,
              // smoothConstraint: [[-Infinity, -Infinity], [200, Infinity]],
              brushType : 'both',
              color : (feature.properties.name === 'Macao' || feature.properties.name === 'Hong Kong') ? '#578096' : 'rgba(220, 20, 60, 0)',
              strokeColor : "white",
              lineWidth : 1,
            },
            highlightStyle:{
              // strokeColor:'white',
            },
            draggable : true,
            zlevel:1,
          }));
          var cp = feature.properties.cp;
          zr.addShape(new TextShape({
           style: {
            text: feature.properties.name,
            x: cp[0],
            y: cp[1] + 30,
            textFont: 'bold 32px verdana',
            textColor:'black',
          },
          draggable : false,
          zlevel:1,
        }));

          // var color = ['#C1232B','#C46924','#FCCE10'];
          var color = ['#be1e20','#ff4e00','#ff8400','#ffce00','#c0b900','#94d600','#63ccca','#00a8e6','#005db9','#ac3c73','#853376'];
          var data = [Math.random() * 100,Math.random() * 100,Math.random() * 100];
          var shape = new CylinderShape({
            style: {
              x: cp[0],
              y: cp[1],
              a: 20,
              b: 10,
              brushType: 'both',
              color: color,
              data:data,
              strokeColor: color,
              lineWidth: 1,
              text: "inflow" || feature.properties.name,
              textFont:'bold 32px verdana',
            },
            highlightStyle:{
              color: color,
              strokeColor: color,
              lineWidth: 2,
              text: 'inflow' || feature.properties.name,
              textFont:'bold 32px verdana',
            },
            hoverable:false,
            clickable:true,
            draggable: false,
            zlevel:1,
            onmousedown: function(e){
              if(e.event.detail == 2){
                option = {
                  backgroundColor:'rgba(31,34,37,0.8)',
                  title : {
                    text:feature.properties.name +'(inflow)',
                    x:'left',
                    textStyle:{
                      color:'white',
                    }
                  },
                  tooltip : {
                    trigger: 'item',
                    formatter: "{a} <br/>{b} : {c} ({d}%)"
                  },
                  color:['#be1e20','#ff4e00','#ff8400','#ffce00','#c0b900','#94d600','#63ccca','#00a8e6','#005db9','#ac3c73','#853376'],
                  series : [
                  {
                    name:'Beijing population',
                    type:'pie',
                    radius : '40%',
                    center: ['50%', '60%'],
                    data:[
                    {value:100, name:'Group 1' + '(' + (100/2230 * 100).toFixed(0)+'%)'},
                    {value:300, name:'Second kinds of people' + '(' + (200/2230 * 100).toFixed(0)+'%)'},
                    {value:400, name:'Third kinds of people' + '(' + (400/2230 * 100).toFixed(0)+'%)'},
                    {value:400, name:'Fourth kinds of people' + '(' + (400/2230 * 100).toFixed(0)+'%)'},
                    {value:300, name:'Fifth kinds of people' + '(' + (300/2230 * 100).toFixed(0)+'%)'},
                    {value:250, name:'Sixth kinds of people' + '(' + (250/2230 * 100).toFixed(0)+'%)'},
                    {value:200, name:'Seventh kinds of people' + '(' + (200/2230 * 100).toFixed(0)+'%)'},
                    {value:180, name:'Eighth kinds of people' + '(' + (180/2230 * 100).toFixed(0)+'%)'},
                    {value:100, name:'Ninth kinds of people' + '(' + (100/2230 * 100).toFixed(0)+'%)'}
                    ]
                  }
                  ]
                };
                var chartDiv = document.getElementById('chart');
                chart.style.left = e.event.clientX + 30 + "px";
                chart.style.top = e.event.clientY - 210/2 + "px";
                myChart.setOption(option);
                $('#chart').css('z-index',2);
              }
            }
          });
          zr.addShape(shape);
          var color = ['#B5C334','#F4E001','#F0805A'];
          var data = [Math.random() * 150,Math.random() * 150,Math.random() * 150];
          var shape = new CylinderShape({
            style: {
              x: cp[0] + 50,
              y: cp[1],
              a: 20,
              b: 10,
              data:data,
              brushType: 'both',
              color: color,
              strokeColor: color,
              lineWidth: 1,
              text: 'Flow out'||feature.properties.name,
              textFont:'bold 32px verdana',
            },
            highlightStyle:{
              color: color,
              strokeColor: color,
              lineWidth: 2,
              text: 'Flow out'||feature.properties.name,
              textFont:'bold 32px verdana',
            },
            hoverable:true,
            clickable:true,
            draggable: false,
            zlevel:1,
            onmousedown: function(e){
              if(e.event.detail == 2){
                option = {
                  backgroundColor:'rgba(31,34,37,0.8)',
                  title : {
                    text:feature.properties.name + '(Flow out)',
                    x:'left',
                    textStyle:{
                      color:'white',
                    }
                  },
                  tooltip : {
                    trigger: 'item',
                    formatter: "{a} <br/>{b} : {c} ({d}%)"
                  },
                  color:['#be1e20','#ff4e00','#ff8400','#ffce00','#c0b900','#94d600','#63ccca','#00a8e6','#005db9','#ac3c73','#853376'],
                  series : [
                  {
                    type:'pie',
                    radius : '40%',
                    center: ['50%', '60%'],
                    data:[
                    {value:100, name:'Group 1' + '(' + (100/2230 * 100).toFixed(0)+'%)'},
                    {value:300, name:'Second kinds of people' + '(' + (200/2230 * 100).toFixed(0)+'%)'},
                    {value:400, name:'Third kinds of people' + '(' + (400/2230 * 100).toFixed(0)+'%)'},
                    {value:400, name:'Fourth kinds of people' + '(' + (400/2230 * 100).toFixed(0)+'%)'},
                    {value:300, name:'Fifth kinds of people' + '(' + (300/2230 * 100).toFixed(0)+'%)'},
                    {value:250, name:'Sixth kinds of people' + '(' + (250/2230 * 100).toFixed(0)+'%)'},
                    {value:200, name:'Seventh kinds of people' + '(' + (200/2230 * 100).toFixed(0)+'%)'},
                    {value:180, name:'Eighth kinds of people' + '(' + (180/2230 * 100).toFixed(0)+'%)'},
                    {value:100, name:'Ninth kinds of people' + '(' + (100/2230 * 100).toFixed(0)+'%)'}
                    ]
                  }
                  ]
                };
                var chartDiv = document.getElementById('chart');
                chart.style.left = e.event.clientX + 30 + "px";
                chart.style.top = e.event.clientY - 210/2 + "px";
                myChart.setOption(option);
                $('#chart').css('z-index',2);
              }
            }
          });
          zr.addShape(shape);
        });
zr.render();
});
});

function randomColor(){
  return '#'+('00000'+(Math.random()*0x1000000<<0).toString(16)).substr(-6);
}
function convertPoint (point) {
  return point;
}
</script>
</body>
</html>