Prometheus is the default monitoring scheme in Kubernetes, which focuses on alerting and collecting and storing recent monitoring indicators.However, Prometheus also exposes some problems at a certain cluster size.For example, how can PB-level historical data be stored in an economical and reliable way without sacrificing query time?How do I access all metrics data on different Prometheus servers through a single query interface?Can duplicate data collected be combined in some way?Thanos offers highly available solutions to these problems, and it has unlimited data storage capabilities.
Thanos
Thanos is based on Prometheus.Prometheus is more or less used when we use Thanos in different ways, but Prometheus is always the basis for the early warning function to target collection and use local data.
Thanos uses the Prometheus storage format to store historical data in object storage at a relatively high cost-effective manner with faster query speed.It also provides a global query view of all your Prometheus.
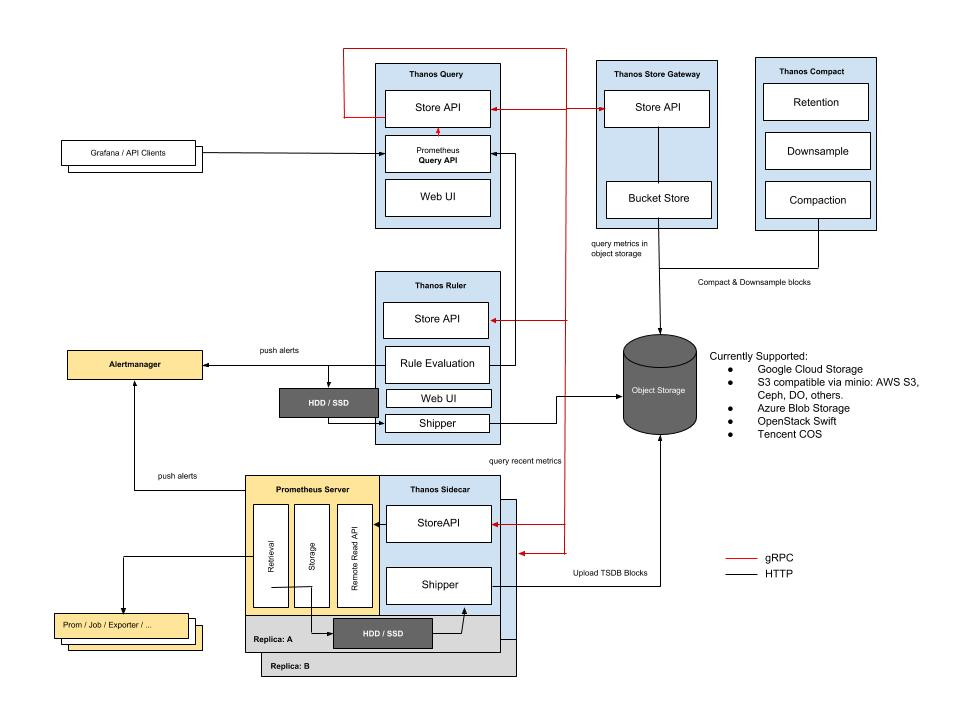
Based on KISS principles and the Unix philosophy, Thanos is divided into components for the following specific functions.
- Sidecar: Connect Prometheus and expose Prometheus to Querier/Query for real-time query, and upload Prometheus data to cloud storage for long-term storage;
- Querier/Query: Implements the Prometheus API and aggregates data from underlying components such as Sidecar, or Store Gateway, which stores gateways;
- Store Gateway: Expose data content from cloud storage;
- Compactor: Compress and downsample data from cloud storage;
- Receiver: Get data from Prometheus'remote-write WAL (Prometheus remote pre-write log) and expose it or upload it to cloud storage;
- Ruler: Evaluate and alert data;
The relationship between components is illustrated in the following figure:

deploy
The easiest way to deploy Prometheus in a K8S cluster is to install it using helm prometheus-operator .Read more about Prometheus-operator Introduction to Prometheus-operator and Configuration Resolution .Prometheus-Operator provides highly available support, the injection of Thanos Sidecar components, as well as monitoring servers and Kubernetes infrastructure components, to monitor pre-built alerts required by applications.
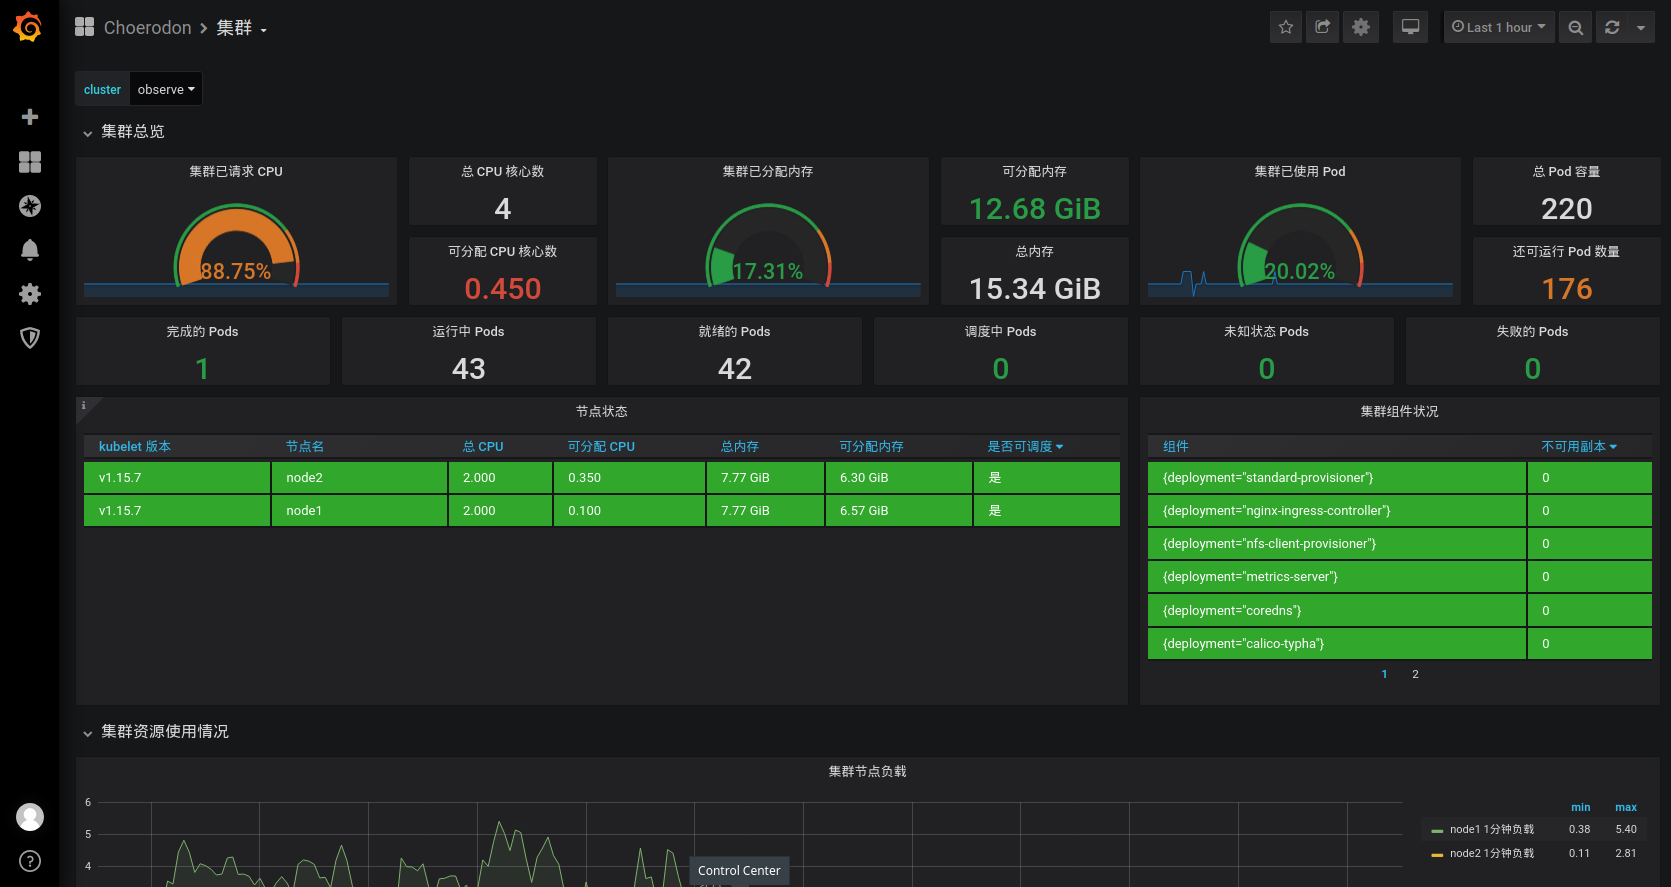
Prometheus-opertor provided by Choerodon adds a dashboard for multi-cluster monitoring based on the source community version.
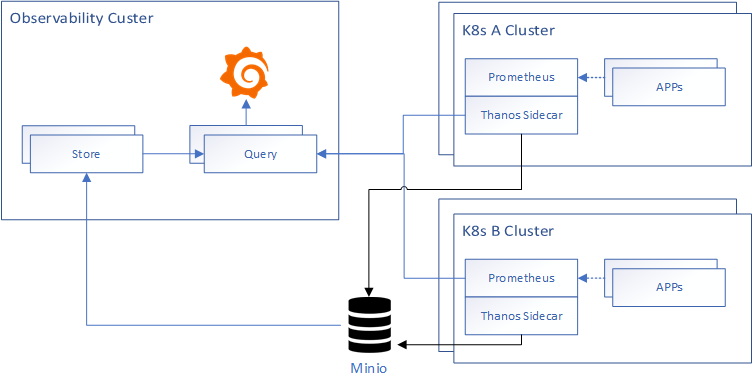
The deployment architecture diagram for this article is as follows:

Object Storage
thanos currently supports object storage services from most cloud vendors, please refer to thanos object storage .This article uses minio instead of S3 object storage.To facilitate the installation of minio in the Observability cluster.
Write Minio parameter configuration file minio.yaml:
mode: distributed
accessKey: "AKIAIOSFODNN7EXAMPLE"
secretKey: "wJalrXUtnFEMI/K7MDENG/bPxRfiCYEXAMPLEKEY"
persistence:
    enabled: true
    storageClass: nfs-provisioner
ingress:
    enabled: true
    path: /
    hosts:
    - minio.example.choerodon.io
Execute the installation command:
helm install c7n/minio \
    -f minio.yaml \
    --version 5.0.4 \
    --name minio \
    --namespace monitoring
Log in to minio to create a thanos bucket.
Create a storage secret in each cluster.
-
The configuration file thanos-storage-minio.yaml.
type: s3 config: bucket: thanos endpoint: minio.example.choerodon.io access_key: AKIAIOSFODNN7EXAMPLE secret_key: wJalrXUtnFEMI/K7MDENG/bPxRfiCYEXAMPLEKEY insecure: true signature_version2: false -
Create storage secret:
kubectl -n monitoring create secret generic thanos-objectstorage --from-file=thanos.yaml=thanos-storage-minio.yaml
Observability Cluster Install Promethues-operator
Promethues-operator installed in the Observability cluster requires that grafana be installed and that the Query component whose default datasource is Thanos be modified.The Observability-prometheus-operator.yaml configuration file is as follows:
grafana:
  persistence:
    enabled: true
    storageClassName: nfs-provisioner
  ingress:
    enabled: true
    hosts:
    - grafana.example.choerodon.io
  additionalDataSources:
    - name: Prometheus
      type: prometheus
      url: http://thanos-querier:9090/
      access: proxy
      isDefault: true
  sidecar:
    datasources:
      defaultDatasourceEnabled: false
prometheus:
  retention: 12h
  prometheusSpec:
    externalLabels:
      cluster: observe # Add a cluster tag to distinguish clusters
    storageSpec:
      volumeClaimTemplate:
        spec:
          storageClassName: nfs-provisioner
          resources:
            requests:
              storage: 10Gi
    thanos:
      baseImage: quay.io/thanos/thanos
      version: v0.10.1
      objectStorageConfig:
        key: thanos.yaml
        name: thanos-objectstorage
Install prometheus-operator cluster
helm install c7n/prometheus-operator \
    -f Observability-prometheus-operator.yaml \
    --name prometheus-operator \
    --version 8.5.8 \
    --namespace monitoring
A\B Cluster Installation Promethues-operator
Only prometheus-related components need to be installed in the A\B cluster. grafana, alertmanager and other components no longer need to be installed. The configuration file proemtheus-operator.yaml is as follows:
alertmanager:
  enabled: false

grafana:
  enabled: false

prometheus:
  retention: 12h
  prometheusSpec:
    externalLabels:
      cluster: a-cluster # Add a cluster tag to distinguish clusters
    storageSpec:
      volumeClaimTemplate:
        spec:
          storageClassName: nfs-provisioner
          resources:
            requests:
              storage: 10Gi
    thanos:
      baseImage: quay.io/thanos/thanos
      version: v0.10.1
      objectStorageConfig:
        key: thanos.yaml
        name: thanos-objectstorage
Install prometheus-operator cluster
helm install c7n/prometheus-operator \
    -f prometheus-operator.yaml \
    --name prometheus-operator \
    --version 8.5.8 \
    --namespace monitoring
Create subdomain names for Thanos SideCar that point to cluster A/B, respectively
thanos-a.example.choerodon.io
thanos-b.example.choerodon.io
Create ingress rules with Cluster A as an example
apiVersion: v1
kind: Service
metadata:
  labels:
    app: prometheus
  name: thanos-sidecar-a
spec:
  ports:
    - port: 10901
      protocol: TCP
      targetPort: grpc
      name: grpc
      nodePort: 30901
  selector:
    statefulset.kubernetes.io/pod-name: prometheus-prometheus-operator-prometheus-0
  type: NodePort
---
apiVersion: extensions/v1beta1
kind: Ingress
metadata:
  annotations:
    nginx.ingress.kubernetes.io/ssl-redirect: "true"
    nginx.ingress.kubernetes.io/backend-protocol: "GRPC"
  labels:
    app: prometheus
  name: thanos-sidecar-0
spec:
  rules:
  - host: thanos-a.example.choerodon.io
    http:
      paths:
      - backend:
          serviceName: thanos-sidecar-a
          servicePort: grpc
Observability Cluster Installation thanos
Use kube-thanos Install Thanos.
Install the required software tools:
$ yum install -y golang
$ go get github.com/jsonnet-bundler/jsonnet-bundler/cmd/jb
$ go get github.com/brancz/gojsontoyaml
$ go get github.com/google/go-jsonnet/cmd/jsonnet
Install kube-thanos using jsonnet-bundler
$ mkdir my-kube-thanos; cd my-kube-thanos
$ jb init  # Creates the initial/empty `jsonnetfile.json`
# Install the kube-thanos dependency
$ jb install github.com/thanos-io/kube-thanos/jsonnet/kube-thanos@master # Creates `vendor/` & `jsonnetfile.lock.json`, and fills in `jsonnetfile.json`
Update kube-thanos dependencies
$ jb update
Create example.jsonnet
local k = import 'ksonnet/ksonnet.beta.4/k.libsonnet';
local sts = k.apps.v1.statefulSet;
local deployment = k.apps.v1.deployment;
local t = (import 'kube-thanos/thanos.libsonnet');

local commonConfig = {
  config+:: {
    local cfg = self,
    namespace: 'monitoring',
    version: 'v0.10.1',
    image: 'quay.io/thanos/thanos:' + cfg.version,
    objectStorageConfig: {
      name: 'thanos-objectstorage',
      key: 'thanos.yaml',
    },
    volumeClaimTemplate: {
      spec: {
        accessModes: ['ReadWriteOnce'],
        storageClassName: ''
        resources: {
          requests: {
            storage: '10Gi',
          },
        },
      },
    },
  },
};

local s = t.store + t.store.withVolumeClaimTemplate + t.store.withServiceMonitor + commonConfig + {
  config+:: {
    name: 'thanos-store',
    replicas: 1,
  },
};

local q = t.query + t.query.withServiceMonitor + commonConfig + {
  config+:: {
    name: 'thanos-query',
    replicas: 1,
    stores: [
      'dnssrv+_grpc._tcp.%s.%s.svc.cluster.local' % [service.metadata.name, service.metadata.namespace]
      for service in [s.service]
    ],
    replicaLabels: ['prometheus_replica', 'rule_replica'],
  },
};


{ ['thanos-store-' + name]: s[name] for name in std.objectFields(s) } +
{ ['thanos-query-' + name]: q[name] for name in std.objectFields(q) }
Establish build.sh
#!/usr/bin/env bash

# This script uses arg $1 (name of *.jsonnet file to use) to generate the manifests/*.yaml files.

set -e
set -x
# only exit with zero if all commands of the pipeline exit successfully
set -o pipefail

# Make sure to start with a clean 'manifests' dir
rm -rf manifests
mkdir manifests

# optional, but we would like to generate yaml, not json
jsonnet -J vendor -m manifests "${1-example.jsonnet}" | xargs -I{} sh -c 'cat {} | gojsontoyaml > {}.yaml; rm -f {}' -- {}

# The following script generates all components, mostly used for testing

rm -rf examples/all/manifests
mkdir -p examples/all/manifests

jsonnet -J vendor -m examples/all/manifests "${1-all.jsonnet}" | xargs -I{} sh -c 'cat {} | gojsontoyaml > {}.yaml; rm -f {}' -- {}
Create K8S resource file by executing the following command
$ ./build.sh example.jsonnet
There are two places to modify the generated resource file
$ vim manifests/thanos-store-statefulSet.yaml
------------------------------------------------------
    spec:
      containers:
      - args:
        - store
        - --data-dir=/var/thanos/store
        - --grpc-address=0.0.0.0:10901
        - --http-address=0.0.0.0:10902
        - --objstore.config=$(OBJSTORE_CONFIG)
        # - --experimental.enable-index-header # Comment out this extra line
        env:

$ vim manifests/thanos-query-deployment.yaml
------------------------------------------------------
      containers:
      - args:
        - query
        - --grpc-address=0.0.0.0:10901
        - --http-address=0.0.0.0:9090
        - --query.replica-label=prometheus_replica
        - --query.replica-label=rule_replica
        - --store=dnssrv+_grpc._tcp.thanos-store.monitoring.svc.cluster.local
        # Add Store API for this and A/B clusters
        - --store=dnssrv+_grpc._tcp.prometheus-operated.monitoring.svc.cluster.local
        - --store=dns+thanos-a.example.choerodon.io:30901
        - --store=dns+thanos-b.example.choerodon.io:30901
Create Thanos
$ kubectl create -f manifests/
See if Thanos Query is working through port forwarding
$ kubectl port-forward svc/thanos-query 9090:9090 -n monitoring

Visit now http://grafana.example.choerodon.io You can view monitoring information for multiple clusters.

summary
The above steps complete the installation of Prometheus multi-cluster monitoring using Thanos, which has long-term storage capabilities and allows you to view monitoring information across clusters.
About Pork Tooth*
Choerodon Porcine Tooth* As an agile full-link technology platform for open-source multi-cloud applications, it is based on open-source technologies such as Kubernetes, Istio, knative, Gitlab, Spring Cloud to achieve the integration of local and cloud environments, and to achieve the consistency of enterprise multi-cloud/hybrid Cloud Application environments.Platforms help organize teams to complete software life cycle management by providing capabilities such as lean agility, continuous delivery, container environments, micro services, DevOps, and so on, to deliver more stable software faster and more frequently.
Choerodon Pork*Teeth v0.21 has been released. Welcome to install/upgrade.
-
Installation documentation: http://choerodon.io/zh/docs/installation-configuration/steps/
-
Upgrade Document: http://choerodon.io/zh/docs/installation-configuration/update/0.20-to-0.21/
For more details, see Release Notes and Official Web.
You can also learn about the latest developments, product characteristics, and community contributions of pork toothfish through the following community*
- Official website: http://choerodon.io
- Forum: http://forum.choerodon.io
- Github: https://github.com/choerodon
Welcome to the Choerodon Pork*Tooth Community to create an open ecological platform for enterprise digital services.
This article is from Choerodon Pork-toothed Fish Community*Yidaqiang.