How to check the mean square error to judge whether the prediction result is correct? (case: linear regression, random forest California house price data set)
Why use the mean square error? Can't the previous accuracy?
Because the results of regression model are continuous variables, it is impossible to judge directly by right or wrong. However, the difference between the predicted value and the real value can be used to judge the advantages and disadvantages of the model. The smaller the difference, the better the model.
The formula for measuring the difference can be written as follows:

Where m represents the number of features, i represents the number of samples, Represents the predicted value; This formula is called mean square error and is called mean in the metrics module of sklearn_ squared_ error; cross_val_score is neg in score_ mean_squared_error, expressed as a negative number.
Case: MSE evaluation of linear regression model_ California house price data set
from sklearn.metrics import mean_squared_error
mse_metrics=mean_squared_error(y_hat,y_test) # Returns the mean square error, the smaller the better
print(mse_metrics)
# 0.5511198138984461
mse_metrics/(y_test.mean())
# 0.26678247569102054

from sklearn.model_selection import cross_val_score
mse_cvs=cross_val_score(model,X_test,y_test
                        ,cv=10
                        ,scoring='neg_mean_squared_error'
                       ).mean()
# Returns the mean square error due to X_test has an abnormal value, resulting in a large mean square error if the data is selected in cross validation
print(mse_cvs)
# -4.583931708384997
mse_cvs/(y_test.mean())
# -2.2189596866623678
# Compared with random forest, the result of mean square error is more stable
from sklearn.ensemble import RandomForestRegressor
model_rf=RandomForestRegressor().fit(X_train,y_train)
y_hat_rf=model_rf.predict(X_test)
print(mean_squared_error(y_hat_rf,y_test))
# 0.24656335621845812
print(cross_val_score(model_rf,X_test,y_test
,cv=10
,scoring='neg_mean_squared_error'
).mean())
# -0.3152072055910439 # It's negative, but it's actually positive
Supplement:
It can also be expressed by MAE (absolute mean error), and the formula is:

Mean in metrics_ absolute_ error; cross_ val_ Neg in score_ mean_absolute_error.
How to evaluate the distribution of data? What is the difference with MSE?
The formula of mean square error MSE is:

According to the formula, MSE measures the square sum of the difference between the real value and the predicted value, divided by m.
Because it needs to be divided by m, the difference between the real value and the predicted value may be masked to some extent. For example, some real values are completely consistent with the predicted values; On the other hand, the difference between the real value and the predicted value is very large. After averaging, the part with great difference will not be reflected by MSE.
This is because although MSE can reflect the difference of data, it can not reflect the distribution of data.
The index to solve this problem is R^2, and its formula is:

Where, sum of squares of residuals: ,
, Is the mean value;
 It can be understood that 1 - information not captured by the model / information carried by the model; The lower the information the model does not capture, the better, so
 The closer to 1, the better the model effect.
The application cases in sklearn are as follows (case: linear regression model) Evaluation California house price data set) :
# Application of R^2 in sklearn
from sklearn.metrics import r2_score
r2_score(y_true=y_test,y_pred=y_hat)
# 0.5874855472168157

from sklearn.model_selection import cross_val_score
cross_val_score(model,X_test,y_test,cv=5,scoring='r2')
# -1.9878822659956534
# array([-12.34077988,   0.60497249,   0.60384174,   0.5977602 ,
         0.59479412])

# Also due to X_test has an abnormal value, so r^2 of - 12 appears
From the above case, There will be negative numbers. How should we understand this situation?
go back to The formula,
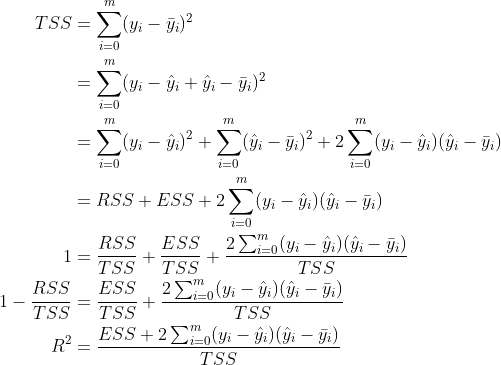
 Also known as the sum of squares of total deviations (TSS), so
 The formula is:

The formula of TSS can be deduced as follows:

(the step where the middle left becomes 1 is because the left and right are divided by TSS at the same time)
Because ESS and TSS are positive numbers, when When it is negative,
 Is negative. This may be caused by the large difference between the predicted value and the real value.
When the model fitting effect is very poor, it will appear In the case of negative, the replacement model should be considered.