In the object detection of deep learning, we need a CSV file to store the file of our training set picture and the position coordinates of the corresponding object's boundingbox in the picture. Today I'll teach you how to generate python code for CSV.
First, you need to generate the GT graph of training data, that is, the corresponding position of the bounding box of the object in the training original graph is transformed into a white square and placed in the pure black graph.
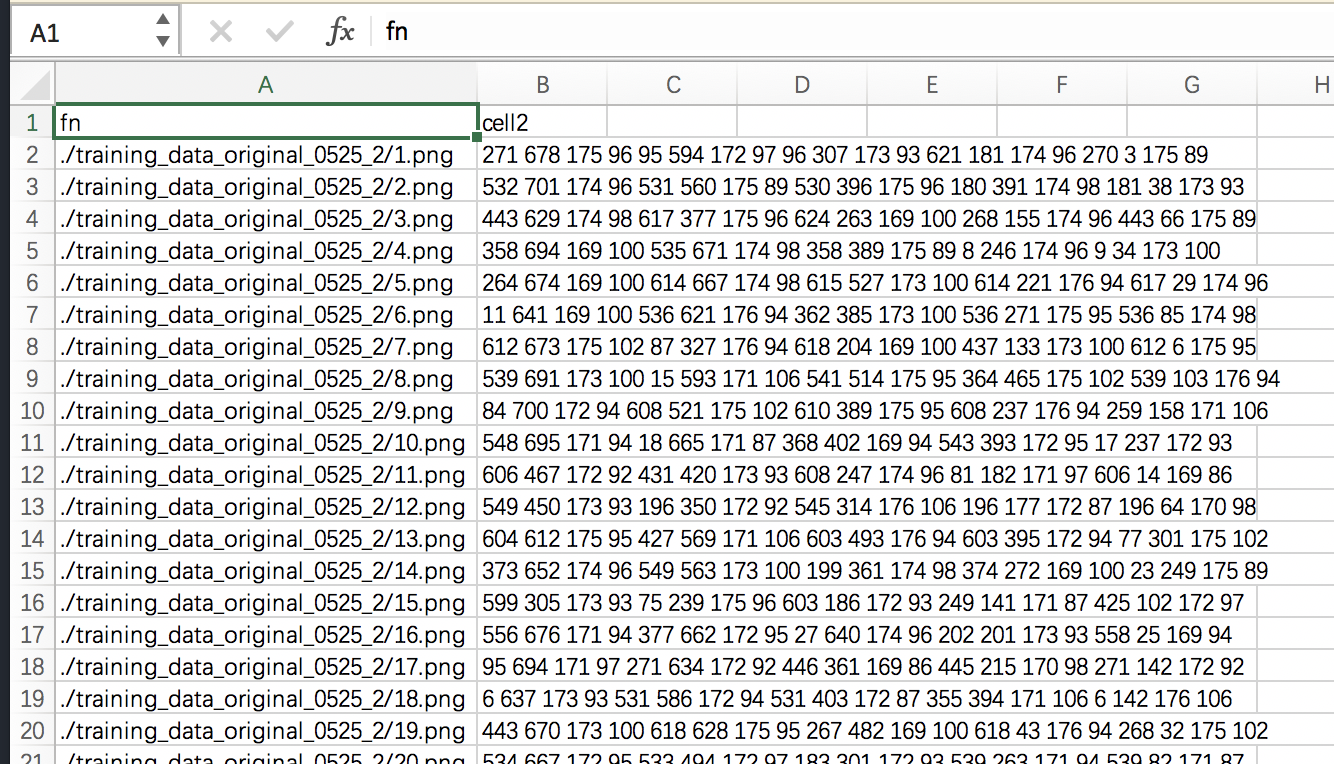
This code can be put into the path of the original image and the path of the GT image. The final generated CSV file is the location, size and coordinates of the original image path + boundingbox.
Import various libraries and read and process pictures
import cv2
import numpy as np
import pandas as pd
import glob
import csv
import os
import pdb
import natsort
#Image reading and preprocessing
#path to gt image folder
gt_image_folder = 'training_data_gt_0525_4/'
gt_images = glob.glob(gt_image_folder + '*.jpg') + glob.glob(gt_image_folder + '*.png') +  glob.glob(gt_image_folder + '*.jpeg') + glob.glob(gt_image_folder + '*.JPEG')
 #set name of the label
label_name = 'cell2'
gt_images = natsort.natsorted(gt_images)
Generate Boundingbox and convert to CSV dictionary format
bbox_directory = 'bbox_matlab_cell2_train_0525_4'
os.makedirs(bbox_directory,exist_ok=True)
#training_path = 'original/' #Training data file path
training_path = './training_data_original_0525_4/' #Training data file path

new_dict = {'fn':[],label_name:[]}

for j,i in enumerate(gt_images):
        img = cv2.imread(i)
        ret,thresh = cv2.threshold(cv2.cvtColor(img, cv2.COLOR_RGB2GRAY),127,255,cv2.THRESH_BINARY)
        contours,hier = cv2.findContours(thresh,cv2.RETR_TREE,cv2.CHAIN_APPROX_SIMPLE)
        bbox_list = []
        x = None
        for c in contours:
            x,y,w,h = cv2.boundingRect(c)
            #pdb.set_trace()
            #only keep large boxes or 0 0 0 0 (negative example) boxes

            if w>1 and w>1 : #suppress small bounding boxes (optional)
                #bbox_list.extend([x,y,x+w-1,y+h-1])
                bbox_list.extend([x+1,y+1,w,h]) #MATLAB convention: start from 1 instead of 0
                cv2.rectangle(img,(x,y),(x+w-1,y+h-1),(0,255,0),1)
            else:
                continue
        #new_dict.setdefault('fn', []).append(i.replace('.png','.jpeg').replace('\\','/').replace(gt_image_folder,training_path))
        if bbox_list: #remove gt files that do not contain any bboxes
            new_dict.setdefault('fn', []).append(training_path+i.split('/')[1].split('_')[0]+'.png')
            new_dict.setdefault(label_name, []).append(' '.join (str(p) for p in bbox_list))
            #draw bounding boxes on gt images
            cv2.imwrite('{}/{}_BBox.png'.format(bbox_directory,j),img)
            #print (x,y,w,h)
            print('writing {}/{}_BBox.png...'.format(bbox_directory,j))
        else:
            #output 0,0,0,0 for empty image (negative training samples)
            bbox_list.extend([1,1,1,1])
            #Here is to put the path of the original image into CSV after processing.
            new_dict.setdefault('fn', []).append(training_path+i.split('/')[1].split('_')[0]+'.png')
            new_dict.setdefault(label_name, []).append(' '.join (str(p) for p in bbox_list))
Convert from dictionary format to CSV file
df = pd.DataFrame(new_dict, columns=['fn',label_name])
df.to_csv('train_cell2.csv', index=False) #change the name of the output .csv file
Screenshot of generated CSV file