In arcgis for js, it is not difficult to draw a circle. Small ones can use SimpleMarkerSymbol, "style": "esriSMSCircle";
If it's big, just a new Circle
But what if it's something like a typhoon? 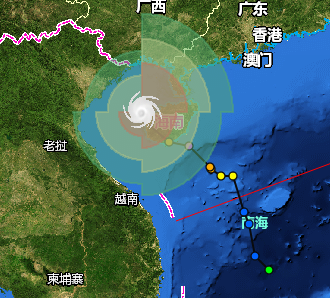
It looks like a circle but not a circle. How to draw?
The answer is to draw polygons. The wind circle shown in the figure is exactly three polygons. In fact, the so-called circle is not the result of infinite approximation of polygons? It's like calculus says that?
The principle of drawing typhoon wind circle is as follows: take the center of the circle as the origin, take the true north direction as 0 degree, draw points clockwise, 1 degree as 1 point, and connect them into a line, and finally return to the true north direction to form a closed polygon; then fill it. The radius of typhoon can be divided into four directions: Northeast, Southeast, southwest and northwest. The distance from each direction to the center of the circle may be different, so there are four zigzag wind circles.
The code is as follows:
function getAirRing(c, center, index) {//Wind circle; level wind series, center origin
    var arColor;
    switch (c.level) {
        case 7: arColor = [83, 168, 113]; break;//7-Stage wind ring
        case 10: arColor = [175, 192, 130]; break;
        case 12: arColor = [185, 121, 96]; break;
        default: arColor = [83, 168, 113]; break;
    }

    //Work out all the points
    var points = new Array();
    getPoints(center, c.EN, 0);//Northeast
    getPoints(center, c.ES, 90);
    getPoints(center, c.WS, 180);
    getPoints(center, c.WN, 270);
    points[points.length] = points[0];//Head tail connection

    //Set fill symbol
    var bColor = arColor; bColor.push(0.5);//transparency
    var sfl = new esri.symbol.SimpleFillSymbol(
        esri.symbol.SimpleFillSymbol.STYLE_SOLID,
        new esri.symbol.SimpleLineSymbol(
            esri.symbol.SimpleLineSymbol.STYLE_SOLID,
            new dojo.Color(arColor),
            2
        ),
        new dojo.Color(bColor)
    );

    //Polygon points
    var polygon = new esri.geometry.Polygon(points);
    //And fill it with various wind circle data
    var gr = new esri.Graphic(polygon, sfl,
        {
            "level": c.level, "wn": c.WN, "en": c.EN, "es": c.ES, "ws": c.WS,
            "attrtype": "airRing", "index": index,
        },
        new esri.InfoTemplate("Wind coil:${level}", tplAirRing));
    return gr;

    //It's copied by this method, 1 degree and 1 point
    function getPoints(center, cradius, startAngle) {
        var radius = cradius / 100;
        var pointNum = 90;
        var endAngle = startAngle + 90;

        var sin;
        var cos;
        var x;
        var y;
        var angle;

        for (var i = 0; i <= pointNum; i++) {
            angle = startAngle + (endAngle - startAngle) * i
                / pointNum;
            sin = Math.sin(angle * Math.PI / 180);
            cos = Math.cos(angle * Math.PI / 180);
            x = center[0] + radius * sin;
            y = center[1] + radius * cos;
            points.push([x, y]);
        }
    }
}