1.What -- what is the Gantt chart
Gantt Chart, also known as bar chart and bar chart, was proposed by Henry Gantt in 1910 to show the internal relationship between project, progress and other time-related system progress over time. Among them, the horizontal axis represents the time, the vertical axis represents the project, and the Gantt Chart shows the sequence and duration of a specific project through the project list and time scale, which is simple and intuitive.
2.Why -- realization principle
ECharts is an open source visualization library implemented by JavaScript. It provides intuitive, interactive and highly personalized data visualization charts. It provides conventional broken line charts, histogram, scatter charts, pie charts and K-line charts, box charts for statistics, maps, thermal maps and line charts for geographic data visualization, and relationship charts for relational data visualization treemap, sunrise chart, parallel coordinates of multidimensional data visualization, funnel chart and dashboard for BI, and support the mixing and matching between graphs. However, there is no Gantt chart. After careful observation, it is found that the Gantt chart is similar to the histogram in the composition of graphics. The data are presented in strips, but the starting point is different. Can you change the starting point through the superposition of two data to draw the Gantt chart?
Two important properties of ECharts stack and z are used here.
Stack is used for data stacking. After the series on the same category axis are configured with the same stack, the values of the latter series will be added to the values of the previous series and stacked on the same strip of data. When the stacks are different, the values of the latter series on the same category axis will be displayed in another row / column.
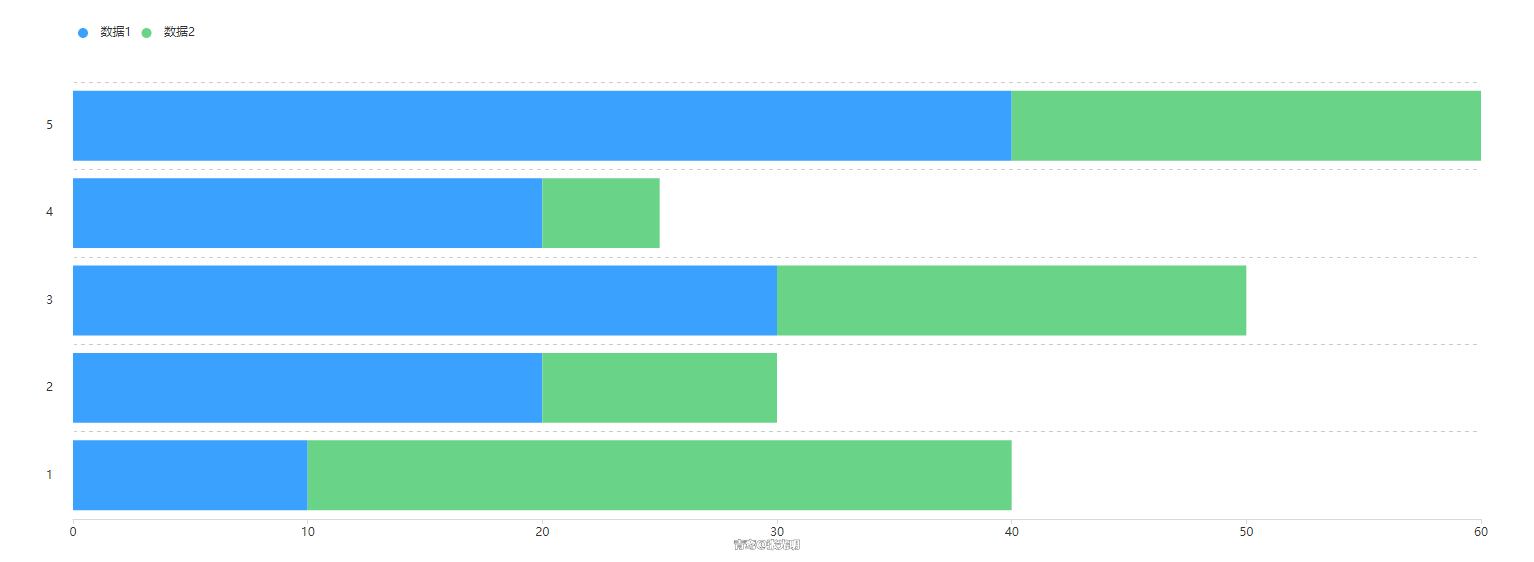
series: [
          {
            name: "Data 1",
            type: "bar",
            stack: "total",
            data: [10, 20, 30, 20, 40]
          },
          {
            name: "Data 2",
            type: "bar",
            stack: "total",
            data: [30, 10, 20, 5, 20]
          }
] 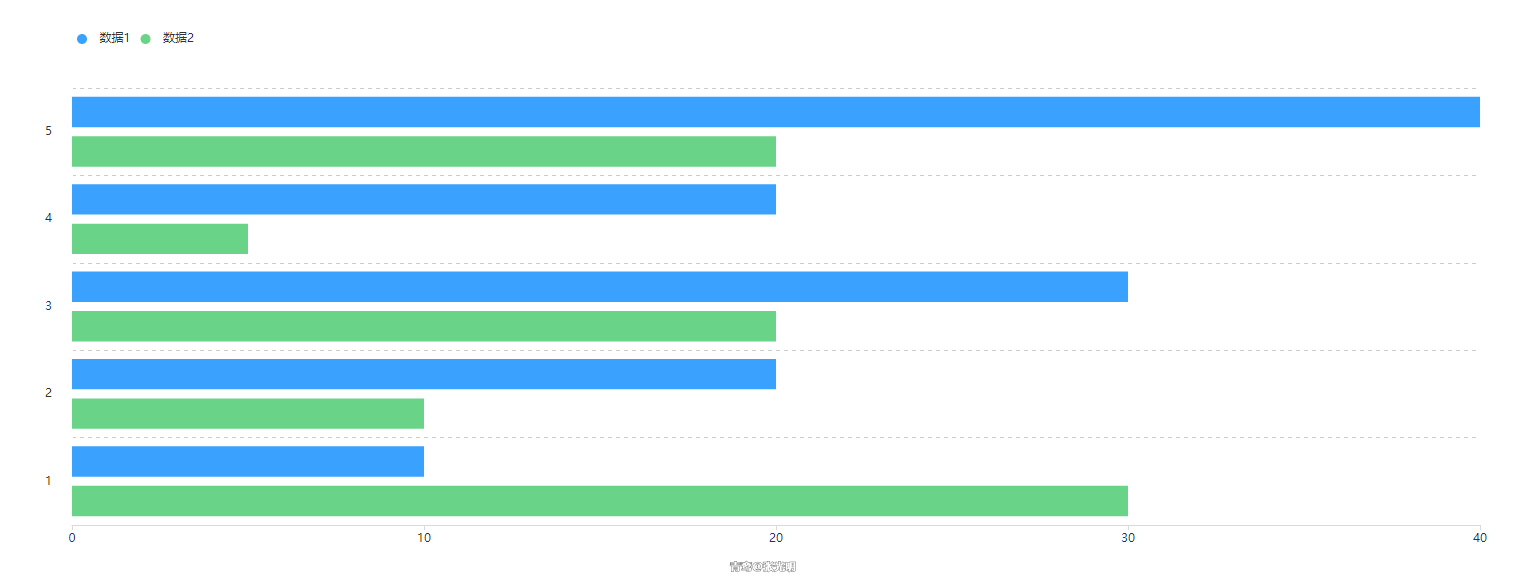
series: [
          {
            name: "Data 1",
            type: "bar",
            stack: "Total 1",
            data: [10, 20, 30, 20, 40]
          },
          {
            name: "Data 2",
            type: "bar",
            stack: "Total 2",
            data: [30, 10, 20, 5, 20]
          }
        ]
z is used to control the stacking order of graphic display. Like the z-index attribute in css, elements with higher stacking order will always be in front of elements with lower stacking order, that is, those with small z values will be overwritten by those with large z values.
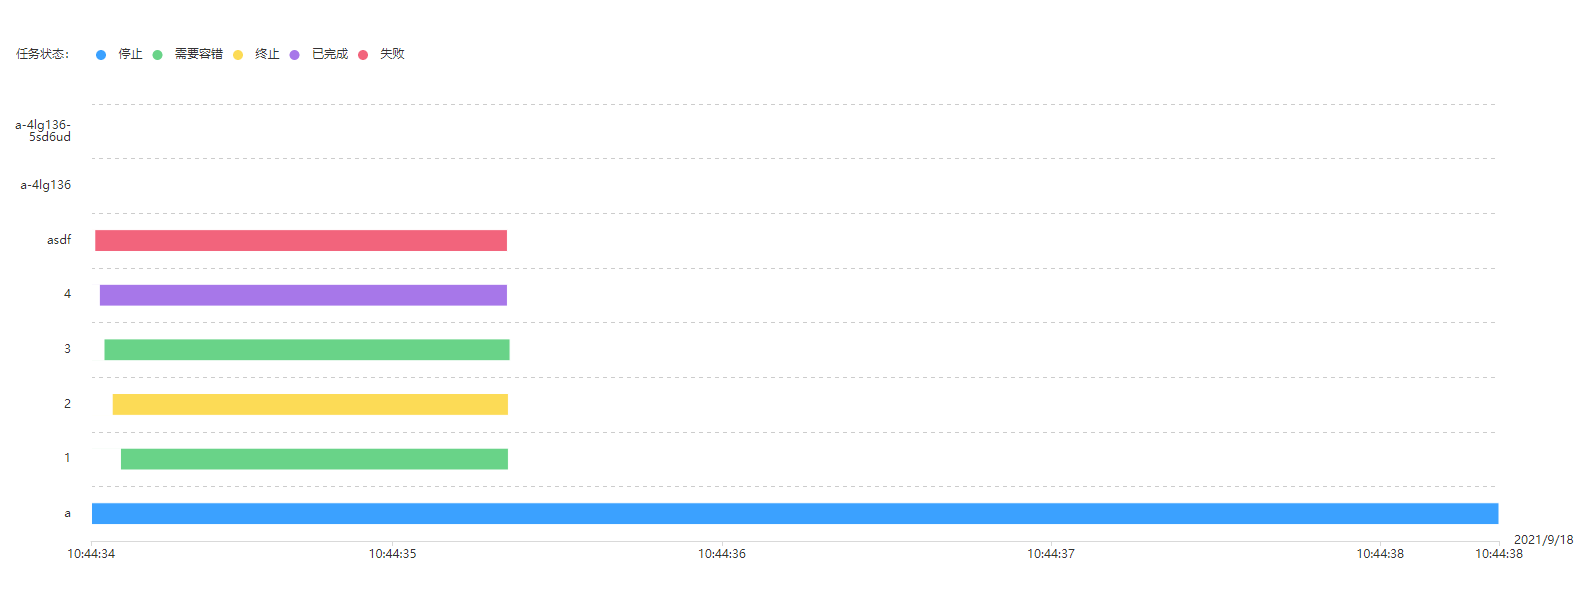
3.How -- how to realize
With the above knowledge, let's take a look at the data format transmitted from the back-end and adapt to the specific situation.
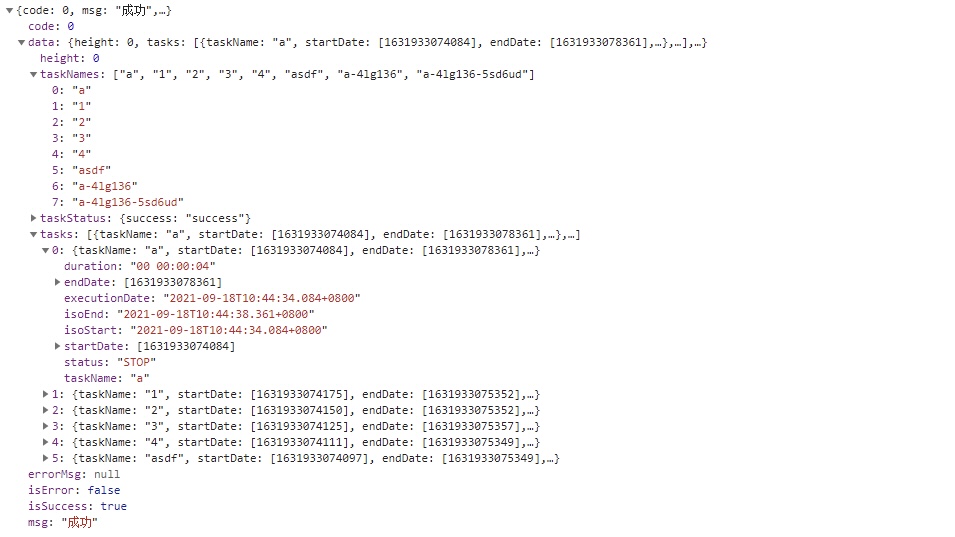
It can be seen that this data contains 8 tasks, each task has only one state, and the start time and end time of the state are also given. Then you only need to set the stack to be the same, set the z value of the start time to be greater than the end time, and overwrite the end time with the start time to achieve the Gantt chart effect.
for (let item = 0; item < res.data.tasks.length; item++) {
        let tasksStatus = res.data.tasks[item].status;
        tasksStatus =
          tasksStatus === "SUBMITTED_SUCCESS"
            ? "Submitted successfully"
            : tasksStatus === "RUNNING_ EXECUTION"
            ? "In operation"
            : tasksStatus === "READY_ PAUSE"
            ? "Ready to pause"
            : tasksStatus === "PAUSE"
            ? "suspend"
            : tasksStatus === "READY_STOP"
            ? "Ready to stop"
            : tasksStatus === "STOP"
            ? "stop it"
            : tasksStatus === "FAILURE"
            ? "fail"
            : tasksStatus === "SUCCESS"
            ? "success"
            : tasksStatus === "NEED_FAULT_TOLERANCE"
            ? "Fault tolerance required"
            : tasksStatus === "KILL"
            ? "termination"
            : tasksStatus === "WAITING_THREAD"
            ? "Wait thread"
            : tasksStatus === "WAITTING_LIVE"
            ? "Wait for dependent nodes to complete"
            : "Unknown state";
        this.legendData[item] = tasksStatus;
        this.startDate = [];
        this.endDate = [];
        this.startDate[item] = new Date(res.data.tasks[item].startDate[0]);
        this.endDate[item] = new Date(res.data.tasks[item].endDate[0]);
        this.seriesData.push({
          // Transmit two data at a time, and overwrite the end time with the start time
          name: this.legendData[item],
          type: "bar",
          cursor: "default",
          barWidth: "40%",
          stack: "Total 1",
        //   zlevel: -1,
          itemStyle: {
            normal: {
              borderColor: "#fff"
            }
          },
          data: this.endDate
        });
        this.seriesData.push({
          name: this.legendData[item],
          type: "bar",
          cursor: "default",
          barWidth: "40%",
          stack: "Total 1", // Data stacking: after the series on the same category axis are configured with the same stack value, the values of the latter series will be added to the values of the previous series
        //   zlevel: -1, / / used for Canvas layering. Graphs with different zlevel values will be placed in different Canvas
          z: 3, // Control the sequence of the graph. The one with small z value will be overwritten by the one with large z value. z has lower priority than zlevel, and no new Canvas will be created
          itemStyle: {
            normal: {
              color: "#fff"
            }
          },
          data: this.startDate
        });
      }
      this.seriesData = Object.values(this.seriesData); // Object to array
      let tempDate = new Date(res.data.tasks[0].startDate[0]).toLocaleString();
      // Take the start timestamp of the first task and convert it into date format, such as 10:44:34 a.m. on September 18, 2021
      this.xDate = tempDate.substring(0, tempDate.indexOf(" ")); // After removing the blank space, only 2021 / 9 / 18 is reserved
      this.myChart.setOption({
        color: ["#3ba1ff", "#69d388", "#fcdb56", "#a777e9", "#f2647c"],
        backgroundColor: "#fff",
        title: {
          text: "Task status:",
          textStyle: {
            fontSize: 12,
            fontWeight: "normal"
          }
        },
        legend: {
          data: this.legendData,
          icon: "circle", // The shape of the legend icon
          // The size of the legend icon
          itemWidth: 25,
          itemHeight: 10,
          left: 80
        },
        grid: {
          show: false, // Do not display the outer border of the entire diagram
          right: 80,
          left: 80,
          bottom: 200,
		// containLabel: true
        },
        xAxis: {
          type: "time",
          name: this.xDate,
          axisLabel: {
            color: "#333 "/ axis text color
          },
          nameTextStyle: {
            color: "#333 "/ axis end Title Color
          },
          splitLine: {
            show: false // Do not display gridlines
          },
          axisLine: {
            lineStyle: {
              color: "#d9d9d9 "/ / axis color
            }
          }
        },
        yAxis: {
          splitLine: {
            lineStyle: {
              type: "dashed" // Grid lines are set to dashed lines
            }
          },
          axisTick: {
            show: false // Do not display scale
          },
          axisLine: {
            lineStyle: {
              color: "#fff"
            }
          },
          axisLabel: {
            show: true,
            interval: 0,
            margin: 20,
            color: "#333",
            formatter: function(value) {
              // Wrap names whose y-axis is too long
              if (value.length > 9) {
                value = value.substring(0, 9) +  "\n" + value.substring(9, value.length);
              }
              return value;
            }
          },
          data: res.data.taskNames
        },
        series: this.seriesData
      })