Front end performance indicators, mostly including TTFB, first screen, first interactive time, etc
There are a lot of related articles, so we won't talk about the details here. Please refer to the end of the article
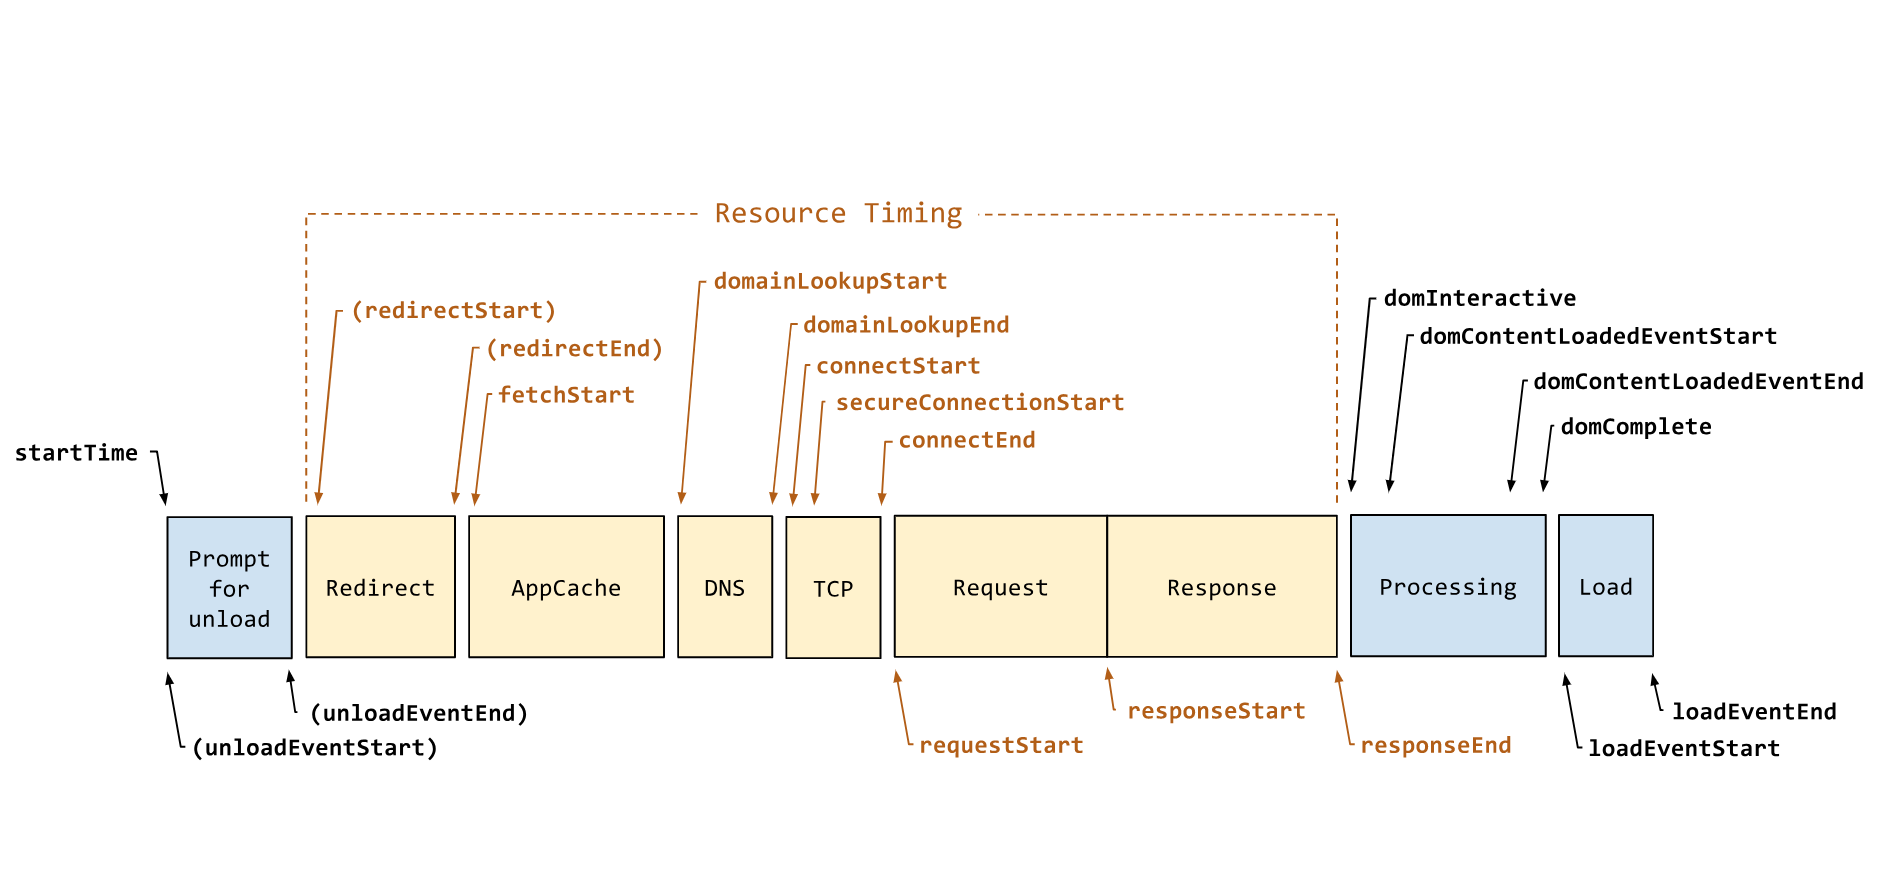
In general, we need to know that the browser (New) provides us with the Performance API. With this property, we can get a series of performance related data
Combined with the significance of each time point, we can calculate the key time-consuming indicators
Look at the picture below
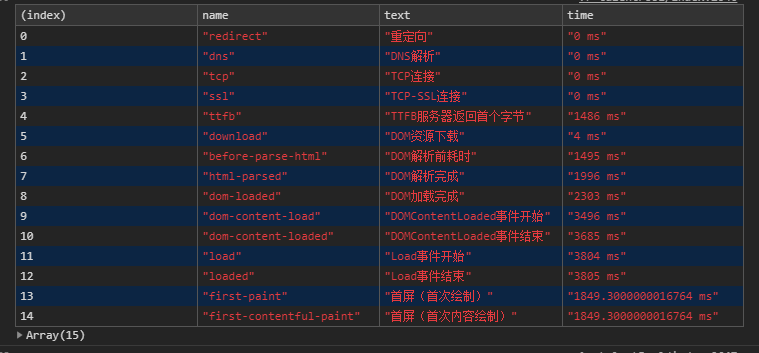
After simple calculation, such information can be obtained
Compared with the Network of DevTools, the data is similar and should be used as a reference
Just report it
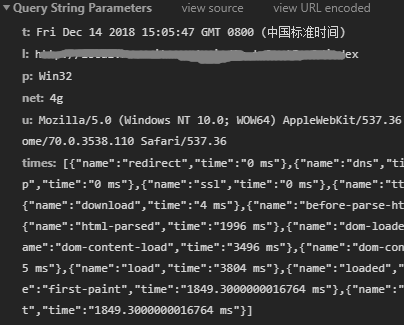
So, how are these indicators calculated? Just look at the code section and the comments
How to calculate these time points varies from person to person. Each person has different versions. As long as they think it is reasonable, it is OK
1 <script> 2 ;(function(window, undefined) { 3 function addEvent(type, fn) { 4 if (window.addEventListener) { 5 window.addEventListener(type, fn, false); 6 } else { 7 window.attachEvent('on' + type, fn); 8 } 9 } 10 11 // load Event triggered monkey to collect relevant data again 12 addEvent('load', getTiming); 13 14 // Shortcut entry 15 window.getTiming = getTiming; 16 17 function getTiming() { 18 // Browser supported API 19 var performance = window.performance; 20 21 if (!performance || !performance.timing) { 22 console.log('Current browser does not support Performance Time API'); 23 return; 24 } 25 26 var timing = performance.timing, 27 timings = { 28 page: [], 29 pageReport: [] 30 }; 31 32 // Set a time-consuming statistics 33 function setPageTiming(name, text, time) { 34 timings.page.push({ 35 name: name, 36 text: text, 37 time: time + ' ms' 38 }); 39 40 timings.pageReport.push({ 41 name: name, 42 time: time + ' ms' 43 }); 44 } 45 46 // Page loading is not complete, loadEventEnd Value may be 0, delay processing required 47 if (timing.loadEventEnd - timing.navigationStart < 0) { 48 console.log('getTiming delay'); 49 setTimeout(getTiming, 1000); 50 return; 51 } 52 53 setPageTiming('redirect', 'redirect', timing.redirectEnd - timing.redirectStart); 54 setPageTiming('dns', 'DNS analysis', timing.domainLookupEnd - timing.domainLookupStart); 55 setPageTiming('tcp', 'TCP Connect', timing.connectEnd - timing.connectStart); 56 setPageTiming('ssl', 'TCP-SSL Connect', !timing.secureConnectionStart ? 0 : timing.connectEnd - timing.secureConnectionStart); 57 setPageTiming('ttfb', 'TTFB Server returns first byte', timing.responseStart - timing.requestStart); 58 setPageTiming('download', 'DOM Resource downloading', timing.responseEnd - timing.responseStart); 59 setPageTiming('before-parse-html', 'DOM Time before parsing', timing.responseEnd - timing.navigationStart); 60 setPageTiming('html-parsed', 'DOM Analytic completion', timing.domInteractive - timing.domLoading); 61 setPageTiming('dom-loaded', 'DOM Load complete', timing.domComplete - timing.domLoading); 62 setPageTiming('dom-content-load', 'DOMContentLoaded Event start', timing.domContentLoadedEventStart - timing.navigationStart); 63 setPageTiming('dom-content-loaded', 'DOMContentLoaded End of event', timing.domContentLoadedEventEnd - timing.navigationStart); 64 setPageTiming('load', 'Load Event start', timing.loadEventStart - timing.navigationStart); 65 setPageTiming('loaded', 'Load End of event', timing.loadEventEnd - timing.navigationStart); 66 67 // The following two items can be obtained directly 68 var paintTiming = { 69 'first-paint': 'First screen (first draw)', 70 'first-contentful-paint': 'First screen (first content drawing)' 71 }; 72 73 performance.getEntriesByType('paint').forEach(function(entry) { 74 if (paintTiming[entry.name]) { 75 setPageTiming(entry.name, paintTiming[entry.name], entry.startTime + entry.duration); 76 } 77 }); 78 79 // The following two indicators are related to requirements and need to be counted in the code according to business requirements 80 // setPageTiming('first-meaningful-paint', 'First screen (effective drawing for the first time)', timing.domInteractive - timing.navigationStart); 81 // setPageTiming('time-to-interactive', 'Interactive time', timing.domInteractive - timing.navigationStart); 82 83 // Summary statistical report 84 if (requestIdleCallback) { 85 requestIdleCallback(function() { 86 report(timings.pageReport); 87 }); 88 } else { 89 setTimeout(function() { 90 report(timings.pageReport); 91 }); 92 } 93 94 function report(data) { 95 data = data || []; 96 97 if (!data.length) { 98 return; 99 } 100 101 (new Image()).src = 'https://a.b.c/d/e?t=' + (new Date()) 102 + '&l=' + location.href 103 + '&p=' + navigator.platform 104 + '&net=' + navigator.connection.effectiveType 105 + '&u=' + navigator.userAgent 106 + '×=' + JSON.stringify(data); 107 } 108 109 console.table(timings.page); 110 console.log(performance.timing); 111 } 112 })(window); 113 </script>
reference material:
User centric performance metrics
2018 front end performance information collection guide you should know