TLDR
- TTI refers to the interactive time point between the user and the UI interface, which cannot be directly detected by the browser API.
- The key indicators of TTI are related to longtask, network status, FMP and quiet window.
- The TTI is comprehensively calculated by using the request agent and the browser MutationObserver.
- It's a good experience to make the home page interactive in 5S.
- Make web pages interactive as soon as possible.
TTI
TTI (Time To Interactive) is used to identify the user's operable time to the interface. Like other Performance indicators, it is used to measure the relevant Performance of the web interface. So far, browsers have provided an api for Performance.timing.domInteractive to measure this metric. But TTI, like other indicators, is a variable. We don't know whether the code acquisition runtime interface can reach the interactive state. Therefore, you still need to get the final result by means of callback. Although we can't use PerformanceOberserver or Performance to obtain this indicator, we need to integrate various APIs to measure it.
definition
First, we clearly define that users can interact, which means that most of the contents of the interface are visible and the interaction is smooth. There is no long-term Caton visually, and the JS of interactive events is loaded and executed. Based on the above points, we can infer that TTI is related to the following indicators:
1. Longtask
Because Javascript is executed in the V8 engine through the event loop single thread call stack, if a task is executed too long, the responding events may wait in the queue for too long. The performance on the interface is that gif pictures or animation cannot be played, and user interaction events cannot respond. The phenomenon is that it feels stuck. This is certainly not an interactive interface.
2. In-flight network
Unfinished network requests: include HTTP requests such as XHR and static resources. The network process is independent of the rendering process and should not block the execution of js. However, these factors are considered as a factor to measure TTI because it has reached the online of TCP channel, blocking the download of XHR or script, and slowing down the rendering and interaction of the interface.
3. Quite window
The idle window period refers to the time when no cumbersome tasks are performed in the network process and render process, that is, two or less ongoing requests and 0 long tasks. Such a period can be defined as an idle period. At any time during this period, users can interact smoothly with the interface. This indicator is the set of the first point and the second point.
4. Fisrt Contentful Paint
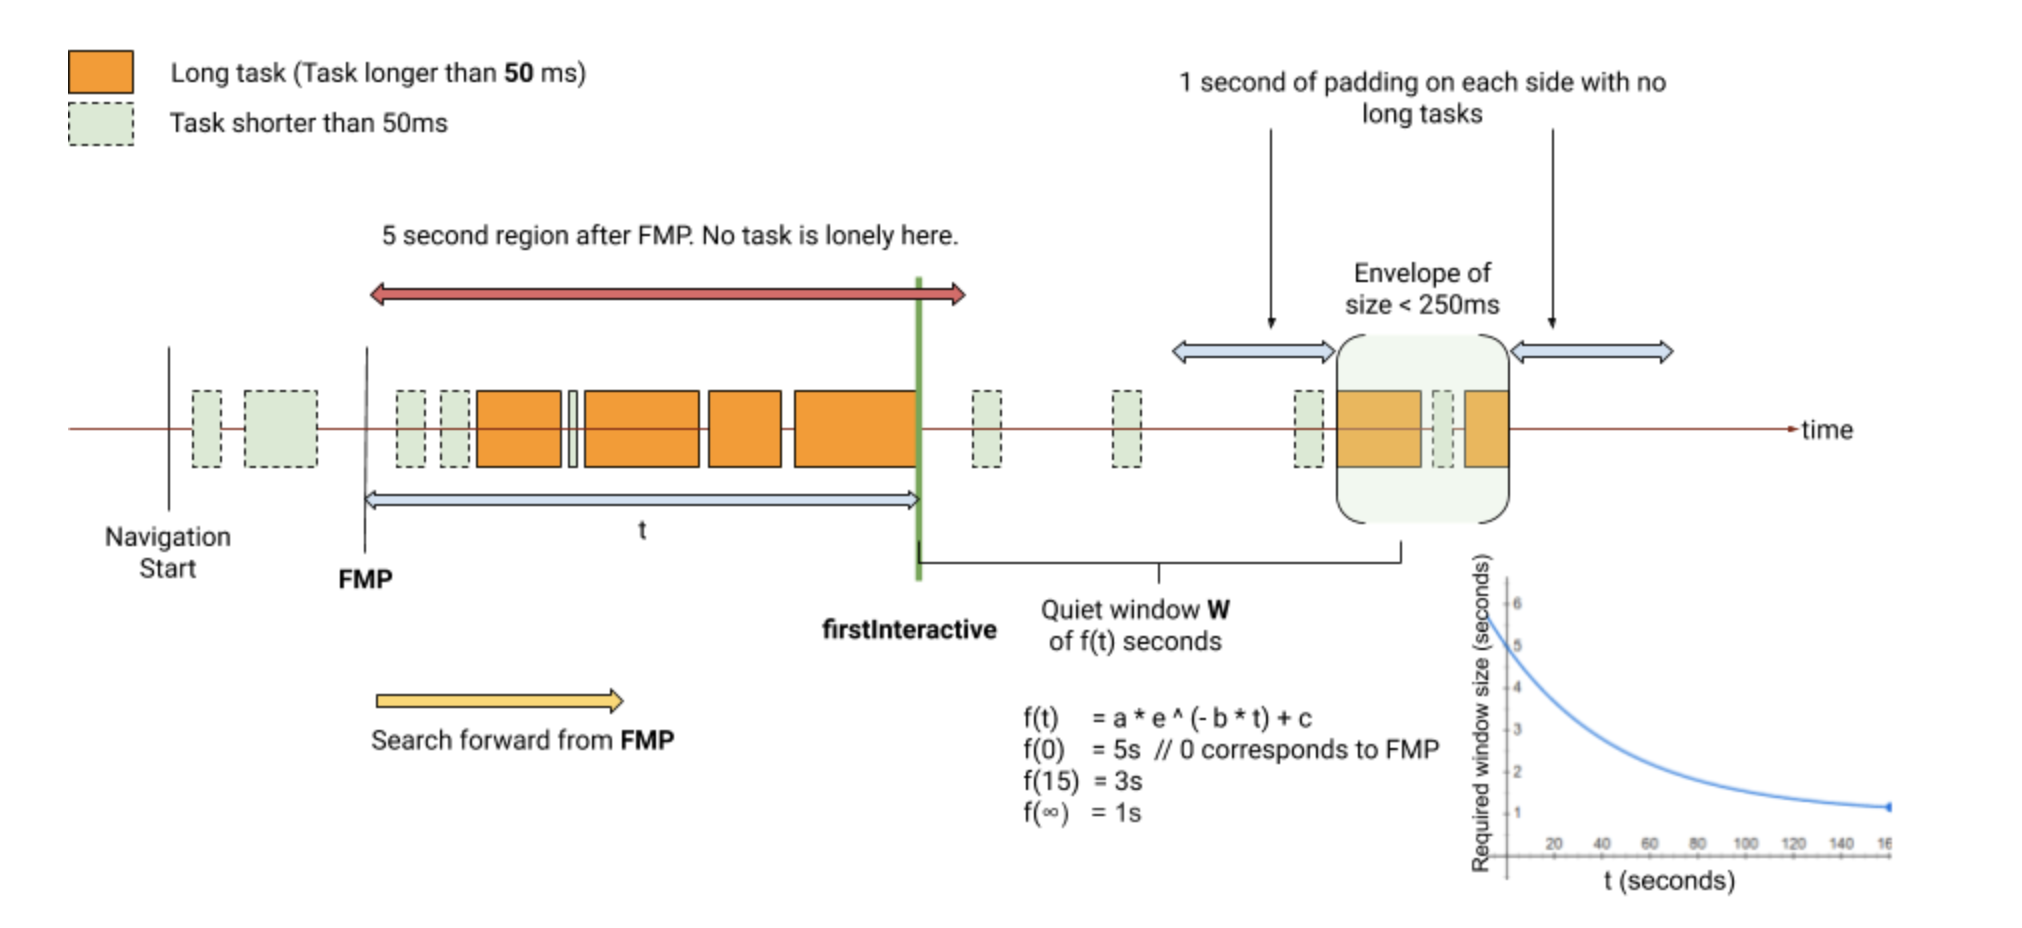
Start listening for long tasks with FCP as the benchmark. Why not use navigationStart as the baseline? Because when the interface is blank, TTI calculation is meaningless even without longtask. Therefore, we should take the visible rendering of the interface as the benchmark. At this time, the user can see the interface and will try to interact with it. If there is no long task, it means that FCP is the time of TTI: that is, the interface can interact. Such an experience is undoubtedly excellent.
Now let's view the calculation model of TTI related indicators through a figure:
realization
With the definition, we can start to implement it in Code:
- Longtask is better implemented. There is a PerformanceOberserver provided by the browser. By passing in the longtask parameter, you can get the execution time and start execution time of a long task after it is completed. We can use the end time of a long task as a mileage node to start or end a state.
//Let's talk about its encapsulation
const Observer = (type: string, callback: HanderPerformanceFn): PerformanceObserver | undefined => {
    try {
        //Judge whether the monitoring of parameter selection is supported
        if (PerformanceObserver.supportedEntryTypes.includes(type)) {
            const observer: PerformanceObserver = new PerformanceObserver(list => {
                list.getEntries().forEach(callback);
            });
            observer.observe({ entryTypes: [type] });
            return observer;
        }
    }catch (ex) {
        return undefined;
    }
}
//Listening for long task end events
Observer('longtask', (longtask: HandlePerformanceLongTask) => {
    //Calculate long task end time
    const longtask = longtask.duration + longtask.startTime;
});
Longtask can listen to the end of long tasks on the main thread. Long tasks refer to those tasks that run for more than 50ms. We can see their existence in the developer tool. The long tasks marked with a red triangle in the upper right corner of the figure below are long tasks.

In general, they can be:
- Script tasks that contain a large number of calculations.
- It takes a long time to draw the interface.
- dom parsing tasks can also take a lot of time.
- Also, bad css code leads to time-consuming style calculation.
Each process in the following figure may produce growth tasks and affect the interface.

Through the API provided by the browser, we can respond to the callback time when a long task ends in the field environment. At this time, the timer starts to count. If there is no new Longtask execution later within the agreed time period, we can define the time point at which the last Longtask ends as. The key is how we measure this time. We generally use 5s, and we will continue to explain the algorithm and improvement during this period later.
- Network monitoring is relatively complex. It needs to monitor the sending and receiving status of HTTP, and the browser itself does not have this api for us. Therefore, in order to monitor the status of all HTTP requests, we must monitor XHR, Fetch methods and static resources through proxy. There are three steps to split it:
- Listen to all xhrs through the proxy XMLHttpRequest.send method:
//send method of proxy XMLHttpRequest object
const proxyFetch = () => {
    const send = XMLHttpRequest.prototype.send;
    XMLHttpRequest.prototype.send = function(...args) {
    //Unique id ID for each request resume
    const requestId = uniqueId++;
    beforeXHRSendCb(requestId);
    this.addEventListener('readystatechange', () => {
        //Status of listening completion
        if (this.readyState === 4) onRequestCompletedCb(requestId);
    });
    return send.apply(this, args);
};
- Listen to all fetch requests through the fetch proxy method. Sometimes applications do not use ajax, but send requests through the new feature of fetch. Therefore, we need to perform proxy listening on him:
function patchFetch(beforeRequestCb, afterRequestCb) {
    const originalFetch = fetch;
    fetch = (...args) => {
        return new Promise((resolve, reject) => {
        //Similarly, we create a unique id for each fetch
        const requestId = uniqueId++;
        beforeRequestCb(requestId);
        originalFetch(...args).then(
            (value) => {
                afterRequestCb(requestId);
                resolve(value);
            },
            (err) => {
                afterRequestCb(err);
                reject(err);
            });
        });
    };
}
With the state control of data requests, the control of resource files is relatively difficult. The resource file does not obtain information from the server through the above methods. Therefore, we need to find another way out. In addition, some browsers provide the interface of MutationObserver. MutationObserver is a new browser feature, which is used to replace the old browser Mutation event types And setTimeout rotation hack. It uses the non blocking task type of micro task to listen for the change set of dom. We can use it here to solve problems. This document It can help you have a rough understanding of it. Now, let's go back to the topic, how to use the MutationObserver interface to listen for the status change of resource requests:
- First, list the static resources to listen to:
    const requestCreatingNodeNames =
        ['img', 'script', 'iframe', 'link', 'audio', 'video', 'source'];
Then, the method of MutationObserver is used to monitor the changes of resources, so as to initially know the changes of current resource status. Later, their completion status is detected through the resource method in PerformanceOberserver.
function subtreeContainsNodeName(nodes, nodeNames) {
    for (const node of nodes) {
        if (nodeNames.includes(node.nodeName.toLowerCase()) ||
            subtreeContainsNodeName(node.children, nodeNames)) {
        return true;
        }
    }
    return false;
}

function observeResourceFetchingMutations(callback): MutationObserver {
    const mutationObserver = new MutationObserver((mutations) => {
    mutations = /** @type {!Array<!MutationRecord>} */ (mutations);
        for (const mutation of mutations) {
            if (mutation.type == 'childList' &&
                //Recursively judge whether the node is the target node
                subtreeContainsNodeName(
                    mutation.addedNodes, requestCreatingNodeNames)) {
                callback(mutation);
            } else if (mutation.type == 'attributes' &&
                requestCreatingNodeNames.includes(
                    mutation.target.tagName.toLowerCase())) {
                callback(mutation);
        }
        }
    });
    //Listen to the entire document
    mutationObserver.observe(document, {
        attributes: true,
        childList: true,
        subtree: true,
        //The attribute href src to listen on contains all static resources
        attributeFilter: ['href', 'src'],
    });

    return mutationObserver;
}
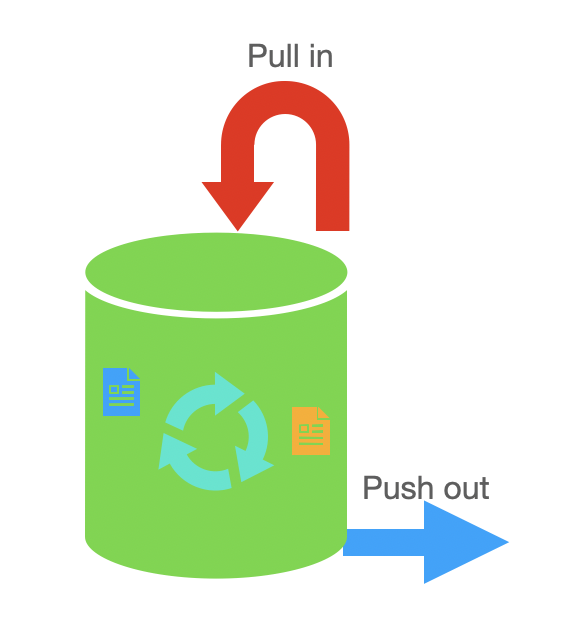
With the method of calculating and listening to http requests, we can create an http resource pool. We compare this resource pool to a pool with a resource ID of 1L. Our purpose is to find such a time point: the water in the pool is just less than 3L and remains below this water level for 5s.
    //Resource pool
    let pool: number[] = [];
    //timer
    let timer: null | number = null;
The inflow and outflow of water in the pool correspond to the beginning and end of resources. We can monitor the beginning and end of resources through the above proxy function. Create an id for each resource.
    //inflow
       poll.push(uintId++);
       if(poll.length < 3)
            timer = setTimeout(() => {
                alert('got it!');
            }, 5000)
        else
            clearTimeout(timer);
    //flow out
       poll = poll.fliter(item => item !== unitId);
        if(poll.length < 3)
            timer = setTimeout(() => {
                alert('got it!');
            }, 5000)
        else
            clearTimeout(timer);
A resource is 1L of water. If the water is less than 3l, we restart a 5s countdown every time. When the water is greater than 3l, we stop the countdown and wait for the next countdown. This is repeated until the time when the water is less than 3L is greater than 5s. Even if we catch a quiet window. Deduce the time of TTI through the empty window period and the end time of the last longtask.
The above is about TTI Implementation of defined code. You can also evaluate the TTI time of your web page locally through lighthouse. lighouse integrates almost all performance indicators in the lab environment, which is much more fragrant than using code.
Evaluation & Optimization
TTI time less than 5s is the best. If FCP is TTI, it is excellent. Of course, your FCP should be fast enough. Some optimization methods provided in the following Google documents also supplement some items.
- Compact script volume with Minify JavaScript
Component tools such as webpack or rollup can automatically help you do these things.
- Preconnect to required origins is generally used when designing multi interface jump. > By setting the configuration in the meta tag, we can connect with the source and target to reduce the query time such as dns.
<link rel='dns-prefetch' href='your-web-site-address' />
- Preload key requests preload resources
It is easy to set the rel attribute of link to preload in meta to prompt the priority of resource loading.
  <!-- Insert code into head In, the browser will load list resources first -->
  <link rel="preload" href="style.css" as="style" />
  <link rel="preload" href="index.js" as="script />
- Reduce the impact of third-party code
If it is impossible to avoid the introduction of third-party scripts, please adopt the npm method, and merge, compress and optimize through the construction tool
-
Minimize critical request depth > use the code split of the build tool to load resources in an inert way and fragment the code. Reasonably arrange the script size required for content rendering.
-
Reduce JavaScript execution time reduces js execution time
We can refer to facebook's upgrade of react and adopt reconciliation to reduce the workload of the main thread.
- Minimize main thread work
Reduce the workload of the main thread. Disperse the amount containing a large number of calculations to a worker and other processes. Or use GUI layered rendering technology. will-change, transfrom: tanslateZ(0).
- Keep request counts low and transfer sizes small.
http1.x has many problems. Upgrade your application to http2, and the multiplexing feature can bring you a qualitative leap. Paying attention to solving the problem of congestion window can also prompt the speed of your application opening.
more
There is also a document on how to detect FI and FCI. This document is more complex than what we mentioned above. I translate it and students in need can check it. In general, the complexity of web scenarios is far from being measurable by indicators and definitions. We should adjust measures to local conditions and evaluate various indicators. You can refer to my article to see what performance evaluation criteria are.
summary
Finally, let's summarize some key points of this article:
- TTI refers to the interactive time between the user and the interface, which cannot be detected directly through the browser api.
- Four indicators affecting TTI, all of which have their own rationality.
- We use JS techniques and DOM listening mechanism provided by the browser to implement a listener of HTTP request status, so as to judge the time of idle window period.
- Finally, we list the measurement methods in lab environment and some methods to optimize it.