
Both WWDC 2016 and 2017 mentioned the principle and performance optimization idea of startup. It can be seen how important startup time is for developers and users. This article talks about how to accurately measure the startup time of App. Startup time consists of two parts: the startup time before main and the startup time after main.
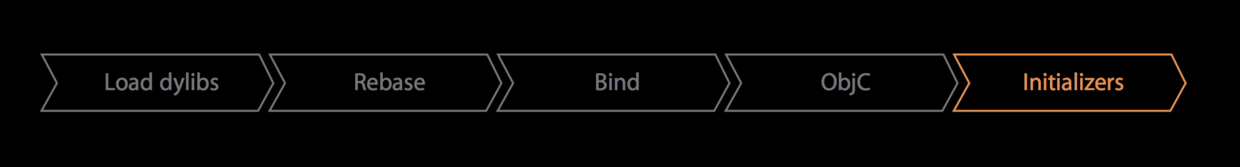
The figure is Apple's PT on WWDC, which is a simple summary of what was done before main started. How to consider the start time after main? This depends more on your own definition. Some people take the period from main to didFinish Launching as an indicator, while others take the period from main to viewDidAppear of the first ViewController as a consideration indicator. Anyway, I think it reflects the problem to some extent.
Measurement of pre-main time by Xcode
Xcode provides a great way to test startup time. Just set the environment variable DYLD_PRINT_STATISTICS to 1 in Edit scheme-> Run-> Auguments, and you can see the time consumption of each stage before main.
Total pre-main time: 341.32 milliseconds (100.0%)
         dylib loading time: 154.88 milliseconds (45.3%)
        rebase/binding time:  37.20 milliseconds (10.8%)
            ObjC setup time:  52.62 milliseconds (15.4%)
           initializer time:  96.50 milliseconds (28.2%)
           slowest intializers :
               libSystem.dylib :   4.07 milliseconds (1.1%)
    libMainThreadChecker.dylib :  30.75 milliseconds (9.0%)
                  AFNetworking :  19.08 milliseconds (5.5%)
                        LDXLog :  10.06 milliseconds (2.9%)
                        Bigger :   7.05 milliseconds (2.0%)
Another way to get more detailed time is to set the environment variable DYLD_PRINT_STATISTICS_DETAILS to 1.
  total time: 1.0 seconds (100.0%)
  total images loaded:  243 (0 from dyld shared cache)
  total segments mapped: 721, into 93608 pages with 6173 pages pre-fetched
  total images loading time: 817.51 milliseconds (78.3%)
  total load time in ObjC:  63.02 milliseconds (6.0%)
  total debugger pause time: 683.67 milliseconds (65.5%)
  total dtrace DOF registration time:   0.07 milliseconds (0.0%)
  total rebase fixups:  2,131,938
  total rebase fixups time:  37.54 milliseconds (3.5%)
  total binding fixups: 243,422
  total binding fixups time:  29.60 milliseconds (2.8%)
  total weak binding fixups time:   1.75 milliseconds (0.1%)
  total redo shared cached bindings time:  29.32 milliseconds (2.8%)
  total bindings lazily fixed up: 0 of 0
  total time in initializers and ObjC +load:  93.76 milliseconds (8.9%)
                           libSystem.dylib :   2.58 milliseconds (0.2%)
               libBacktraceRecording.dylib :   3.06 milliseconds (0.2%)
                            CoreFoundation :   1.85 milliseconds (0.1%)
                                Foundation :   2.61 milliseconds (0.2%)
                libMainThreadChecker.dylib :  42.73 milliseconds (4.0%)
                                   ModelIO :   1.93 milliseconds (0.1%)
                              AFNetworking :  18.76 milliseconds (1.7%)
                                    LDXLog :   9.46 milliseconds (0.9%)
                        libswiftCore.dylib :   1.16 milliseconds (0.1%)
                   libswiftCoreImage.dylib :   1.51 milliseconds (0.1%)
                                    Bigger :   3.91 milliseconds (0.3%)
                              Reachability :   1.48 milliseconds (0.1%)
                             ReactiveCocoa :   1.56 milliseconds (0.1%)
                                SDWebImage :   1.41 milliseconds (0.1%)
                             SVProgressHUD :   1.23 milliseconds (0.1%)
total symbol trie searches:    133246
total symbol table binary searches:    0
total images defining weak symbols:  30
total images using weak symbols:  69
How to measure pre-main time online
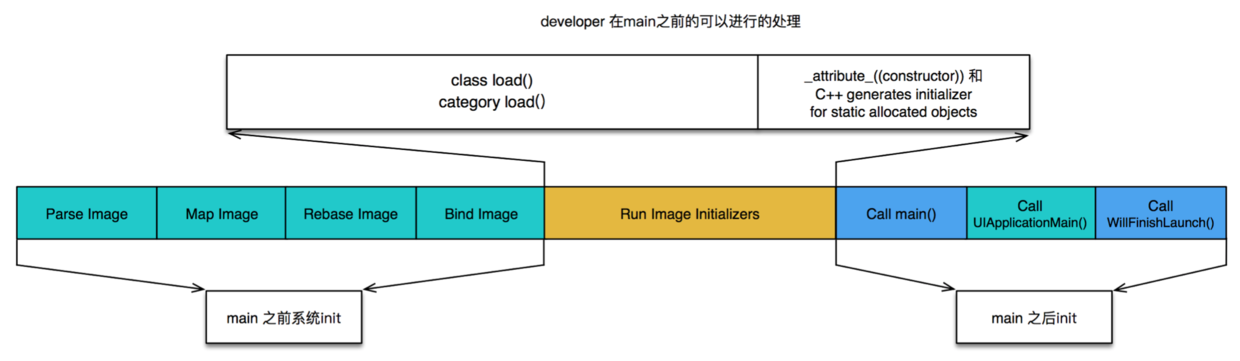
If we don't rely on Xcode, we can also consider the time before main. Of course, this time measurement focuses more on the developer-controlled startup phase. This is the Initializer section shown in the first figure, which handles the execution of initializer and ObjC Load methods for C++ static objects during this period.
Measuring ObjC Load Method
How to calculate this period of time? The easiest thing to think about is the point of interception, how to intercept becomes a difficult point. Turn your eyes to the dyld source code and see what you find. The entire initialization process starts with the initializeMainExecutable method. Dyld initializes the dynamic library first and then the App executable.
void initializeMainExecutable()
{
    // record that we've reached this step
    gLinkContext.startedInitializingMainExecutable = true;

    // run initialzers for any inserted dylibs
    ImageLoader::InitializerTimingList initializerTimes[allImagesCount()];
    initializerTimes[0].count = 0;
    const size_t rootCount = sImageRoots.size();
    if ( rootCount > 1 ) {
        for(size_t i=1; i < rootCount; ++i) {
            sImageRoots[i]->runInitializers(gLinkContext, initializerTimes[0]);
        }
    }

    // run initializers for main executable and everything it brings up
    sMainExecutable->runInitializers(gLinkContext, initializerTimes[0]);
It's not hard to imagine, then, that all Load functions in Hook App in the load function of dynamic libraries can be dotted. However, many project libraries are managed by Cocoapods, and many use_frameworks. That is to say, our App is not a single executable file, it is composed of main image file and many dynamic libraries. According to the method just mentioned, it is impossible to count the execution time of load function of dynamic library introduced by ourselves. The next step to consider is how to find the earliest dynamic library to load. Then do Hook in its load function.
After studying the dyld source code and testing by ourselves, it is found that the loading order of dynamic libraries is closely related to the alphabetical order and dependencies. That is to say, dynamic libraries at the beginning of A give priority to load, and dependent dynamic libraries give priority to load. Following is the result of my own dot test. LDXlog is Bigger dependent, so AFNetworking loads first, then LDXlog, in alphabetical order.
2017-09-23 13:45:01.683817+0800 AAALoadHook[27267:1585198] AFNetworking
2017-09-23 13:45:01.696816+0800 AAALoadHook[27267:1585198] LDXLog
2017-09-23 13:45:01.707312+0800 AAALoadHook[27267:1585198] Bigger
2017-09-23 13:45:01.708875+0800 AAALoadHook[27267:1585198] Reachability
2017-09-23 13:45:01.710732+0800 AAALoadHook[27267:1585198] REACtive
2017-09-23 13:45:01.712066+0800 AAALoadHook[27267:1585198] SDWE
2017-09-23 13:45:01.713650+0800 AAALoadHook[27267:1585198] SVProgressHUD
2017-09-23 13:45:01.714499+0800 AAALoadHook[27267:1585198] I am the main project.
That is to say, we just need to name our statistical library as the library beginning with A (the earliest load library) and add dots to it. Summarize the overall thinking again:
- Find the earliest dynamic library of load
- Get all executable files in App in the load function
- load function of executable file corresponding to hook
- Statistics of the time of each load function and the total time of all load functions
- Statistical Analysis of Reporting
Because there are many codes, the blog is too long to paste, so if you want to know the source code, you can click on this link: https://github.com/joy0304/JoyDemo/tree/master/HookLoad
Just now, there are still some matters needing attention in the statistics, that is, not for statistical performance, but because of its own performance problems, it is time-consuming to get all the classes and Hook load functions. If the control is not good, it will increase the startup time. The following points may be useful:
- Do not retrieve all classes at once. First, retrieve the executable files under mainBundle, and exclude the dynamic libraries packaged in because of Swift ABI instability, then retrieve the class files.
- Personally, I don't think it's necessary to hook all the classes. Only the hook business side implements the classes of the load function better (which is what we monitor and can optimize).
- The above is just the author's personal feeling. We can try them all to see which performance is better.
Measuring C++ Static Initializers
Just mentioned that the initializeMainExecutable is the initializeMainExecutable, which executes the ImageLoader::runInitializers method, then calls ImageLoader::doInitialization, and finally executes the doModInitFunctions method.
void ImageLoaderMachO::doModInitFunctions(const LinkContext& context) { if ( fHasInitializers ) { const uint32_t cmd_count = ((macho_header*)fMachOData)->ncmds; const struct load_command* const cmds = (struct load_command*)&fMachOData[sizeof(macho_header)]; const struct load_command* cmd = cmds; for (uint32_t i = 0; i < cmd_count; ++i) { if ( cmd->cmd == LC_SEGMENT_COMMAND ) { const struct macho_segment_command* seg = (struct macho_segment_command*)cmd; const struct macho_section* const sectionsStart = (struct macho_section*)((char*)seg + sizeof(struct macho_segment_command)); const struct macho_section* const sectionsEnd = §ionsStart[seg->nsects]; for (const struct macho_section* sect=sectionsStart; sect < sectionsEnd; ++sect) { const uint8_t type = sect->flags & SECTION_TYPE; if ( type == S_MOD_INIT_FUNC_POINTERS ) { Initializer* inits = (Initializer*)(sect->addr + fSlide); const size_t count = sect->size / sizeof(uintptr_t); for (size_t j=0; j < count; ++j) { Initializer func = inits[j]; // <rdar://problem/8543820&9228031> verify initializers are in image if ( ! this->containsAddress((void*)func) ) { dyld::throwf("initializer function %p not in mapped image for %s\n", func, this->getPath()); } func(context.argc, context.argv, context.envp, context.apple, &context.programVars); } } } } cmd = (const struct load_command*)(((char*)cmd)+cmd->cmdsize); } } }
This code is really long. It reads all the function pointers from mod_init_func section and then executes the function calls, which correspond to our C++ Static Initializers and _attribute_((constructor)) modified functions.
Because their execution order is after the load function, we can replace the address in mod_init_func with our hook function pointer in the load function, and then save the original function pointer to a global data. When we execute our hook function, we take out the original function address from the global array to execute. The main code is posted here, more can refer to this link: https://github.com/everettjf/Yolo/blob/master/HookCppInitilizers/hook_cpp_init.mm
void myInitFunc_Initializer(int argc, const char* argv[], const char* envp[], const char* apple[], const struct MyProgramVars* vars){
        ++g_cur_index;

        OriginalInitializer func = (OriginalInitializer)g_initializer->at(g_cur_index);

        CFTimeInterval start = CFAbsoluteTimeGetCurrent();

        func(argc,argv,envp,apple,vars);

        CFTimeInterval end = CFAbsoluteTimeGetCurrent();
}

static void hookModInitFunc(){
        Dl_info info;
        dladdr((const void *)hookModInitFunc, &info);

#ifndef __LP64__
        const struct mach_header *mhp = (struct mach_header*)info.dli_fbase;
        unsigned long size = 0;
        MemoryType *memory = (uint32_t*)getsectiondata(mhp, "__DATA", "__mod_init_func", & size);
#else
        const struct mach_header_64 *mhp = (struct mach_header_64*)info.dli_fbase;
        unsigned long size = 0;
        MemoryType *memory = (uint64_t*)getsectiondata(mhp, "__DATA", "__mod_init_func", & size);
#endif
        for(int idx = 0; idx < size/sizeof(void*); ++idx){
                MemoryType original_ptr = memory[idx];
                g_initializer->push_back(original_ptr);
                memory[idx] = (MemoryType)myInitFunc_Initializer;
        }
}
Will there be any problems with the hook load function for C++ Static Initializers? Yes, I want to count the execution time of C++ Static Initializers of all executable files in App in a dynamic library, but there is a code in dyld:
if ( type == S_MOD_INIT_FUNC_POINTERS ) {
    Initializer* inits = (Initializer*)(sect->addr + fSlide);
    const size_t count = sect->size / sizeof(uintptr_t);

    for (size_t j=0; j < count; ++j) {
        Initializer func = inits[j];
        // <rdar://problem/8543820&9228031> verify initializers are in image
        if ( ! this->containsAddress((void*)func) ) {
            dyld::throwf("initializer function %p not in mapped image for %s\n", func, this->getPath());
        }

        func(context.argc, context.argv, context.envp, context.apple, &context.programVars);
    }
}
If (this - > containsAddress ((void *) func), we will make a judgment here to determine whether the function address is in the current image address space, because we are doing function address replacement in an independent dynamic library. The replaced function address is in our dynamic library, not in other images, so when other images perform this judgment, they are thrown out. Abnormal. The problem seems to be puzzling, so our C++ Static Initializers time statistics are slightly inadequate.
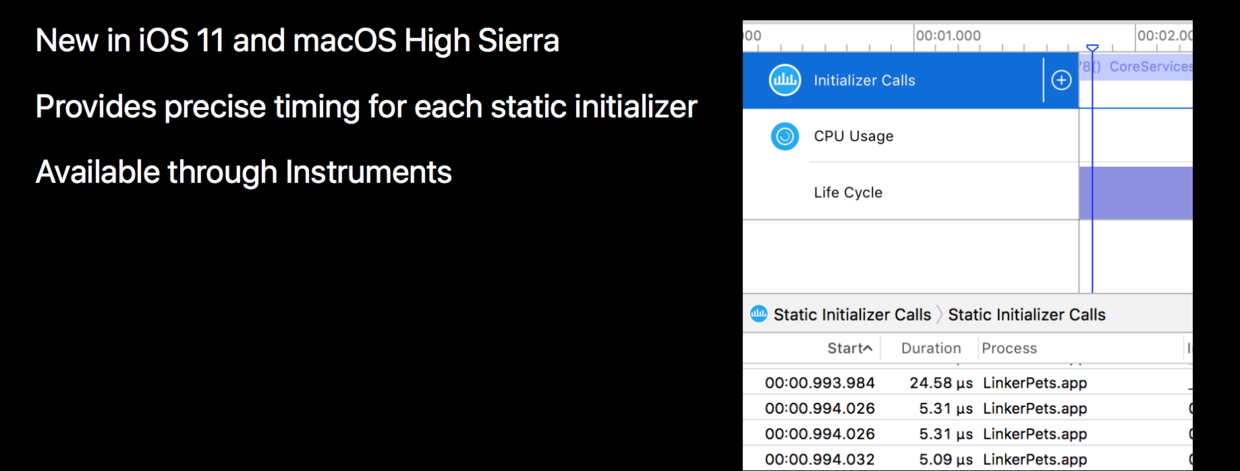
Xcode For Static Initializers
Apple in https://developer.apple.com/videos/play/wwdc2017/413/ A new scheme to track the time consumption of Static Initializers was announced. Instruments added a tool called Static Initializer Tracing to facilitate the investigation of each Static Initializer's time consumption. (I haven't updated the latest version yet, so I won't practice it yet.)
Time measurement after main
The end of main to didFinish Launching or the viewDidAppear of the first ViewController are used as a measure of the startup time after main. This time statistics can be calculated directly, but when the problem needs to be sorted out for a long time, only two points of time is not convenient for sorting out. At present, the better way to see is to standardize and particulatize the start-up task, and make statistics for each task, so as to facilitate the positioning and optimization of later problems.
Optimization?
In fact, many companies have blogged about optimization. Now that we have talked about starting monitoring, let's write a little bit about the optimization scheme that I think I'll use more.
- At present, many projects use pod dynamic libraries of use_frameworks. The dynamic libraries of the system have optimization schemes such as shared cache. But if our dynamic libraries become more, it will be very time-consuming, so merging dynamic libraries is an effective and feasible scheme.
- Subdivide the startup task into several parts, do not need to initialize in time, do not need to initialize in the main thread, all choose asynchronous delay loading.
- Monitoring the time consumption of load and Static Initializers can easily lead to hundreds of milliseconds of time consumption if you are not careful.
- There are many other company practices that I have collected for reference: https://github.com/joy0304/Joy-Blog/blob/master/iOSCollection.md