preface
Now, if you search on the network, basically most controls used to detect FPS are implemented through CADisplayLink.
CADisplayLink
The official document describes CADisplayLink as follows:
A timer object that allows your application to synchronize its drawing to the refresh rate of the display.
That is, the time object synchronized with the screen refresh rate.
Generally, our screen refresh rate is 1/60s. In fact, CADisplayLink is basically similar to the usual use of NSTimer. The time interval of NSTimer is in seconds, while CADisplayLink uses the frame rate as the unit of time interval.
The general practice of using CADisplayLink to realize FPS monitoring is as follows:
var historyCount: Int = 0
var lastUpdateTimestamp: Double = 0
let displayLink = CADisplayLink(target: self, selector: #selector(step(displayLink:))

// ...

func step(displayLink: CADisplayLink) {
    if (lastUpdateTimestamp <= 0) {
        lastUpdateTimestamp = displayLink.timestamp
    }

    historyCount += 1
    let interval = displayLink.timestamp - lastUpdateTimestamp
    if (interval >= 1) {
        lastUpdateTimestamp = 0
        let fps = Double(historyCount) / interval
        print(fps)
        historyCount = 0
    }
}
The core idea is: when initializing the CADisplayLink object, specify a method, which will be called every 1 / 60 second every screen refresh, and obtain the fps of the current screen by calculating the number of calls and time interval of the method
test
According to the above code, I created a tableView to display all kinds of fillet images in the cell. Anyway, how to get the card:
func tableView(_ tableView: UITableView, cellForRowAt indexPath: IndexPath) -> UITableViewCell {
    let cell = tableView.dequeueReusableCell(withIdentifier: "Cell")
    cell!.imageView!.image = UIImage(named: "00" + String(indexPath.row % 8 + 1))
    cell!.imageView!.layer.cornerRadius = 10
    cell!.imageView!.clipsToBounds = true
    cell!.imageView!.layer.shadowOffset = CGSize(width: 0, height: 5)
    cell!.imageView!.layer.shadowOpacity = 1

    if (indexPath.row % 3 == 0) {
        cell!.textLabel!.text = "Five hundred years ago, the monkey king lost his horse, the eagle worried about flying in the stream, and the White Dragon sand river blocked the road, which was difficult to reach the sky in Fuling mountain"
    } else if (indexPath.row % 3 == 1) {
        cell!.textLabel!.text = "On the ridge, the seven stars go against the yellow wind and don't shine on the wave moon cave, the Millennium white bone turns into the Yin wind, the fish basket connects the sky, a red purple gold gourd, two children and nine old foxes dare to press the dragon, the white rainbow falls into the snow wave, smashes the stone, and it's difficult to return to the cycle"
    } else {
        cell!.textLabel!.text = "The red neon hangs with nine heavy purple clouds, and the purple clouds fly for a long time. They want to return. They want to hate and return. Where the fetus just ascends, it is difficult to violate the destiny. Bhikkhu takes the White Deer thirteen niangs' love and binds the black robe gentleman. He stands in the way in front of the Baimu temple and calls himself the ancestor of Huangmei"
    }

    cell!.textLabel!.backgroundColor = UIColor.clear
    cell!.textLabel!.layer.shadowOffset = CGSize(width: 0, height: 2)
    cell!.textLabel!.layer.shadowOpacity = 1
    cell!.textLabel!.numberOfLines = 0

    return cell!
}
When running, you can see that the printed frame rate is:

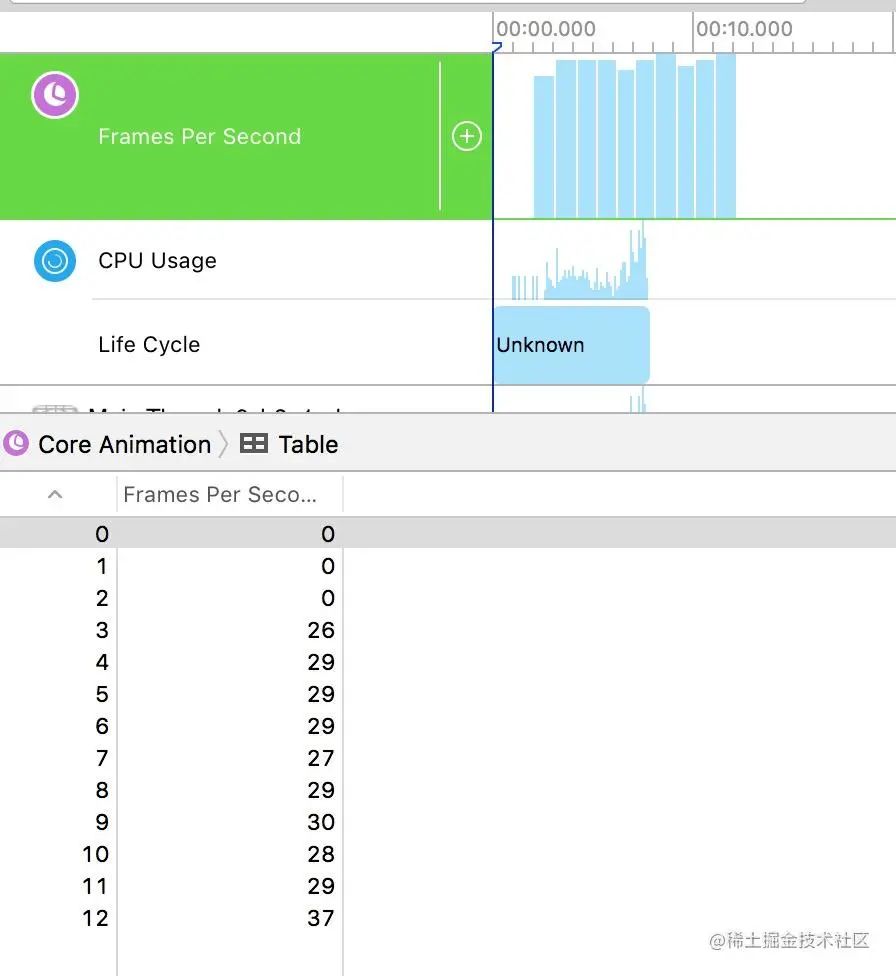
However, when monitoring through the Core Animation of Instrument, the results are as follows:

The two are not right at all.
In this article, it is found that the author also encountered the same problem: detailed explanation of FPS indicator based on CADisplayLink in iOS [1]
According to the introduction of the article "skills for iOS to keep the interface smooth" [2] by the great God ibirme, we can know that in the process of displaying images on the screen, the CPU is responsible for calculating the display content, doing work such as view creation, layout calculation and image decoding, and then submitting the data to the GPU, which transforms and renders these image data, The image will be submitted to the frame buffer, and then displayed on the screen when the next synchronization signal comes. Then the GPU switches to another frame buffer and repeats the above work.
It can be seen that the operation of CADisplayLink depends on RunLoop. The operation of RunLoop depends on its mode and the busy degree of CPU. When the CPU is busy calculating the display content or the GPU is too heavy, the displayed FPS will be inconsistent with the Instrument.
Therefore, using CADisplayLink can not accurately reflect the FPS of the current screen!
Main route Caton monitoring
Because CADisplayLink can not accurately reflect it, the commonly used method is main process Caton monitoring. A sub thread is opened to monitor the RunLoop of the main thread. When the time consumption of the two status areas is greater than the set threshold, it is a Caton.
According to the introduction of how to monitor Caton [3], we can know the principle and practice of Caton monitoring in the main process.
reference material
[1] Detailed explanation of FPS indicator based on CADisplayLink in IOS: https://www.jianshu.com/p/86705c95c224
[2] Tips for IOS to keep the interface smooth: https://blog.ibireme.com/2015/11/12/smooth_user_interfaces_for_ios/
[3] How to monitor Caton: https://github.com/aozhimin/iOS-Monitor-Platform