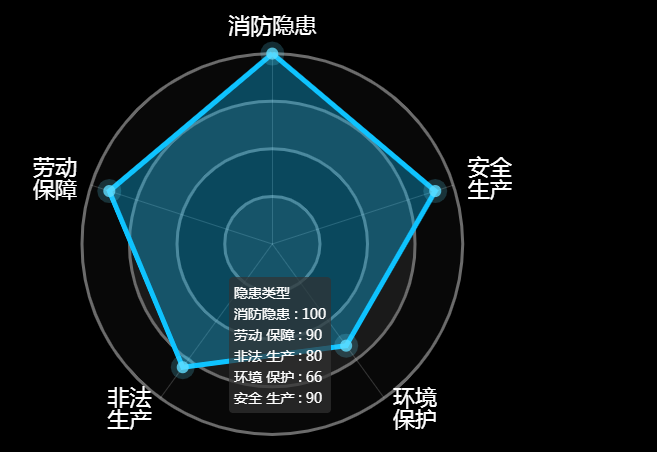
One of the recent projects is to draw radar maps, slide the mouse over the inflection point of radar maps, display the dimension-related data, and display the scale of radar maps.
But I found that radar images alone did not seem to be able to display one-dimensional data.
To sum up, there are three difficulties in drawing radar pictures.
(1) How to display the scale.
(2) How to judge the turning point is slipping.
(3) How to find the dimension data corresponding to inflection point.
The following is a summary of the solutions to the problems:
Question (1):
The echarts version no longer provides scaling label attributes for radar maps since 4.x, but the 3.x version has scaling attributes, radar.axisLabel. So if you want to display the scale of radar chart, you can change the version of echarts back to version 3.x. But for my project, this method is not feasible, because many of my projects are based on 4.x version of the chart, if you change back to 3.x version, there will be too many things to change, and it will affect the whole body.
So I have to think of something else. I consider using polar coordinates as the base map of radar maps and using polar coordinates as the scale of radar maps. The key steps are as follows:
1. The display range of my radar chart is 1-10, and the scale interval is 2. So I use radius Axis of polar coordinates to show that the scale interval is 2.
2. In addition, it is necessary to set the radius of radar.radius and polar.radius of polar coordinates to be the same so that they have the same scaling ratio.
3. Radius Axis. splitNumber of the radial axis of polar coordinates and radar.splitNumber of the indicator axis of radar chart must be the same.
4. The polar.center of polar coordinates must be the same as the radar.center of radar map.
var dimensionData = [
    {name: "cover", max: 10},
    {name: "interfere", max: 10},
    {name: "perception", max: 10},
    {name: "fault", max: 10},
    {name: "capacity", max: 10}
];
data = [7.9, 3, 3, 5.11, 4.4];
var radius = '60%';
var radarOption = {
    radar:{
        center:['50%', '50%'],
        startAngle:90,
        indicator:dimensionData,
        splitNumber: 5,
        radius: radius,
        shape: 'circle',
        name: {
           show:true,
           textStyle: {
             color: '#ffffff',
             fontSize: 12
            }
        },
        splitArea: {
           areaStyle: {
             color: ['rgba(0, 21, 102, 0.4)'],
           },
        },
        splitLine: {
            show:true,
            lineStyle: {
              color: ['rgba(238,238,238, 0.2)']
            }
        },
        axisLine: {
           lineStyle: {
             color: ['rgba(238,238,238, 0.2)']
           }
        }
    },
    //Polar coordinate system
    polar: {
        radius: radius,
    },
    angleAxis: {
       axisLine: {
          lineStyle: {
             color: 'rgba(238,238,238, 0.2)'
          }
       },
    },
    radiusAxis: {
        //The annotated usage can dynamically control the number of scales, but sometimes the phenomenon of incomplete display of scale labels occurs.
        // type: 'value',
        // min: 0,
        // max: 10,
        // interval: 2
        type: 'category',
        axisLabel:{
           show:true,
           interval: 0,
           fontSize:9,
           color:"rgba(255, 255, 255, 0.5)",
        },
        axisTick:{
           show:true,
           inside:true,
        },
        axisLine:{
           show:true,
           lineStyle:{
              color:'rgba(238,238,238, 0.2)'
           }
        },
        splitLine:{
           show:false,
           lineStyle:{
             color:'rgba(238,238,238, 0.2)'
           }
        },
        data:["2", "4", "6", "8", "10"]
    },
    tooltip: {
        show:false,
        trigger:'item'
    },
    series:[
    {
        type: 'radar',
        radarIndex:0,
        data:[{
           value:data
         }],
         symbol: 'circle',
         symbolSize: 6,
         itemStyle: {
            normal: {
               color: 'rgba(255, 255,255, 1)',
               borderColor: 'rgba(255, 179, 0, 1)',
               borderWidth: 1,
            }
         },
         areaStyle: {
            normal: {
               color: 'rgba(255, 179, 0, 0.8)',
            }
         },
         lineStyle: {
            width: 2,
            color: 'rgba(255, 179, 0, 1)'
         }
      }
   ]
}
Question (2):
Click on the inflection point of the radar chart to display the relevant data. At first, I thought about using tooltip, but I found that tooltip could not be implemented. There are two reasons: first, the trigger condition of tooltip can only be trigger:'item', trigger:'axis'can not be used. Secondly, after setting trigger:'item', the mouse will slide over any area of the radar map. Toolltip will display all dimension data. There is no way to skip the inflection point before displaying the data and only displaying the dimension data.
So I consider using echarts to provide API mouse events to achieve the effect. I use mouseover events and mouseout events. I want to use the parameters passed by the event to determine whether the mouse is sliding over the inflection point. I first looked at the parameters provided in the official echarts document, and there were no obvious parameters that would allow me to determine whether the mouse had slipped or not.

But my team leader firmly believes that when the mouse slides over different places, the parameters that must be passed are somewhere different. So after persistently and carefully checking the event parameters, we finally found it. The parameter params. event. target. _dimIdx shows the dimension subscript of the inflection point when it skips over the inflection point, and undefied when it skips over other areas. Therefore, this parameter can be used to determine whether the mouse slides over the inflection point or not.
this.radarChart.on("mouseover", function(params){
    var isSelectedDot = params.event.target.__dimIdx;
    if(isSelectedDot == undefined) return;

    //Do mouse sliding over inflection point
});
Question (3):
The inflection point has been found. How to find the dimension data corresponding to the inflection point? In echarts4.x, the data from an event is data from all dimensions, not from a single dimension, as shown below:
But at this point, I have got the dimension subscript of the inflection point, so according to the subscript, I can get the dimension data.