Highcharts is a chart library written in pure JavaScript. It can easily add interactive charts to Web sites or Web applications, and it is free for personal learning, personal websites and non-commercial use.
The chart types supported include line chart, curve chart, area chart, bar chart, pie chart, scatter chart, instrument chart, bubble chart, waterfall flow chart, etc. up to 20 kinds of charts, many of which can be integrated into the same chart to form a mixed chart.
After years of development and maintenance, it is very easy to start with rich chart functions, stable performance and professional and detailed development documents, which are also extremely beautiful and simple. Compared with echarts, it has a complete example demonstration, function introduction and detailed api documents.
Website: https://www.hcharts.cn/demo/highcharts
https://www.hcharts.cn/demo/highcharts/heatmap-canvas
Five minute code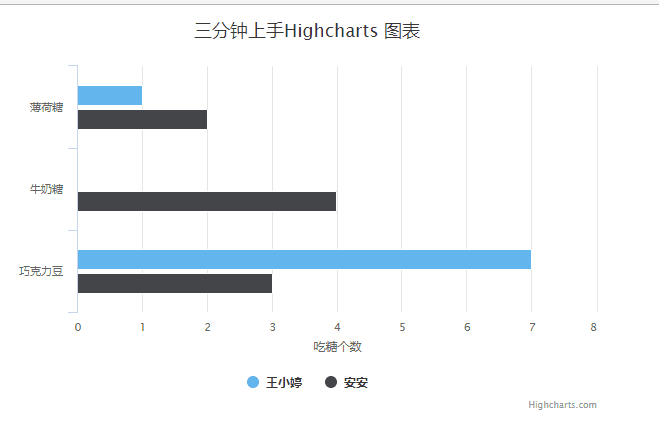
<!DOCTYPE html>
<html>
<head>
    <meta charset="utf-8">
    <title>Three minutes Highcharts Chart</title>
</head>
<body>
    <!-- Chart container DOM -->
    <div id="container" style="width: 600px;height:400px;"></div>
    <!-- Introduce highcharts.js -->
    <script src="http://cdn.hcharts.cn/highcharts/highcharts.js"></script>
    <script>
        // Chart configuration
        var options = {
            chart: {
                type: 'bar'                          //Specifies the type of chart. The default is line
            },
            title: {
                text: 'Three minutes Highcharts Chart'                 // Title
            },
            xAxis: {
                categories: ['Mint', 'Milk sugar', 'Chocolate beans']   // x axis classification
            },
            yAxis: {
                title: {
                    text: 'Number of sweets'                // y axis title
                }
            },
            series: [{

            	// Data column
                name: 'Wang Xiao Ting',                        // Data column name
                data: [1, 0, 7],                     // data
            }, {
                name: 'calmly',
                data: [2, 4, 3]
            }]
        };
        // Chart initialization function
        var chart = Highcharts.chart('container', options);
    </script>
</body>
</html>
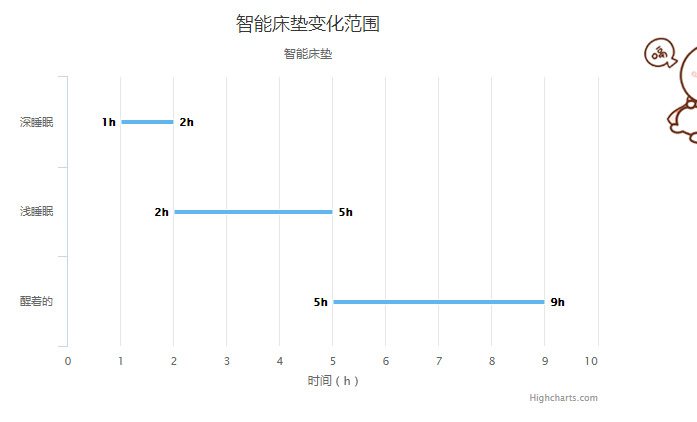
####1: Highcharts histogram width
How to modify the column width of Highcharts: pointWidth:5 / / the distance between columns to set this property
series: [{
					name: 'temperature',
					data: [
						[1, 2],
						[2, 5],
						[5, 9],
					],
					pointWidth:5 //Distance between columns

				}]
####2: ajax data interaction sample code
 $.ajax({
        url : "/bison/signIn/count/countOrgan",
        async : false,
        data : {
            beginDate : $("#beginTime").val(),
            endDate : $("#endTime").val(),
            personSex : $("#personSex").val(),
            organIds : getOrganIds(),
            signSetId : $("#signSet option:selected").val(),
        },
        type : 'POST',
        dataType : 'json',
        success : function(data) {
            // Callback method on success
            category_data = data.returnData.response.categor;
            natural_data = data.returnData.response.normalList;
            late_data = data.returnData.response.lateList;
            absent_data = data.returnData.response.absentList;
            fun(category_data, natural_data, late_data, absent_data);
        },
        error : erryFunction
    // Execute method on error
    });