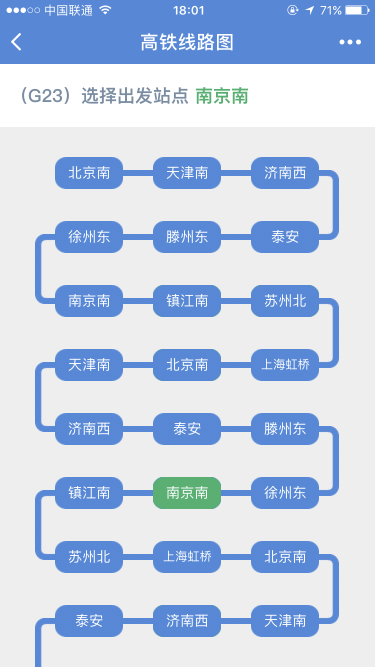
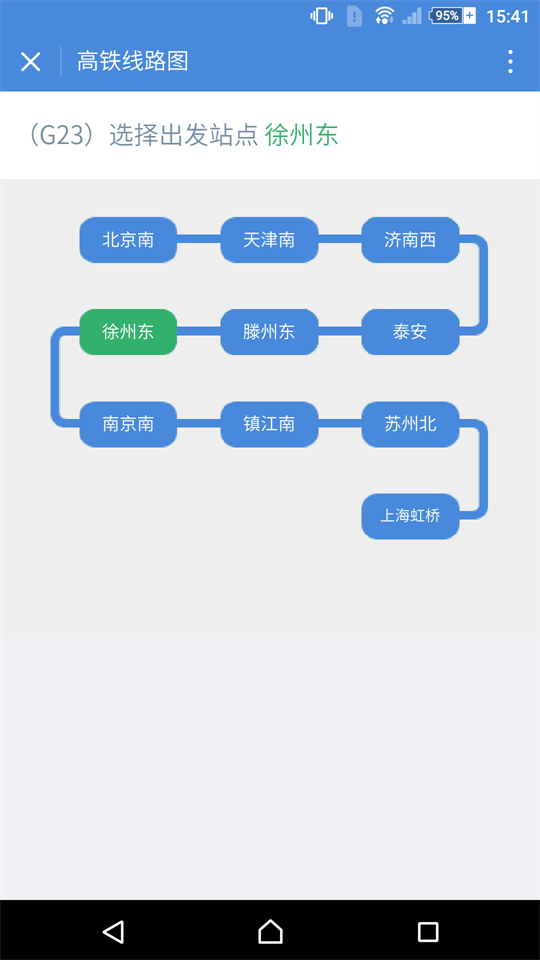
A few days ago @Tianxue gave me a route map of high-speed railway, and asked me if I could draw it with canvas, so I tried it. My idea may be more complicated; if there is a simpler idea, I can leave a message to reply.
Focus on Wechat Public Number, Get Source Code and Tutorial

1. First of all, we want to draw the rounded rectangle of each site. At first, we want to use canvas to draw the rounded rectangle, but we find that the arcTo method of drawing rounded rectangle has not yet been used by the small program, so it is relatively troublesome to draw with canvas. Finally, in order to facilitate the decision to replace it with pictures.
2. Divide the whole road map into four small pictures: (1) rectangular rounded corners of the site (2) direct links between the sites (3) right curved links between the sites (4) left curved links between the stations;
3. Through observation and analysis, the drawing process is divided into two steps. (1) The drawing point x coordinates of odd line rounded rectangle and connecting line increase from left to right, the value of y coordinate is line number multiplied by a fixed value. (2) The drawing point x coordinates of even line rounded rectangle and connecting line decrease from left to right, and the value of y coordinate is line number multiplied by a fixed value.
4. In odd rows, if the index+1 of the rounded rectangle of even rows is a multiple of 3, the right side of the current subscript of odd rows draws the right curved line picture, and the left side of the current subscript of even rows draws the left curved line picture.
5. Adaptation of the whole canvas rendering area on different mobile phones
6. For more details, please refer to the code comments.
7. Repeated drawing of the same picture using drawImage in the development tool only shows the location of the first drawing. For some reason, please test it on the real machine.
8. What are the shortcomings? I hope you can give us more advice. Appreciate!
wxml code:
- <!--pages/Gline/index.wxml-->
- <viewclass="g-title"> (G23) Select the starting site <textclass="chooseStation">{{chooseStation} </text> </view>.
- <canvasbindtouchstart="touchS"canvas-id="map"style='width:{{canvWidth}}rpx;height:{{canvHeight}}px;background-color:#eee'/>
wxss code:
/* pages/Gline/index.wxss */page{ background-color: #eeeeee }.g-title{font-size: 36rpx;font-weight: 600;color: #768da4;padding: 36rpx 0;padding-left: 20rpx; background-color: #fff}.chooseStation{color: #32b16c}
js code:
js Code:

// pages/Gline/index.js
Page({
  data:{
    canvWidth:750,
    canvHeight:750,
    stations:['South Beijing','South Tianjin','West Ji'nan','Tai'an','Tong Zhou Dong','Xu Zhou Dong','South Nanjing','Jiangnan Town','Suzhou North','sha','South Beijing','South Tianjin','West Ji'nan','Tai'an','Tong Zhou Dong','Xu Zhou Dong','South Nanjing','Jiangnan Town','Suzhou North','sha','South Beijing','South Tianjin','West Ji'nan','Tai'an','Tong Zhou Dong','Xu Zhou Dong','South Nanjing','Jiangnan Town','Suzhou North','sha'],
    chooseStation:'',//The page shows the name of the selected station.
    prevChooseIdx:null,//The Subscription of the Station was Selected last time
    // stations: ['Beijing South','Tianjin South','Jinan West','Taian'],
  },
  onLoad:function(options){
    // Parameters of page initialization options for page jumps
    // this.setData({canvHeight:502});
    const ctx = wx.createCanvasContext('map');//Canvas Context Objects Drawn by Roadmap
    this.ctx = ctx;//Binding ctx objects to the current page
    this.column = 3;//Number of stations per line
    this.offsetTop = 30;//Draw the top value of the starting coordinate, which is the distance from the top of canvas
    this.rect={//Rectangular objects with rounded corners
      img_b:'/images/rect-b.png',//Initial picture
      img_g:'/images/rect-g.png',//Pictures selected
      height:32,
      width:68
    }
    this.line = {//Line objects between stations
      img:'/images/line.png',
      height:6,
      width:30
    },
    this.bendLine = {//A curved connection between a station and a station.
      img_l:'/images/line_l.png',//Left side connection
      img_r:'/images/line_r.png',//Right connection
      height:70,
      width:20
    },
    this.rectArr=[];//An array of coordinates that record the starting points of all stations
    this.oddRowIndexArr=[];//An array of subscripts for stations that record odd rows, such as [0,1,2,6,...]
    this.evenRowIndexArr=[];//An array of subscripts for stations that record even rows, such as [3,4,5,9,...]
    this.initMap();
  },
  onReady:function(){
  },
  onShow:function(){
    // Page display
  },
  onHide:function(){
    // Page hiding
  },
  onUnload:function(){
    // Page closing
  },
  //Adaptation of Picture Size for Different Devices
  adaptiveScreenSize:function(o){
    let ww = this.data.winWidth;
    let zoom = ww/375;//375 Here is the same scale as the width of the iPhone 6.
    this.setData({zoom:zoom});
    let rectW = o.width*zoom;
    let rectH = o.height*zoom;
    o.width = rectW;
    o.height = rectH;
  },
  //Method of Initializing Roadmap
  initMap:function(){
    const that = this;
    wx.getSystemInfo({
      success: function(res){
        const ww = res.windowWidth;
        const pr = res.pixelRatio;
        that.setData({ winWidth:ww,pixelRatio:pr});//Store device information in data for later use
        that.drawMap();
      }
    })
  },
  drawTxtAtPos:function(idx){
    const rectArr = this.rectArr;
    const w = this.rect.width;
    const h = this.rect.height;
    let txt = this.data.stations[idx];
    let len = txt.length;
    //When the text of the site exceeds 3 words, the font size will be reduced.
    let fontSize = len>3?12:14;
    let x = rectArr[idx].x;
    let y = rectArr[idx].y;
          //Calculate the drawing points of text in the rounded rectangle, so that text can be displayed in the center.
    let txt_x = Math.floor((w - len*fontSize)/2)+x;
    let txt_y = Math.floor(h/2+fontSize/2)+y-2;//Here is an extra - 2, so that the text can be more vertically centered.
    this.ctx.setFontSize(fontSize);
    this.ctx.setFillStyle('#ffffff')
    this.ctx.fillText(txt, txt_x, txt_y);
  },
  //Draw a rounded rectangle at the subscript idx
  initRect:function(idx){
    const rectArr = this.rectArr;
    let x = rectArr[idx].x;
    let y = rectArr[idx].y;
    this.ctx.drawImage(this.rect.img_b,x, y, this.rect.width, this.rect.height);
  },
  //Dynamic calculation of the height of canvas with different screen sizes
  initCanvHeight:function(){
    let len = this.data.stations.length;
    let pr = this.data.pixelRatio;
    let z = this.data.zoom;
    let row = Math.ceil(len/this.column);
    let h = 0;
    if(row <= 1){
      console.log(this.rect.height);
      h = (this.offsetTop*2 + this.rect.height)*2;
    }else{
       h = this.offsetTop*2+(row-1)*(this.bendLine.height-this.line.height)+this.rect.height;
    }
   this.setData({canvHeight:h});
  },
  //The logic of drawing lines is rather confusing. I divide the lines into odd and even segments for drawing.
  drawLine:function(){
    const rectArr = this.rectArr;
    let x=0,y=0;
    if(rectArr.length==2){//Firstly, when the number of stations is 2, only one line segment needs to be drawn.
        x = rectArr[0].x+this.rect.width;//Calculating the x-coordinates of the starting point of the drawn line segment
        y = rectArr[0].y+Math.floor((this.rect.height-this.line.height)/2);//Calculating y-coordinates of the starting point of a drawn line segment
        this.ctx.drawImage(this.line.img, x, y, this.line.width, this.line.height);
    }else{
      const odd = this.oddRowIndexArr;
      const even = this.evenRowIndexArr;
      if(odd.length>0){
        for(let i=0;i<odd.length;i++){
          if((odd+1)!=rectArr.length){//Determine whether there are drawing points behind the current subscript drawing points
            x = rectArr[odd].x+this.rect.width;
            y = rectArr[odd].y+Math.floor((this.rect.height-this.line.height)/2);
            if((odd+1)%this.column!=0){//If the subscript of the drawing point of odd rows is not an integer multiple of 3, a straight line will be drawn, otherwise the right curve will be drawn.
              this.ctx.drawImage(this.line.img, x, y, this.line.width, this.line.height);
            }else{
              this.ctx.drawImage(this.bendLine.img_r, x, y, this.bendLine.width, this.bendLine.height);
            }
          }
        }
      }
      //The following logic differs from that of odd lines in that the coordinates of x change when drawing straight and curved lines.
      if(even.length>0){
        for(let i=0;i<even.length;i++){
          if((even+1)!=rectArr.length){
            y = rectArr[even].y+Math.floor((this.rect.height-this.line.height)/2);
            if((even+1)%this.column!=0){
              x = rectArr[even].x-this.line.width;//Calculating Formula for Drawing Lines
              this.ctx.drawImage(this.line.img, x, y, this.line.width, this.line.height);
            }else{
              x = rectArr[even].x-this.bendLine.width;//Calculating Formula for Drawing Bending Lines
              this.ctx.drawImage(this.bendLine.img_l, x, y, this.bendLine.width, this.bendLine.height);
            }
          }
        }
      }
    }
  },
  drawMap:function(){
    this.adaptiveScreenSize(this.rect);
    this.adaptiveScreenSize(this.line);
    this.adaptiveScreenSize(this.bendLine);
    this.initCanvHeight();
    this.createRectTopPoints();
    // setTimeout(()=>{
      const rectArr = this.rectArr;
      for(let i=0;i<rectArr.length;i++){
        this.initRect(i);
        this.drawTxtAtPos(i);
      }
      this.ctx.draw(true);
    // },500);
    this.drawLine();
    this.ctx.draw(true);
  },
  //After calculation, the starting coordinate x of all drawing points in each row is a fixed array.
  //For example, odd rows [10, 20, 30], even rows: [30, 20, 10]
  getDisXArr:function(){
    let arr = [];
    let ww = this.data.winWidth;
    let disX = Math.floor((ww-(this.column*this.rect.width+(this.column-1)*this.line.width))/2);
    for(let i=0;i<this.column;i++){
      let x = disX+i%this.column*(this.rect.width+this.line.width);
      arr = x;
    }
    return arr;
  },
  //According to the number of stations given, the drawing vertices of each station are calculated and stored in rectArr array.
  createRectTopPoints:function(){
    let rectArr = [];
    let disXArr = this.getDisXArr();
    let disXArrRev = this.getDisXArr().reverse();
    let disY = this.offsetTop;//Draw the height of the initial point from the top of canvas
    let len = this.data.stations.length;
    let row = Math.ceil(len/this.column);//Calculate the number of rows to be drawn according to the number of stations
    let n=0,x=0,y=0;
    for(let j = 1;j<=row;j++){
      for(let i=0;i<this.column;i++){
        ++n;
        if(n<=len){
          if(j%2!=0){
            this.oddRowIndexArr.push(n-1);
            //console.log("odd row:"+n);
            x = disXArr;
          }else{
            this.evenRowIndexArr.push(n-1);
            //console.log("even rows:"+n);
            x = disXArrRev;
          }
          y = disY + (j-1)*(this.bendLine.height-this.line.height);
          this.rectArr[n-1] = {x:x,y:y};
        }
      }
    }
  },
  //Determine whether the finger touch point is in the rounded rectangle
  pointInRectPolygon : function (point, vs) {
    let x = point[0], y = point[1],inside = false;
    for (let i = 0, j = vs.length - 1; i < vs.length; j = i++) {
        let xi = vs[0], yi = vs[1];
        let xj = vs[j][0], yj = vs[j][1];
        let intersect = ((yi > y) != (yj > y))
            && (x < (xj - xi) * (y - yi) / (yj - yi) + xi);
        if (intersect) inside = !inside;
    }
    return inside;
  },
        //According to the drawing points and width and height of a circular rectangle, the coordinate values of four vertices of the circular rectangle are calculated.
        //The order is left-up, right-up, right-down, left-down, clockwise.
  getRectPolygon:function(x,y,w,h){
    let vs = new Array() ;
    vs[0] = [x,y];
    vs[1] = [x+w,y];
    vs[2] = [x+w,y+h];
    vs[3] = [x,y+h];
    return vs;
  } ,
  //Click on the event called by the station, which needs to be dealt with:
  //1. You need to get the text of the station you are currently clicking on
  //2. Judge whether there has been a selection. If there has been a selection before, you need to change the color of the previously selected block to the default color.
  //3. Change the color of the current block
  //4. Record the subscript of the current Click
  chooseStation:function(currIdx){
    let txt = this.data.stations[currIdx];
    let prevIdx = this.data.prevChooseIdx;
    if(prevIdx!=null){
      let x = this.rectArr[prevIdx].x;
      let y = this.rectArr[prevIdx].y;
      this.ctx.drawImage(this.rect.img_b,x, y, this.rect.width, this.rect.height);
      this.drawTxtAtPos(prevIdx);
    }
    let x = this.rectArr[currIdx].x;
    let y = this.rectArr[currIdx].y;
    this.ctx.drawImage(this.rect.img_g,x, y, this.rect.width, this.rect.height);
    this.drawTxtAtPos(currIdx);
    this.ctx.draw(true);
    this.setData({chooseStation:txt,prevChooseIdx:currIdx});
  },
  //Click events
  touchS:function(e){
    console.log(e);
    let touch = e.changedTouches;//Changed Touches must be used here. If touches are used, Android's chances are questionable.
    if(touch.length==1){
      let tapPoint = [touch[0].x,touch[0].y];
      let rectArr = this.rectArr;
      for(let i=0;i<rectArr.length;i++){
        let vs = this.getRectPolygon(rectArr.x,rectArr.y,this.rect.width,this.rect.height);
        let inside = this.pointInRectPolygon(tapPoint,vs);
        if(inside){
          this.chooseStation(i);
          break;
        }
      }
    }
  }
})
Real machine test chart:
Reproduced at http://www.wxapp-union.com/article-1419-1.html