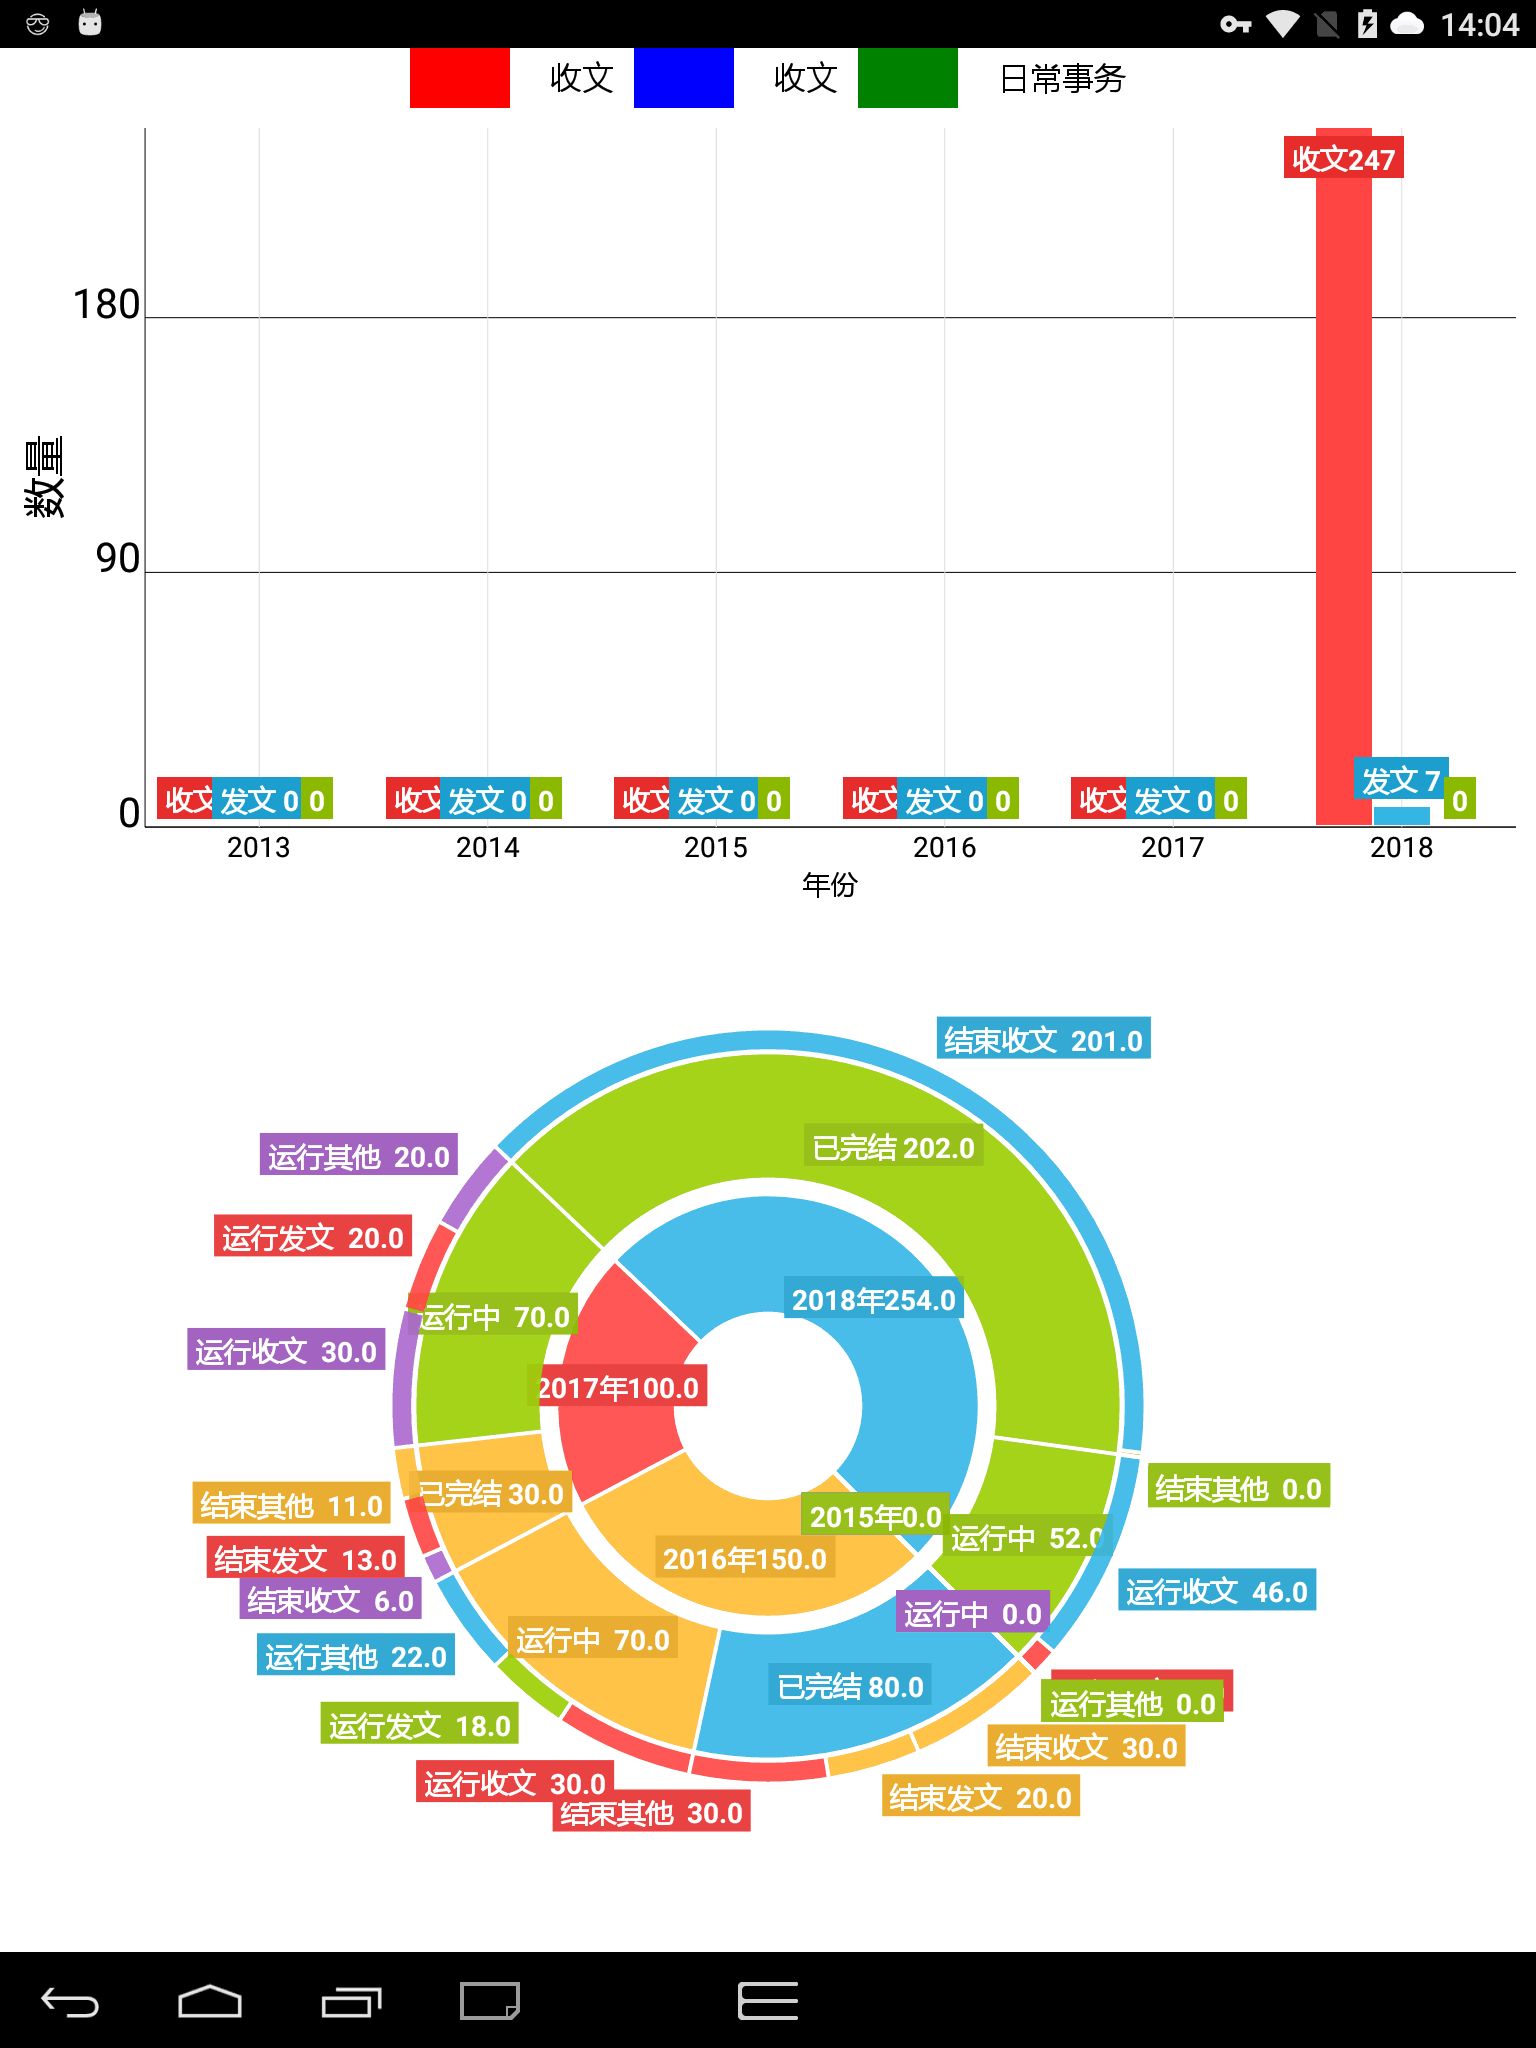
In addition to using the hellochart framework, this rendering can also be completed by using Echart. I wrote it with Echart first, and then with hellochart later. The reason is that it's painful to call js code with Android native, which wastes my day's work.
Example renderings:

Histogram:
Without too much explanation, there are many examples on the Internet, which can be completed with a little modification
<lecho.lib.hellocharts.view.ColumnChartView
    android:id="@+id/chart"
    android:layout_width="match_parent"
    android:layout_height="match_parent"
    android:layout_weight="1"
    android:layout_margin="10dp"/>
Part code:
public void initdata(){
    /*========== Histogram data filling==========*/
    List<Column> columnList = new ArrayList<>(); //Column list
    List<SubcolumnValue> subcolumnValueList;     //List of sub columns (i.e. a column, because a column can be divided into multiple sub columns)
    for (int i = 0; i <columnars_list.size(); ++i) {
        subcolumnValueList = new ArrayList<>();
        SubcolumnValue sv=new SubcolumnValue(columnars_list.get(i).getSws(),ChartUtils.COLOR_RED);//Add post to receive
        sv.setLabel(""+columnars_list.get(i).getSws());//Set the column display name or number
        subcolumnValueList.add(sv);
        SubcolumnValue fw= new SubcolumnValue(columnars_list.get(i).getFws(),ChartUtils.COLOR_BLUE);//Add post
        fw.setLabel(""+""+columnars_list.get(i).getFws());
        subcolumnValueList.add(fw);
        SubcolumnValue bmbls=   new SubcolumnValue(columnars_list.get(i).getBmbls(),ChartUtils.COLOR_GREEN);//Add third column
        bmbls.setLabel(columnars_list.get(i).getBmbls()+"");
        subcolumnValueList.add(bmbls);
        Column column = new Column(subcolumnValueList);
        column.setHasLabels(true);
        columnList.add(column);
    }

    mColumnChartData = new ColumnChartData(columnList);               //Setting data

}
//Set horizontal and vertical coordinates
public void setView(){
     /*===== Axis related settings=====*/
    Axis axisX = new Axis();
    Axis axisY = new Axis();
    ArrayList<AxisValue> axisValuesY = new ArrayList<AxisValue>();
    axisX.setName("Particular year");    //Set horizontal axis name
    axisY.setName("Number");    //Set vertical axis name
    List<AxisValue> axisValuesX=new ArrayList<>();
    for(int i=0;i<columnars_list.size();i++){
       //Set X
        axisValuesX.add(new AxisValue(i).setLabel(columnars_list.get(i).getYear()+""));
    }
    for (float j=0;j<1000;j+=10){
        axisValuesY.add(new AxisValue(j).setValue(j));// Add scale value for Y-axis display

    }
    axisX.setValues(axisValuesX);
    axisX.setHasLines(true);
    axisY.setLineColor(Color.BLACK);
    axisX.setTextColor(Color.BLACK);//Set font color

    axisY.setValues(axisValuesY);
    axisY.setHasLines(true);
    axisY.setTextColor(Color.BLACK);
    axisY.setLineColor(Color.BLACK);
    axisY.setTextSize(18);
   // mColumnChartData.setv
    mColumnChartData.setAxisXBottom(axisX); //Setting horizontal axis
    mColumnChartData.setAxisYLeft(axisY);   //Setting up vertical shaft


    //All the data and coordinate configurations set above have been stored in mColumnChartData. Next, set these configurations for mColumnChartView
    chartView.setColumnChartData(mColumnChartData);

}
The above is the key code of grouping histogram