Use Grafana and Prometheus to monitor the performance of Linux server, mainly through node_ The exporter monitors, such as CPU, memory, disk, etc. Prometheus collects data from remote machines through HTTP protocol and stores Prometheus local timing database.
- Install startup node_exporter
Node needs to be installed on the monitored server_ exporter. Download node_exporter, Download: https://github.com/prometheus/node_exporter/releases/download/v0.18.1/node_exporter-0.18.1.linux-amd64.tar.gzwget https://github.com/prometheus/node_exporter/releases/download/v0.18.1/node_exporter-0.18.1.linux-amd64.tar.gz tar xzvf /root/node_exporter-0.18.1.linux-amd64.tar.gz mv /root/node_exporter-0.18.1.linux-amd64 /opt/prometheus/
Create a prometheus user to start a node_exporter.service Services.
useradd -s /sbin/nologin -M prometheus
Create / usr/lib/systemd/system/node_exporter.service Documents.
[Unit]
Description=node_exporter
Documentation=https://prometheus.io/
After=network.target
[Service]
Type=simple
User=prometheus
ExecStart=/opt/prometheus/node_exporter/node_exporter
Restart=on-failure
[Install]
WantedBy=multi-user.target
Start:
systemctl start node_exporter.service
systemctl enable node_exporter.service
Manual installation of each machine is too cumbersome and inefficient, and firewall port and other issues should be considered. Here is the installation node of each machine_ Script for the exporter.
vim install_node_exporter_prometheus.sh#!/bin/bash #Author: Joey-Yu cat << EOF +------------------------------------------------------------------+ | ** Welcome to install prometheus node_exporter for CentOS 7 OS| +------------------------------------------------------------------+ EOF function format() { echo -e "\033[32m Success!!! \033[0m\n" echo "#########################################################" } #mkdir dir echo "set prometheus node-exporter dir" dir=/opt/prometheus/ if [ ! -d $dir ]; then mkdir -p /opt/prometheus/ fi format #download node_exporter-0.18.1.linux-amd64.tar.gz echo "download and tar prometheus node_exporter-0.18.1.linux-amd64.tar.gz in root" #cd /root && wget https://github.com/prometheus/node_exporter/releases/download/v0.18.1/node_exporter-0.18.1.linux-amd64.tar.gz node_exporter_file=/root/node_exporter-0.18.1.linux-amd64.tar.gz if [ ! -f $node_exporter_file ]; then echo "no node_exporter-0.18.1.linux-amd64.tar.gz in root!" exit else cd /root/ tar xzvf /root/node_exporter-0.18.1.linux-amd64.tar.gz mv /root/node_exporter-0.18.1.linux-amd64 /opt/prometheus/ format fi # useadd prometheus echo "useadd prometheus user" useradd -s /sbin/nologin -M prometheus format # chown prometheus and ln -s echo "chown prometheus and ln -s" cd /opt/prometheus/ chown -R prometheus.prometheus /opt/prometheus/node_exporter-0.18.1.linux-amd64/ ln -s /opt/prometheus/node_exporter-0.18.1.linux-amd64/ /opt/prometheus/node_exporter format # config prometheus /usr/lib/systemd/system/node_exporter.service echo "touch /usr/lib/systemd/system/node_exporter.service" touch /usr/lib/systemd/system/node_exporter.service cat > /usr/lib/systemd/system/node_exporter.service << EOF [Unit] Description=node_exporter Documentation=https://prometheus.io/ After=network.target [Service] Type=simple User=prometheus ExecStart=/opt/prometheus/node_exporter/node_exporter Restart=on-failure [Install] WantedBy=multi-user.target EOF systemctl start node_exporter.service systemctl enable node_exporter.service format - prometheus configuration
modify prometheus.yml Profile. Main list of scrapes_ Configuration under configs:- job_name: 'node-db' file_sd_configs: - files: ['/usr/local/prometheus/node-db.yml'] refresh_interval: 5s - job_name: 'node-pre' file_sd_configs: - files: ['/usr/local/prometheus/node-pre.yml'] refresh_interval: 5s - job_name: 'node-application' file_sd_configs: - files: ['/usr/local/prometheus/node-application.yml'] refresh_interval: 5s - job_name: 'node-pro' file_sd_configs: - files: ['/usr/local/prometheus/node-pro.yml'] refresh_interval: 5sAs can be seen from the above configuration, different applications and environments should be placed in one YML file as much as possible. Such as / usr/local/prometheus/node-application.yml File:
- targets: ["10.20.1.1:9100"]
labels:
instance: grafana
- targets: ["10.20.1.2:9100"]
labels:
instance: Zabbix-proxy
- targets: ["10.20.1.3:9100"]
labels:
instance: prometheus
Restart the prometheus server after modifying the configuration
systemctl restart prometheus.service
- Web interface access
Using Prometheus built-in web interface access effect. Enter Prometheus Web homepage status = > targets, as shown in the following figure after success: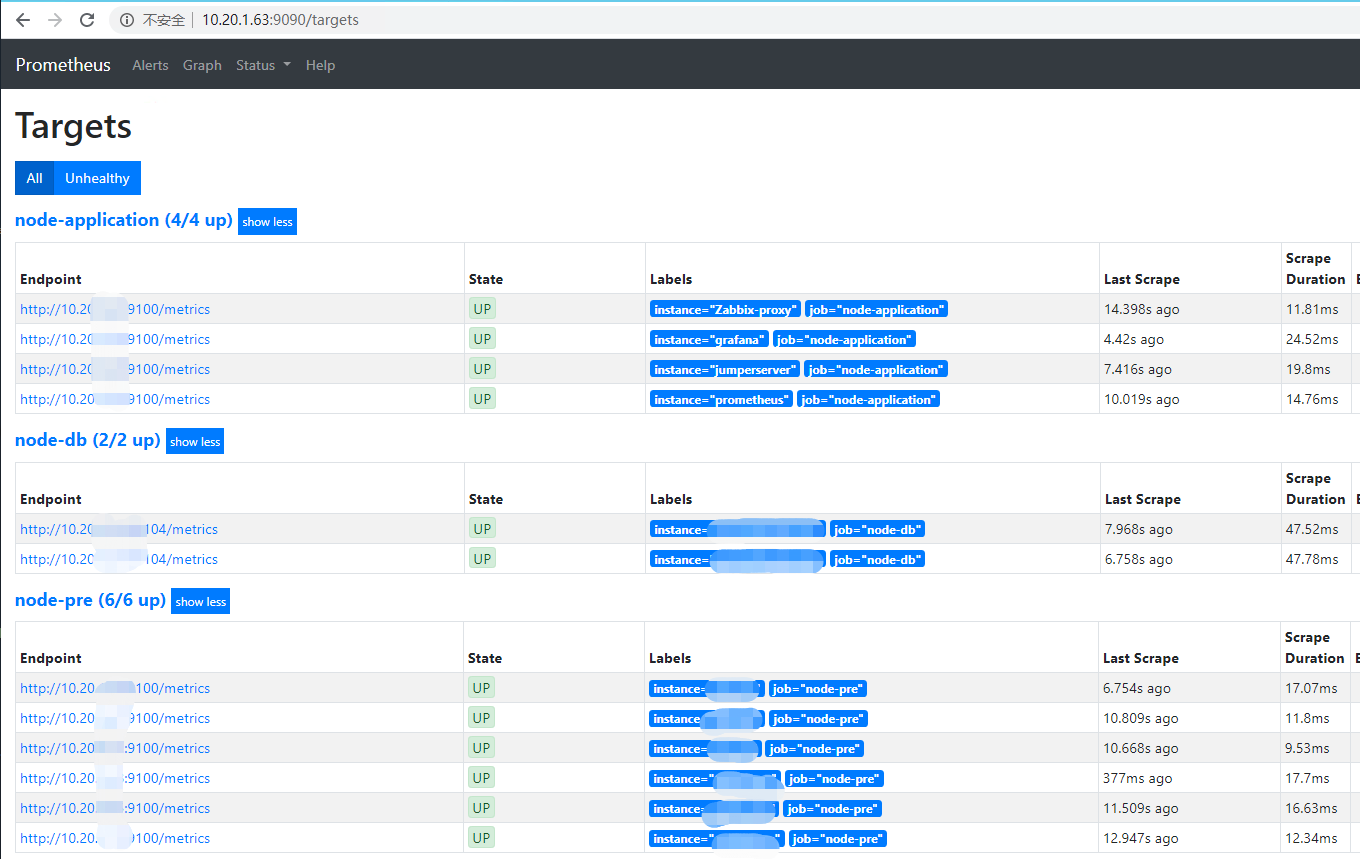
But the graphics provided by Prometheus are not powerful enough. Here, Grafana is used as the Dashboard of Prometheus. - Configure Grafana
First add Prometheus as the data source in Grafana.
Enter Grafana, click the "Add data source" button, jump to the Add data source page, and configure the Data Sources option to add Data Sources.
The Prometheus address is filled in the URL, and other items remain the default. Click Save & test to add successfully as follows: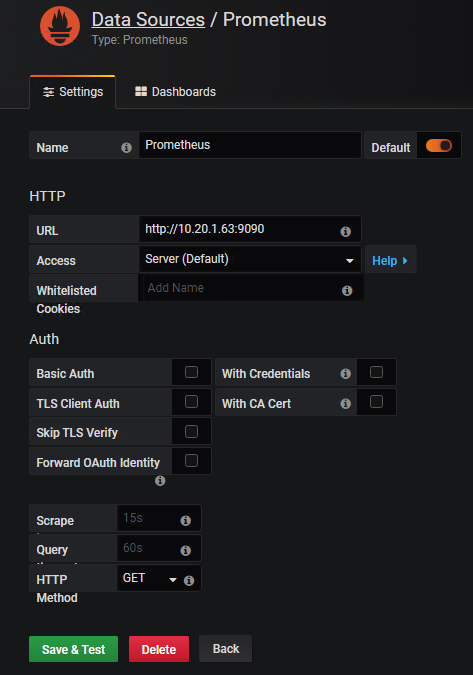
Granfana import node_exporter monitoring chart. Here is the official website https://grafana.com/grafana/dashboards/8919 Monitor the template and export Download JSON. The monitoring template supports Node Exporter v0.16 and above, including monitoring indicators such as CPU memory disk IO network traffic temperature.
Granfina enters create - > import to import Dashboards.
node_ The final effect of the exporter monitoring chart is as follows: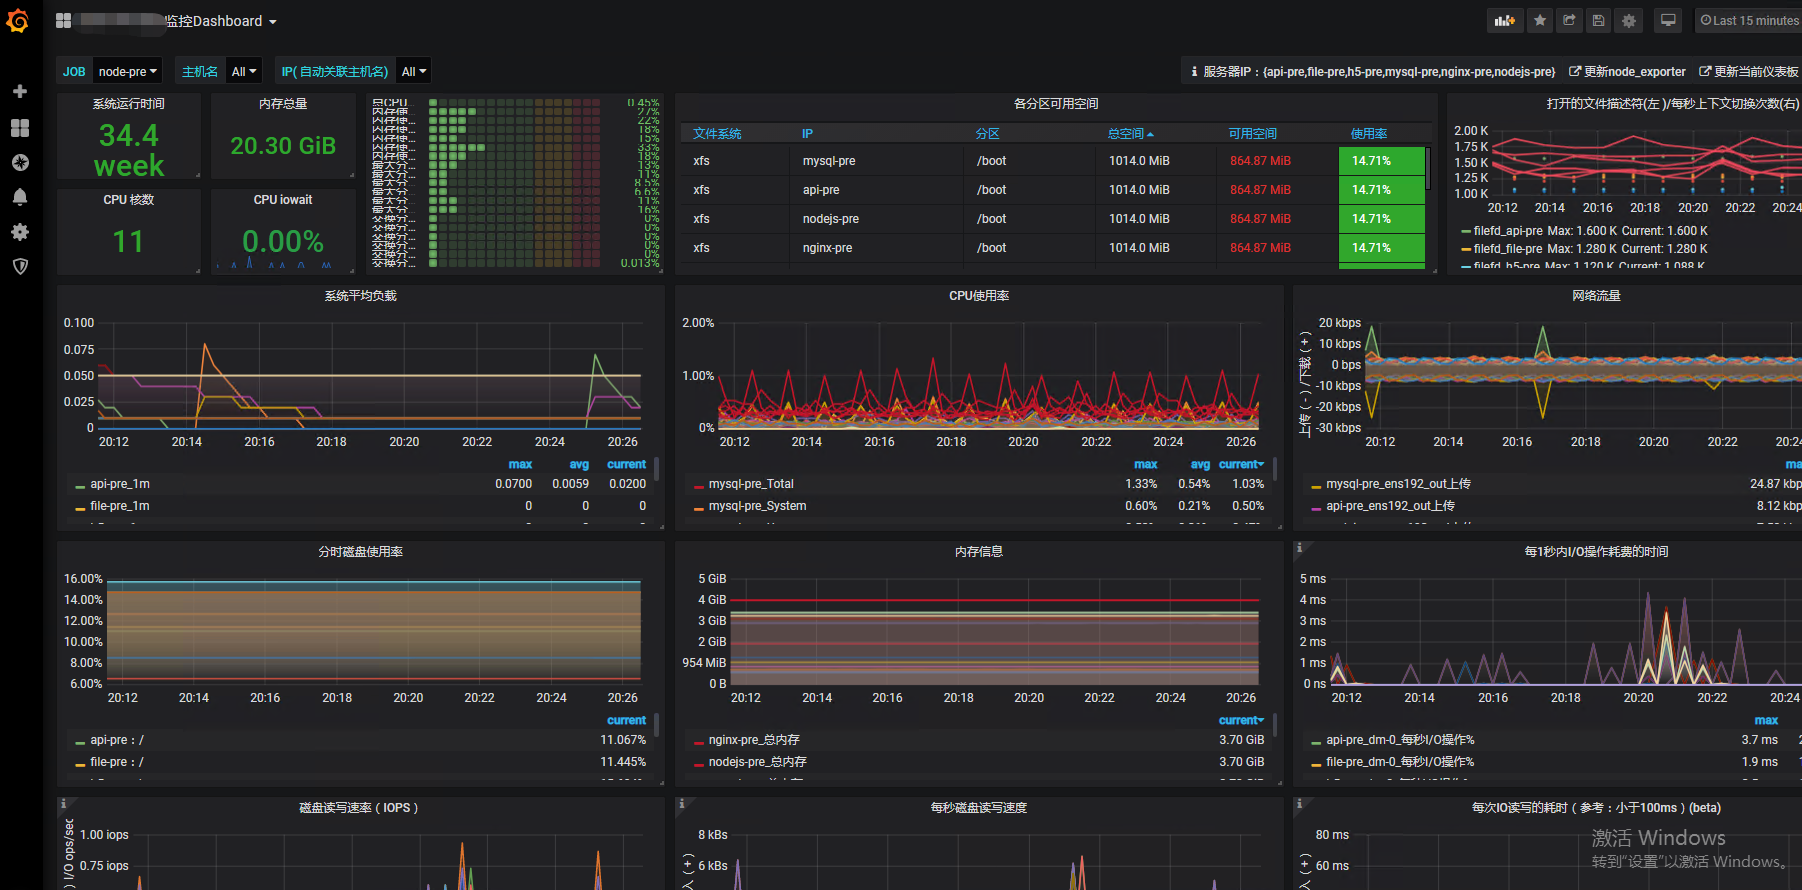
The monitoring items are still very detailed. You can select different server s under different node nodes in the upper left corner to view the monitoring.