In addition to supporting rich data sources and chart functions, grafana also supports alarm function, which also makes grafana a real monitoring tool from a data visualization tool. Grafana can alarm the abnormal information in the monitoring data through the configuration of the Alerting module. The alarm rules can be configured directly based on the existing data chart. When the alarm occurs, it will also notify the abnormal chart, making our alarm notification more friendly.
channel
Grafana Alerting supports a variety of alarm channels, such as nailing, Discord, Email, Kafka, Pushover, Telegram, Webhook, etc. we can use nailing and Email for presentation and description here.
Mailbox alarm is usually the most common alarm receiving method. Through Grafana alarm, you need to configure stmp service in Grafana's configuration file. Add the SMTP / email configuration block in the configuration file / etc/grafana/grafana.ini and turn on Alerting:
#################################### SMTP / Emailing ##########################
[smtp]
enabled = true
host = smtp.163.com:465  # We use 163 email here
user = xxx@163.com
password = <email password>  # Use the authorization code of Netease mailbox
skip_verify = true
from_address = xxx@163.com

#################################### Alerting ############################
[alerting]
enabled = true
execute_alerts = true
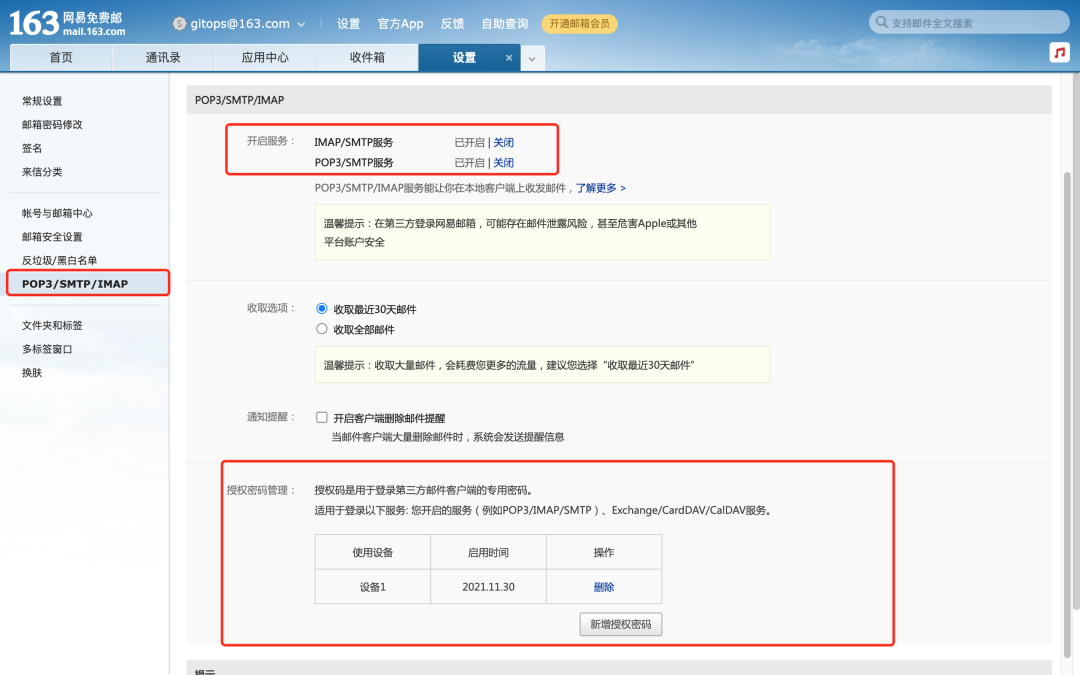
It should be noted that we use 163 mailbox for sending. When configuring smtp, we need to open IMAP/SMTP and POP3/SMTP services in the mailbox and add an authorization code. The password above uses the authorization code for authentication:
Restart Grafana after configuration:
☸ ➜ systemctl daemon-reload
☸ ➜ systemctl restart grafana-server
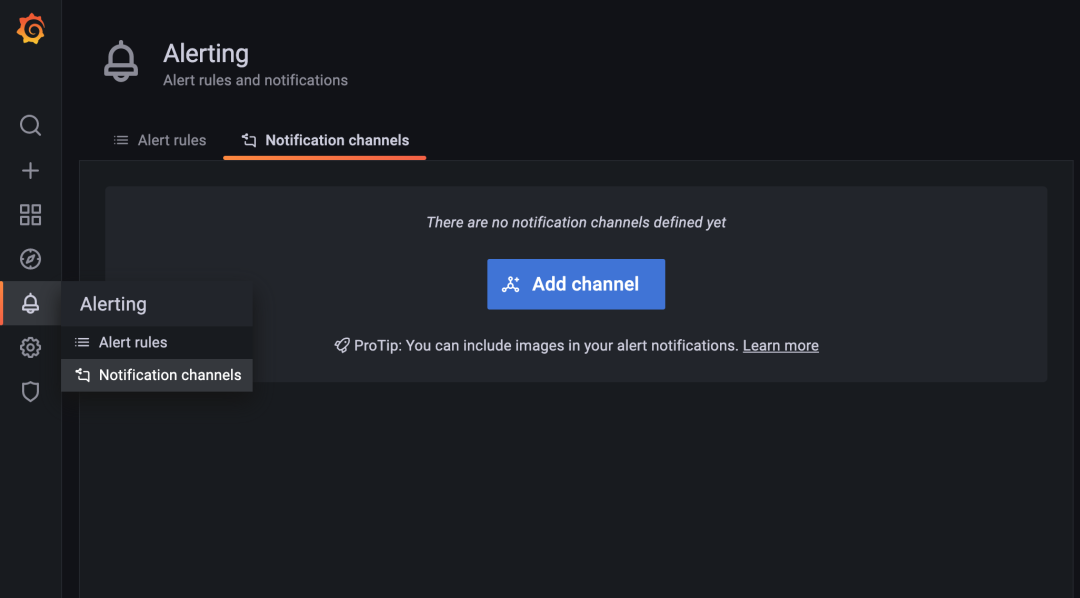
Go back to the Grafana page and click Notification channels on the left to start adding message Notification channels:
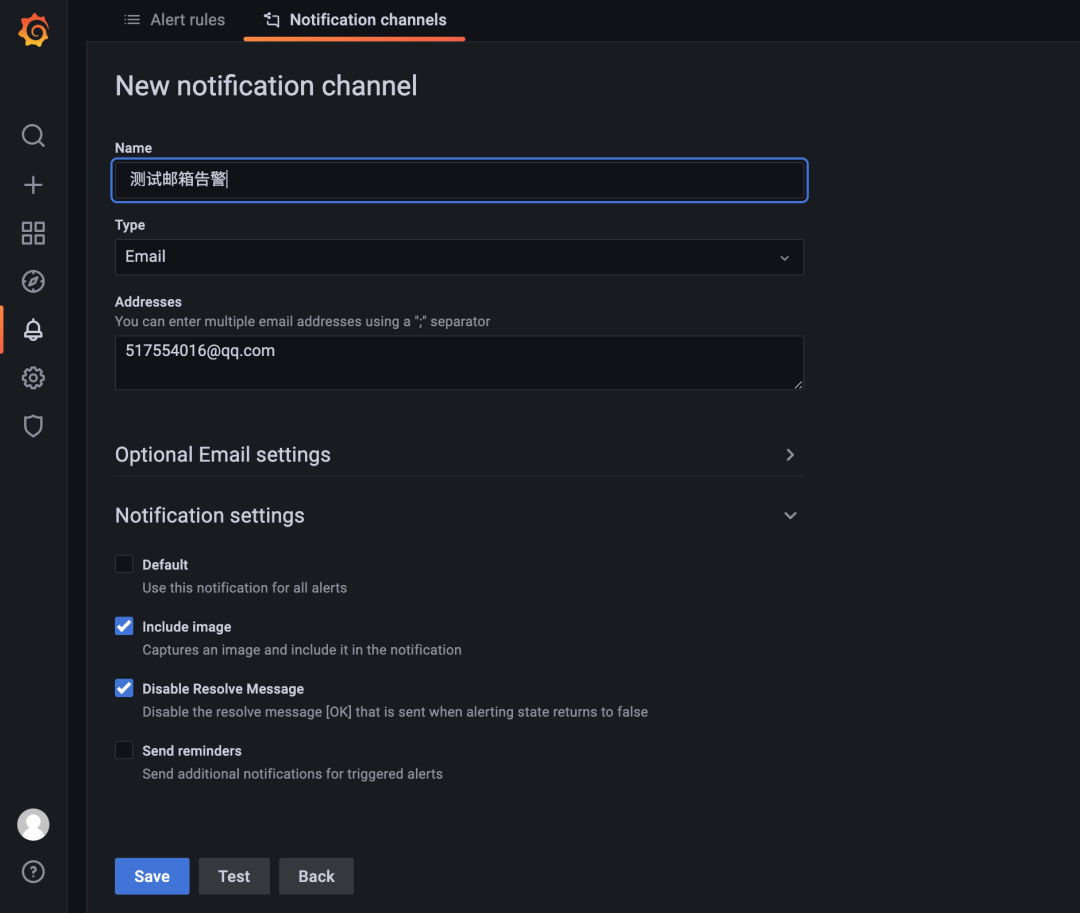
Click Add channel to create a new notification channel. Here, we select the channel type as Email and add the Email address to receive the notification. In addition, we can simply configure the notification:
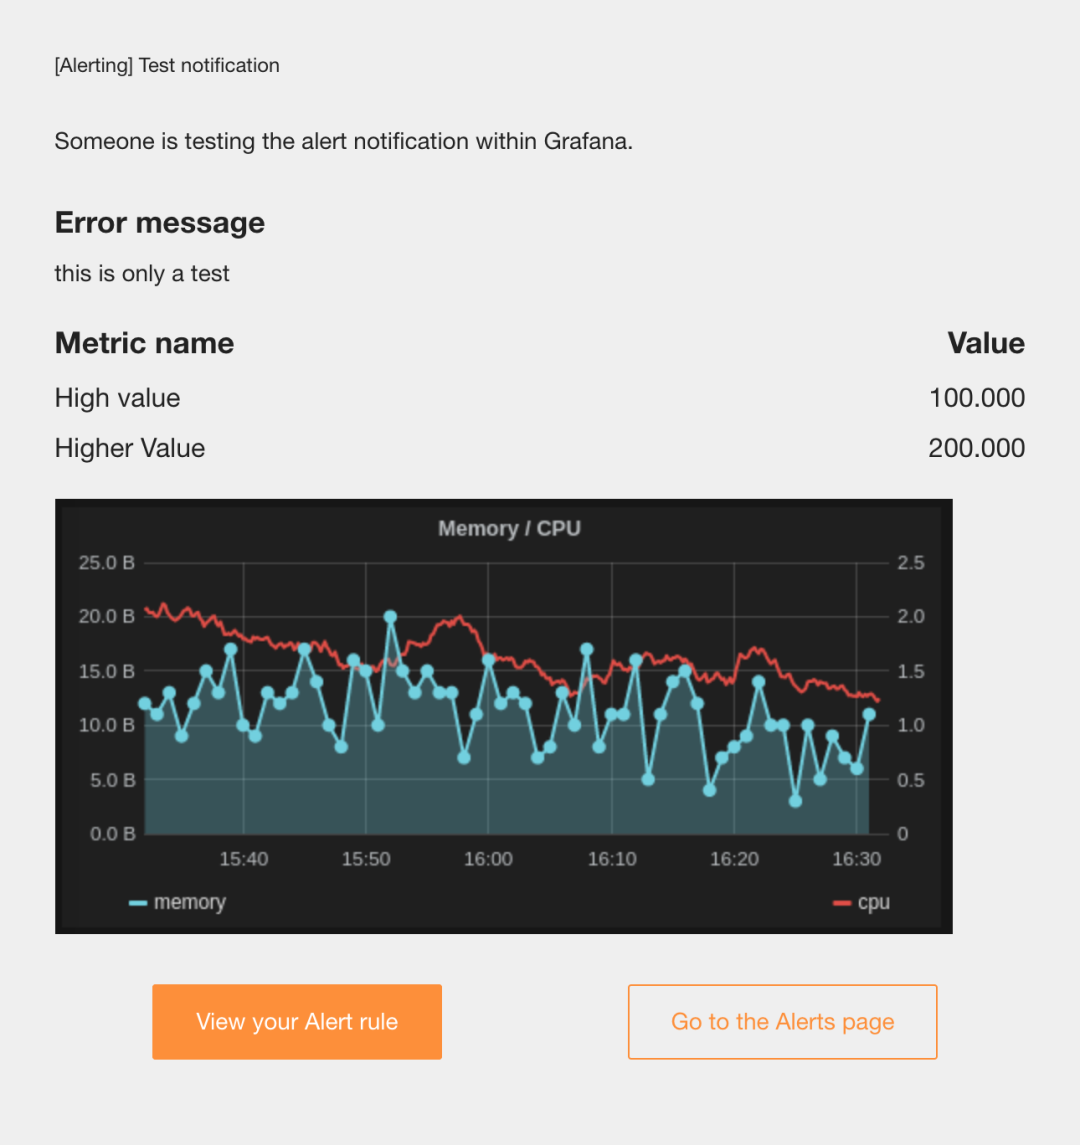
Click the Test button below to Test whether the email can be sent normally. If the prompt of Test notification sent indicates that the email is sent successfully, you can also receive an alarm notification email as shown below:
After the test is successful, click the Save button to save the notification channel.
Nail nail
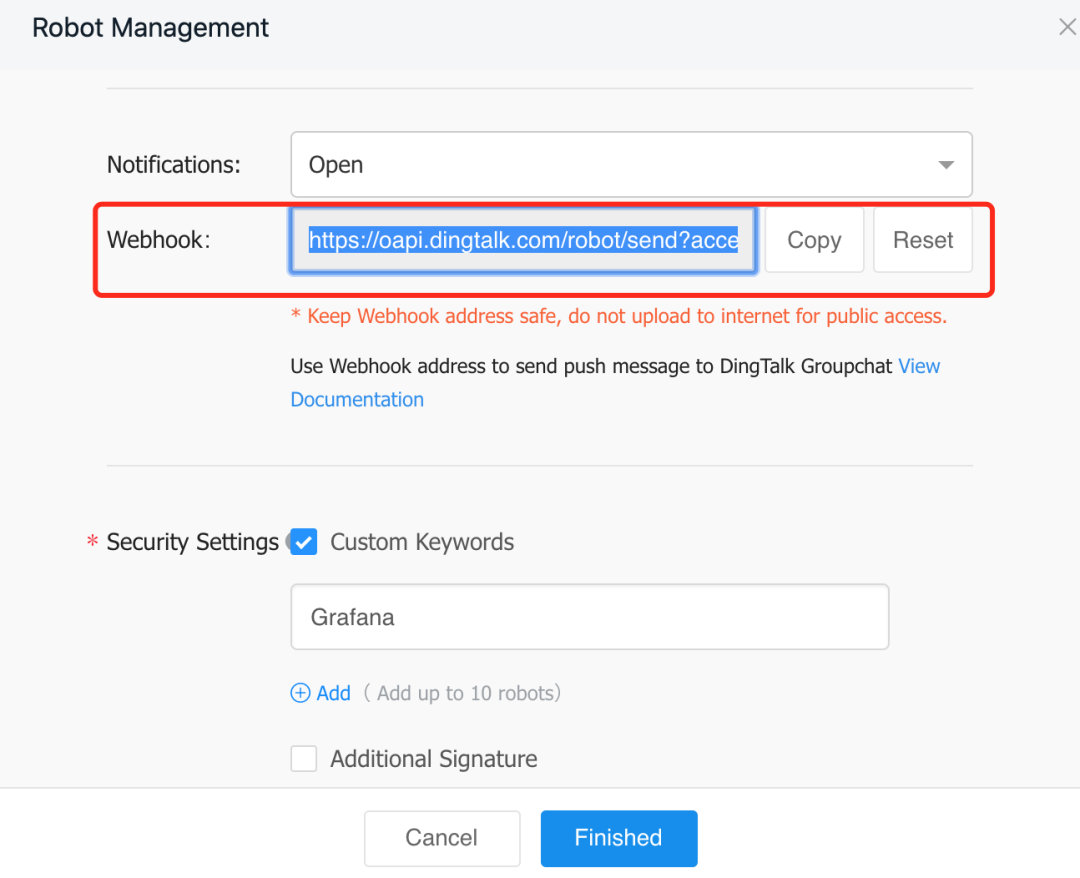
Grafana also has built-in support for nails, so it is very convenient if we want to connect the alarm message to the nail group. To create a user-defined swarm robot, it should be noted that there are three new security authentication methods for nail swarm robots. Here, we can select the keyword method and set the keyword alert:

After creation, a Webhook address will be generated. Copy the address:
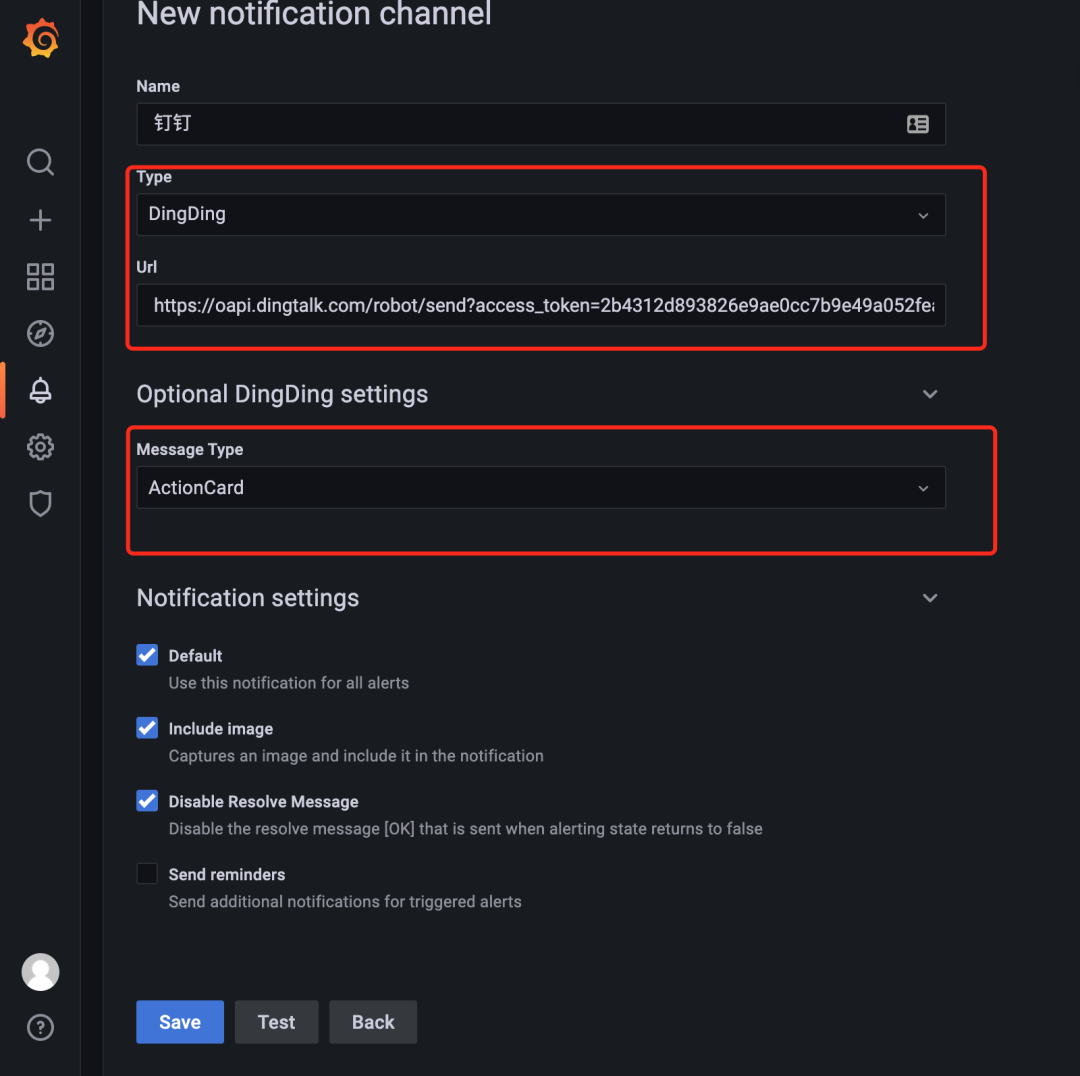
Then go back to Grafana, create a new notification channel, select the type of DingDing, and copy the Webhook address copied above to the Url column:
Similarly, click the Test button to Test the message:
After passing the test, click Save to save the notification channel. In this way, we can create two notification channels, or set a default channel as needed. If there are other channel requirements, we can add them ourselves.
rule
On the left side of the notification channel is an Alert rules tab. Click How to add an alert button at the bottom of the page to prompt if an alert is created:
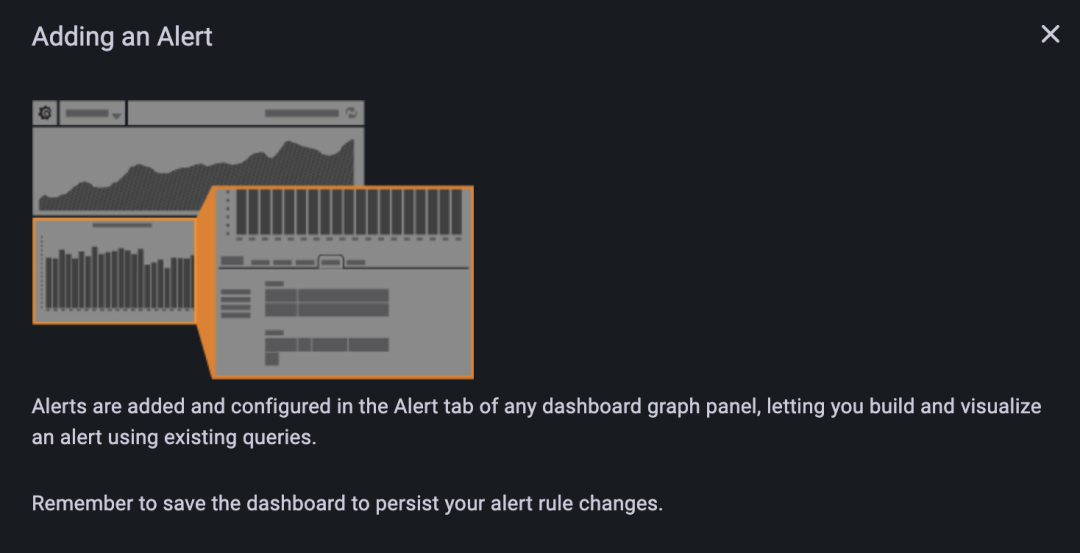
The prompt is very clear. You can add and configure alarms in the Alert tab of any dashboard graphic panel. You can use existing queries to build and visualize alarms. Therefore, we need to go to the dashboard graphic panel for configuration. Here we also describe the panel with CPU utilization.
Enter the panel edit page of CPU utilization:

There are three tabs: Query, Transform and Alert at the bottom of the graphic on the editing page. We have used the first two tabs. Here we need to use the Alert tab:
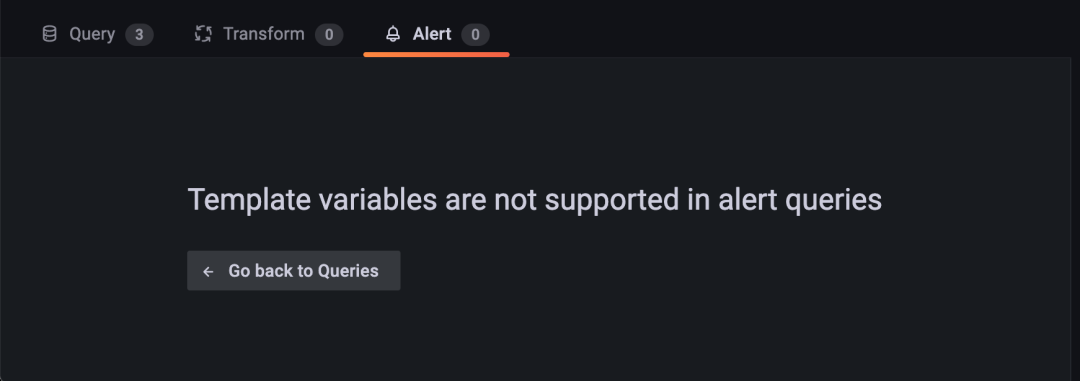
However, when we switch to the Alert tab page, a prompt message such as Template variables are not supported in alert queries appears, which means that template variables are not supported in alarm query, but several variables are defined in our graphic query. How should we deal with this problem?
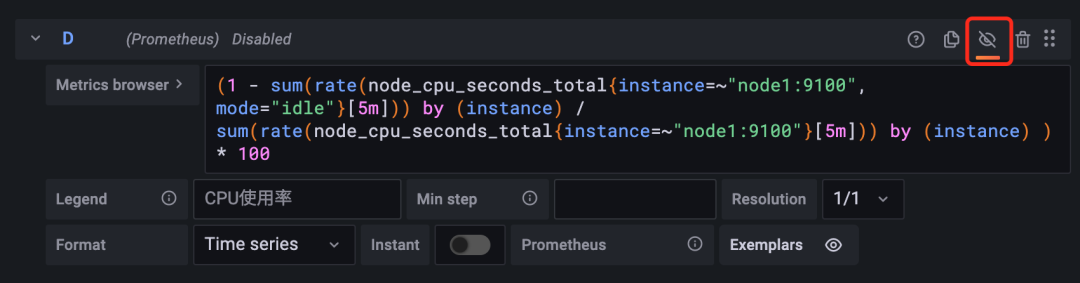
First, we need to add a query statement without variables in the panel, which is used for alarm. For example, we monitor the total utilization of nodes and alarm, and add a new query statement (1 - sum (rate (node_cpu_seconds_total {instance = ~ "node1:9100", mode = "idle"} [5m]) by (instance) / sum (rate (node_cpu_seconds_total {instance = ~ "node1:9100"} [5m]) by (instance)) * 100, remove the use of node parameters. Because Grafana's alarm does not support multidimensional data, we only monitor node1 node for the time being, and then set the query to Disable query, so there will be no indicator data in the chart, because the indicator is used to monitor alarms:
Now we can switch to the Alert tab page to create alarm rules normally:
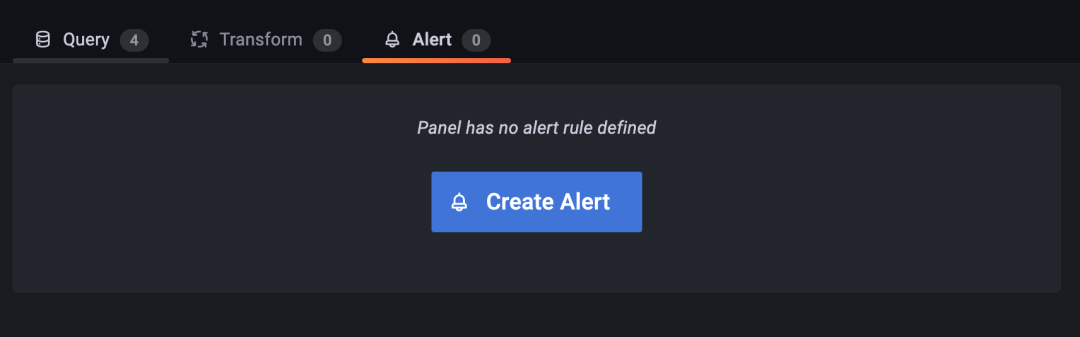
Click the Create Alert button to create an alarm rule:
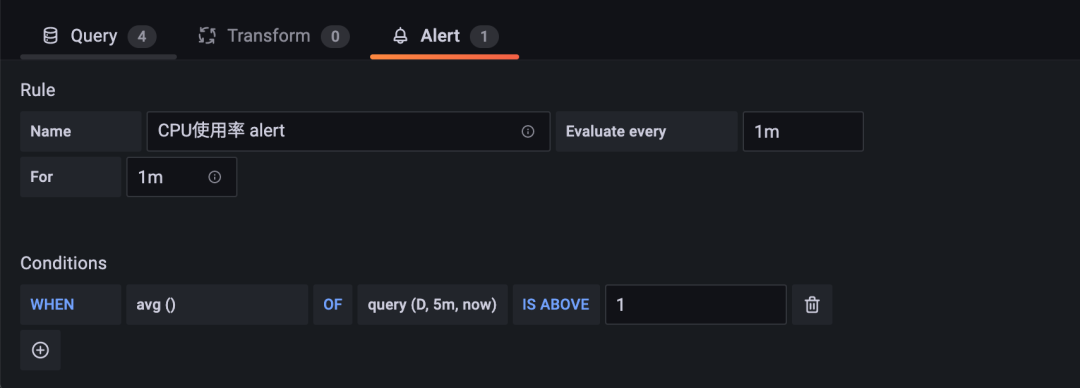
In the Rule Name, add a descriptive name, which is displayed in the alarm rule list. The subsequent Evaluate every indicates the evaluation time. Here, we set 1m, which means that Grafana will evaluate our alarm rule every 1 minute. For indicates the duration of Pending Duration, which means that if the alarm rule lasts for 1m, it means that we really want to go The alarm was triggered.
Then, you can configure the alarm conditions. After WHEN, you can click to select various calculation methods. Here, we select avg() to represent the average value. The query after OF is the statement we really use to monitor the alarm. Click to select the statement for query. Here, we need to select the statement D, query(D, 5m, now) created above It means that the average value OF statement D in the first 5 minutes from now is greater than the threshold OF (IS ABOVE) 1.
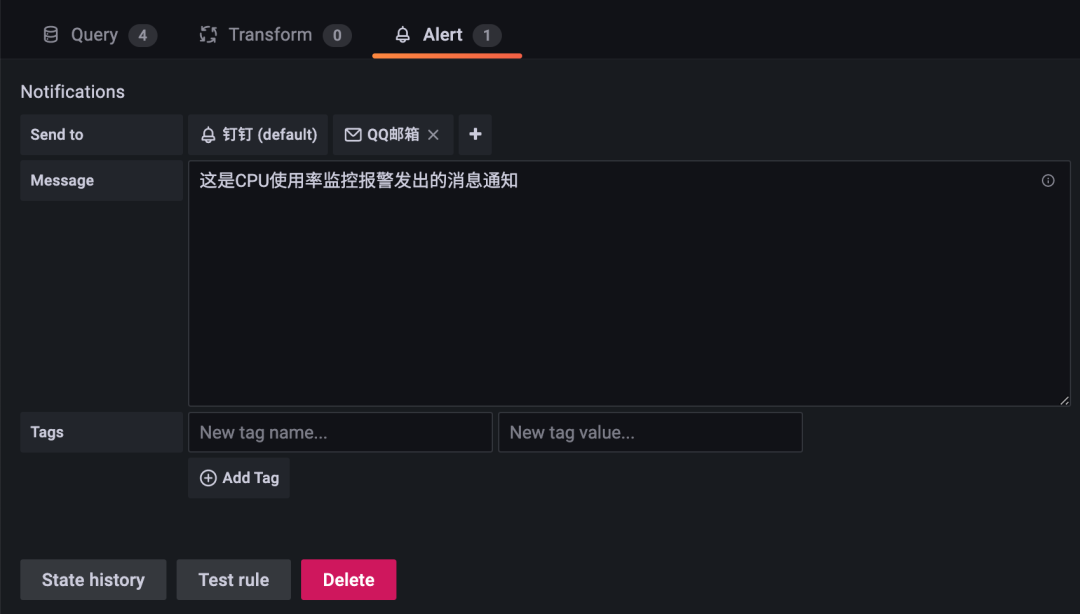
The channels for alarm notification can also be configured below:
After configuration, Apply the panel and save the Dashboard. Normally, the alarm notification can be received every few minutes:
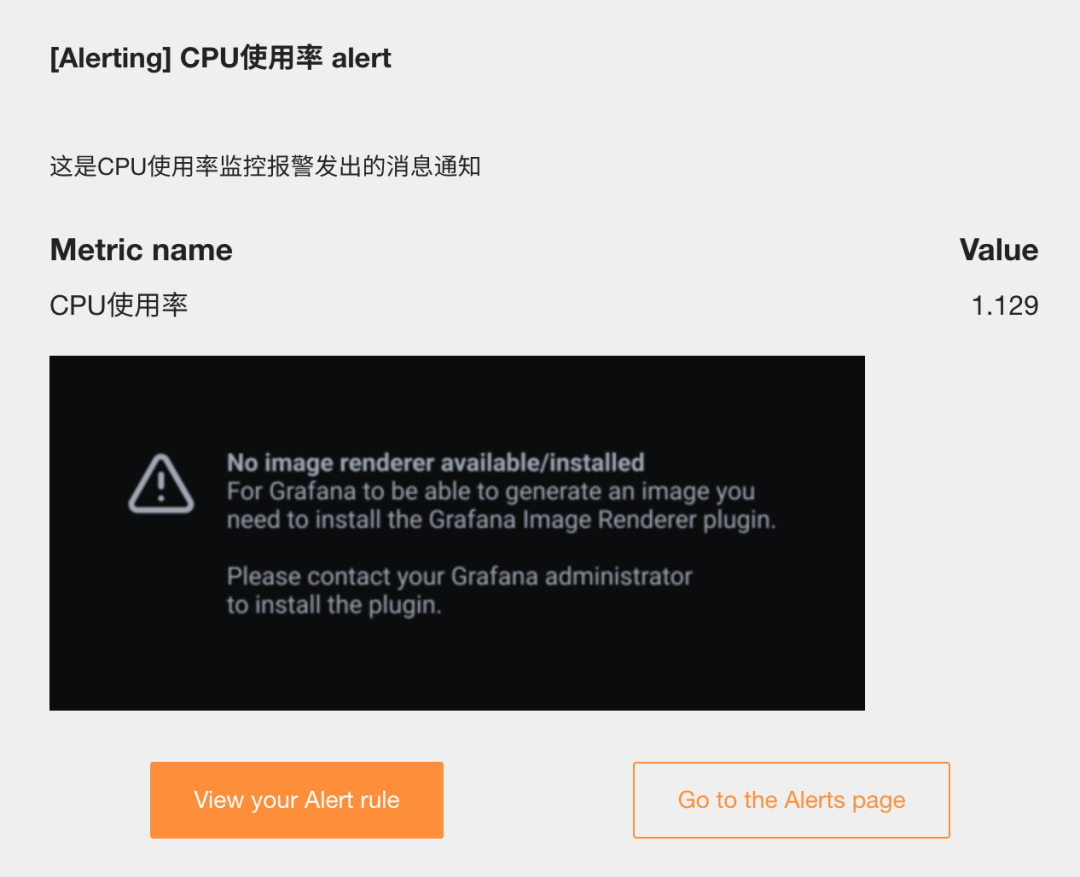
However, the graphics in the notification are not rendered because we did not install the Grafana image renderer plug-in. Execute the following command on the Grafana installation node:
☸ ➜ grafana-cli plugins install grafana-image-renderer

✔ Downloaded grafana-image-renderer v3.3.0 zip successfully

Please restart Grafana after installing plugins. Refer to Grafana documentation for instructions if necessary.
☸ ➜ systemctl restart grafana-server
When the alarm is triggered again, the graphics may not be rendered normally. Check Grafana's log to learn the relevant error information:
☸ ➜ journalctl -u grafana-server -f
......
Nov 30 18:19:01 node2 grafana-server[62536]: t=2021-11-30T18:19:01+0800 lvl=eror msg="Render request failed" logger=plugins.backend pluginId=grafana-image-renderer url="http://localhost:3000/d-solo/oq26nAFnz/nodejie-dian-jian-kong?orgId=1&panelId=2&render=1" error="Error: Failed to launch the browser process!\n/var/lib/grafana/plugins/grafana-image-renderer/chrome-linux/chrome: error while loading shared libraries: libatk-1.0.so.0: cannot open shared object file: No such file or directory\n\n\nTROUBLESHOOTING: https://github.com/puppeteer/puppeteer/blob/main/docs/troubleshooting.md\n"
......
To solve this problem, we need to install several dependent packages of puppeter:
☸ ➜ yum install atk at-spi2-atk libxkbcommon-x11-devel libXcomposite gtk3 -y
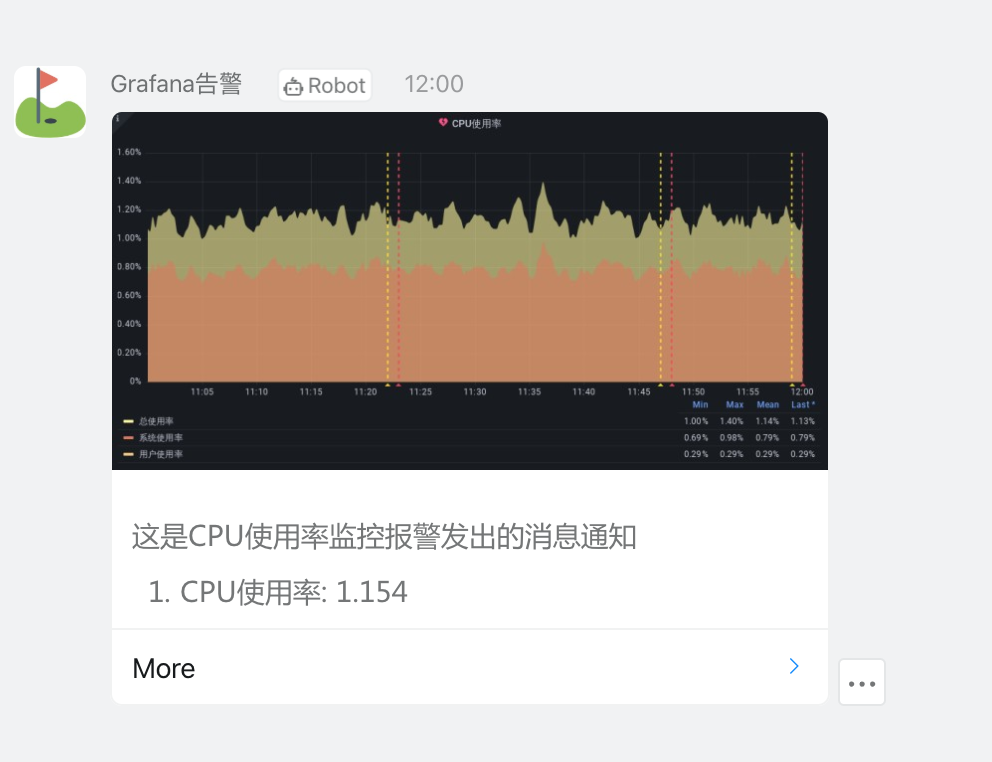
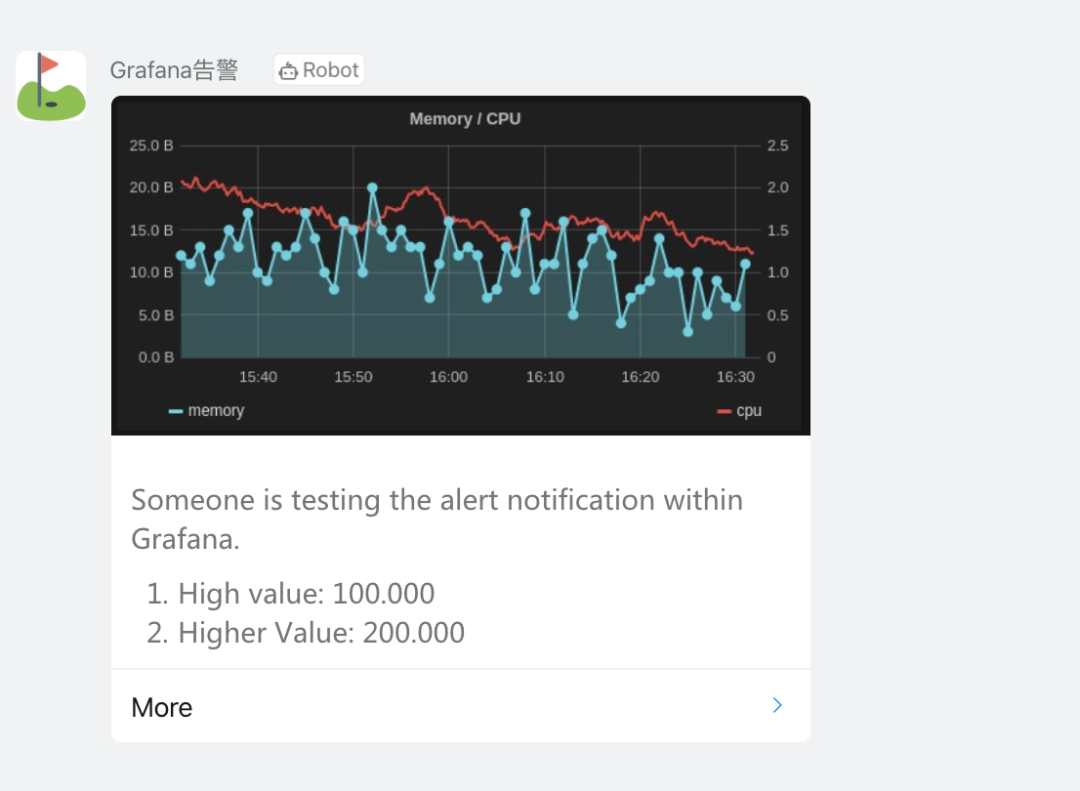
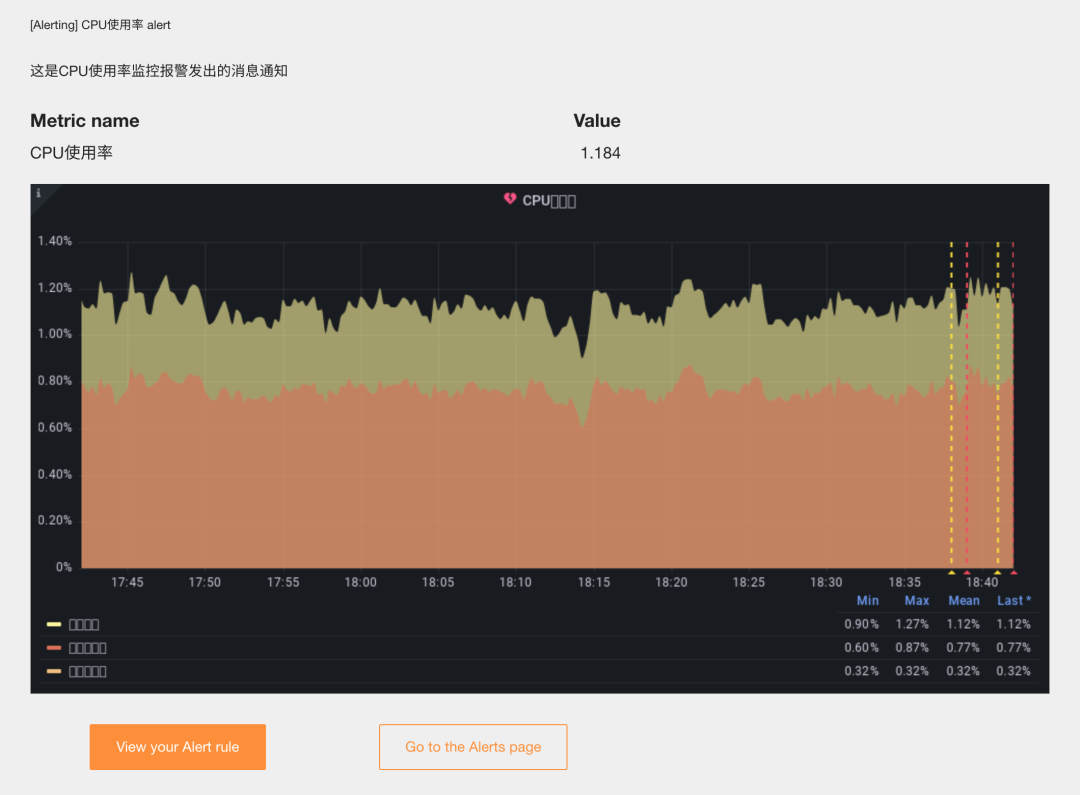
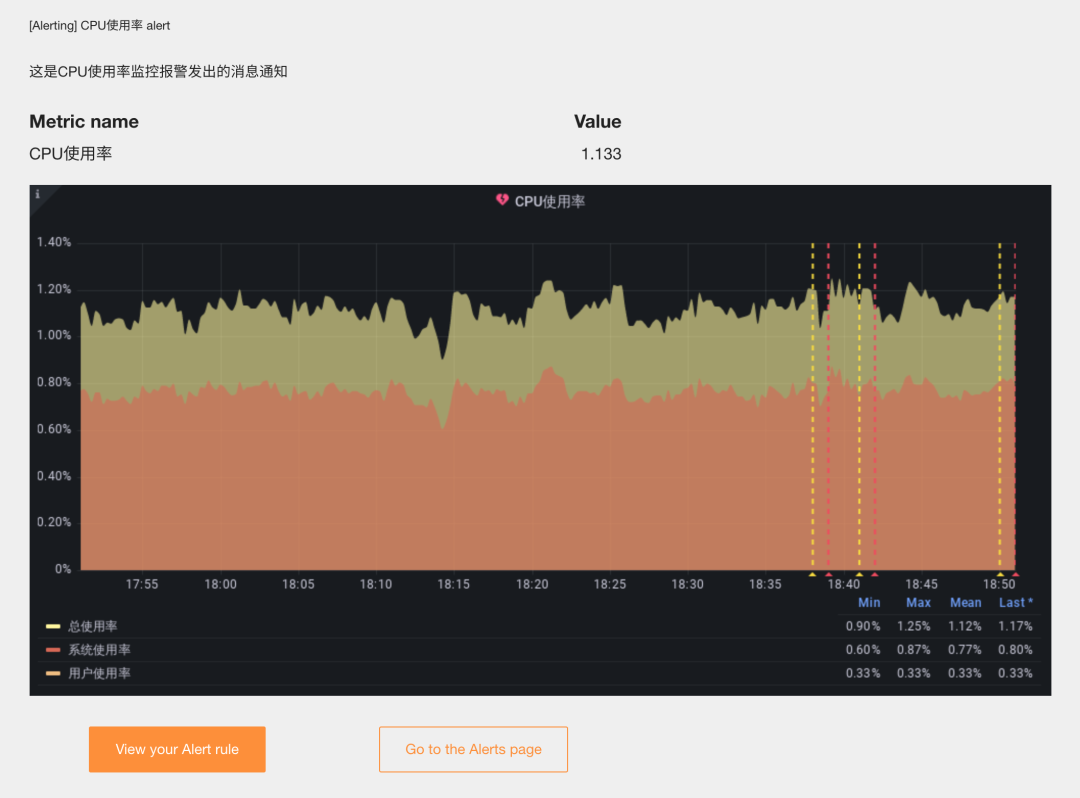
Depending on the alarm message normally received after installation, the notification contains graphic data:
Only the rendered graphics are garbled in Chinese, which is mainly due to the poor support of the Linux font library for Chinese. We only need to install the supported Chinese font library for the Linux system of the server. Here we install the WenQuanYi font library:
☸ ➜ yum search wqy
Loaded plugins: fastestmirror
Loading mirror speeds from cached hostfile
 * base: mirrors.aliyun.com
 * epel: mirrors.bfsu.edu.cn
 * extras: mirrors.aliyun.com
 * updates: mirrors.aliyun.com
================================================ N/S matched: wqy =================================================
wqy-microhei-fonts.noarch : Compact Chinese fonts derived from Droid
wqy-unibit-fonts.noarch : WenQuanYi Unibit Bitmap Font
wqy-zenhei-fonts.noarch : WenQuanYi Zen Hei CJK Font

  Name and summary matches only, use "search all" for everything.

☸ ➜ yum install wqy-microhei-fonts.noarch wqy-unibit-fonts.noarch wqy-zenhei-fonts.noarch -y
At this time, the rendered graphics can be displayed normally:
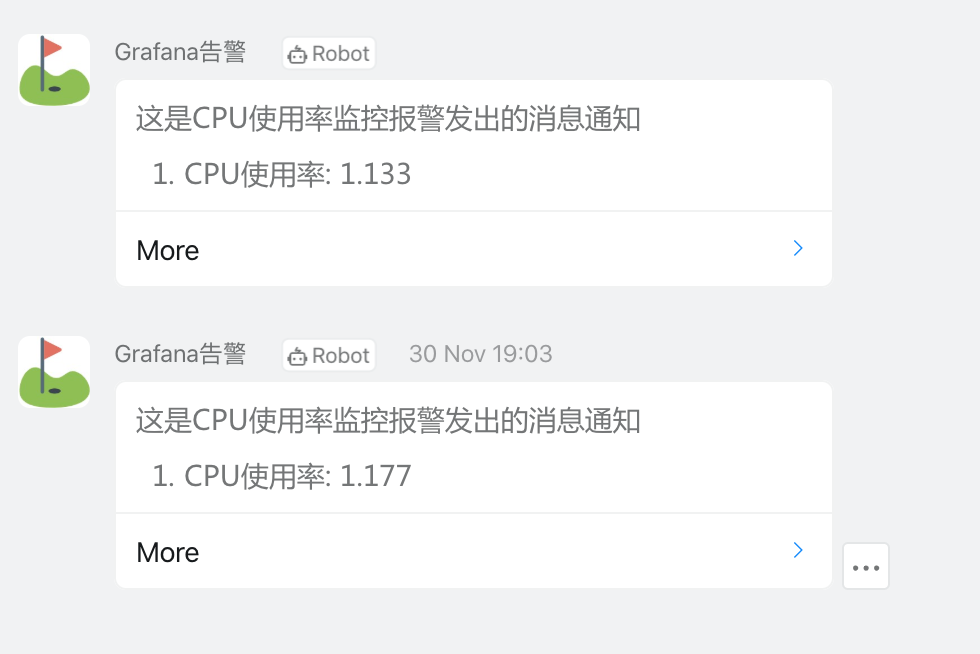
However, the graphic is not displayed in the nailing notice:
This is because the picture in the email alarm notification is sent through the email server and is a picture attachment, so it can be seen normally. However, the alarm channels such as nailing and webhook are directly displayed pictures. Therefore, external storage needs to be set for display. After setting, the picture becomes a picture pointing to external_ image_ The link of the picture address in the storage. If the local computer cannot access the external_ image_ The storage image cannot be displayed, so if it is set to local, the image in the email may not be displayed, because it is a direct image link at this time. But external_image_storage provider s that can be set include s3, webdav, gcs and azure_blob and local. If it is an online service, it is recommended to access object storage, such as s3 service. Here we use Alibaba cloud OSS to configure s3 for explanation.
Configure external in the Grafana configuration file / etc/grafana/grafana.ini_ image_ storage:
#################################### External image storage ##########################
[external_image_storage]
provider = s3  # Using s3 mode

[external_image_storage.s3]
endpoint = oss-cn-beijing.aliyuncs.com
bucket = <bucket>
region = oss-cn-beijing
access_key = <ak>  # Configure using ak and sk in Alibaba cloud background
secret_key = <sk>

#################################### Server ####################################
[server]
domain = 192.168.31.46  # Set Grafana access address to intranet IP
In addition, note that you need to set the access domain name of Grafana to the intranet IP, otherwise you can't access it on other nodes of the LAN. After the configuration is completed, restart Grafana:
☸ ➜ systemctl daemon-reload
☸ ➜ systemctl restart grafana-server
After the configuration is completed, we will trigger the next alarm again, and the pictures received in the mail and nails can be displayed normally: