Good and bad solution distance method
Forerunner chestnut
Limitations of analytic hierarchy process:
- There should not be too many decision-making levels for evaluation. If there are too many, the difference between judgment matrix and consistency matrix may be very large. In the table of average random consistency index RI, n is up to 15
- If the data of indicators in the decision-making level are known, how can we use these data to make the evaluation more accurate
A simple idea:
| full name | achievement | ranking | Revised ranking | score |
|---|---|---|---|---|
| Xiao Ming | 89 | 2 | 3 | 3/10=0.3 |
| Xiao Wang | 60 | 4 | 1 | 1/10=0.1 |
| Xiao Zhang | 74 | 3 | 2 | 2/10=0.2 |
| cool breeze | 99 | 1 | 4 | 4/10=0.4 |
PS: the significance of the correction is to make the ranking conform to the previous analytic hierarchy process. The higher the ranking, the better the representation ability, and the higher the weighted value
However, the above ideas are also unreasonable:
Only the ranking is used to normalize and weight the score, so that the difference in score is not obvious (Xiao Wang's 0 score is also 0.1, and the score will not change as long as he is the last one).
The scores obtained in this way are correlated, but the correlation is not very strong.
So we can improve it in the following ways:
Scoring formula
( x − m i n ) / ( m a x − m i n ) (x-min)/(max-min) (x−min)/(max−min)
( x − m i n ) / [ ( m a x − x ) + ( x − m i n ) ] (x-min)/[(max-x)+(x-min)] (x−min)/[(max−x)+(x−min)]
It can be regarded as:
x
And
most
Small
value
of
distance
leave
/
(
x
And
most
large
value
of
distance
leave
+
x
And
most
Small
value
of
distance
leave
)
Distance from x to min / (distance from x to MAX + distance from x to min)
Distance from x to min / (distance from x to MAX + distance from x to min)
| full name | achievement | Non normalized score | Normalized score |
|---|---|---|---|
| Xiao Ming | 89 | (89-60)/(99-60)=0.74 | 0.74/2.1=0.35 |
| Xiao Wang | 60 | (60-60)/(99-60)=0 | 0/2.1=0 |
| Xiao Zhang | 74 | (74-60)/(99-60)=0.36 | 0.36/2.1=0.17 |
| cool breeze | 99 | (99-60)/(99-60)=1 | 1/2.1=0.48 |
PS: some people may have questions. Why don't max take 100 and min take 0? Doesn't it look clearer? (table below)
| full name | achievement | Non normalized score | Normalized score |
|---|---|---|---|
| Xiao Ming | 89 | 0.89 | 0.28 |
| Xiao Wang | 60 | 0.60 | 0.19 |
| Xiao Zhang | 74 | 0.74 | 0.23 |
| cool breeze | 99 | 0.99 | 0.30 |
reason:
- The comparison objects are generally much larger than two (for example, compare the scores of all students in a class)
- The indicators of comparison are often more than one aspect, such as grades, working hours, extracurricular competition scores and so on
- There are many indicators that often have no maximum or minimum value, such as GDP growth, an indicator to measure the level of economic growth
Increase the number of indicators
| full name | achievement | Number of arguments with others |
|---|---|---|
| Xiao Ming | 89 | 2 |
| Xiao Wang | 60 | 0 |
| Xiao Zhang | 74 | 1 |
| cool breeze | 99 | 3 |
Very large index (benefit index): the greater the achievement, the better
Very small indicators (cost indicators): the fewer arguments with others, the better
Index forward
Converting all indicators to very large is called indicator forward (professional terminology)
How to forward the index: Max-X (minimum to maximum)
| full name | achievement | Number of arguments with others | Positive quarrel |
|---|---|---|---|
| Xiao Ming | 89 | 2 | 1 |
| Xiao Wang | 60 | 0 | 3 |
| Xiao Zhang | 74 | 1 | 2 |
| cool breeze | 99 | 3 | 0 |
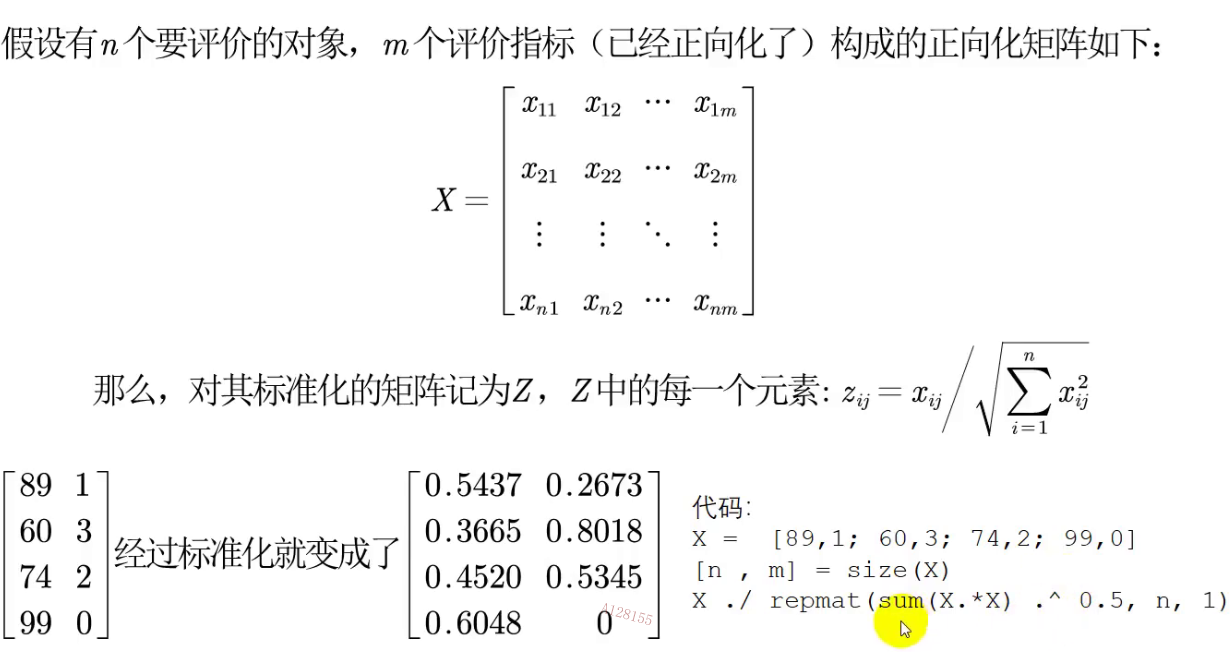
Standardized treatment
The units of the two evaluation indicators are different
- Leave a hole: why is standardization this formula? Why not eliminate the sum of n*Xij/(Xij) directly
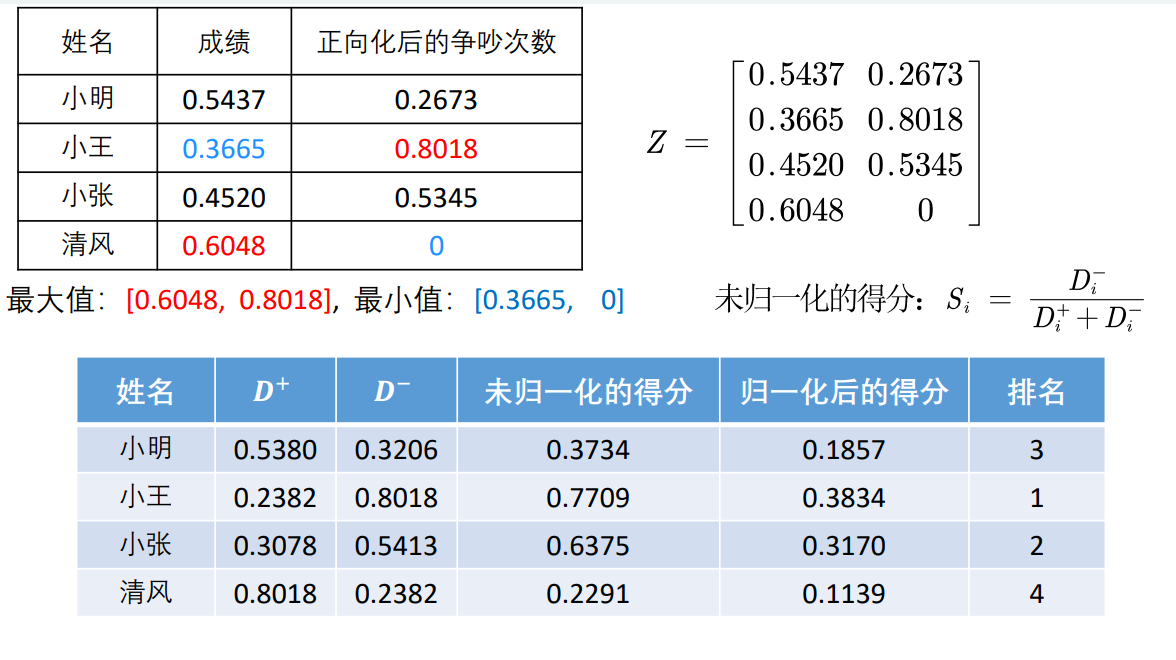
TOPSIS
C.L.Hwang and K.Yoon first proposed TOPSIS (technology for order preference by similarity to an ideal solution) in 1981, which can be translated into the ranking method of approximate ideal solutions, which is often referred to as the distance method of superior and inferior solutions in China.
TOPSIS is a commonly used comprehensive evaluation method, which can make full use of the information of the original data, and its results can accurately reflect the gap between the evaluation schemes.
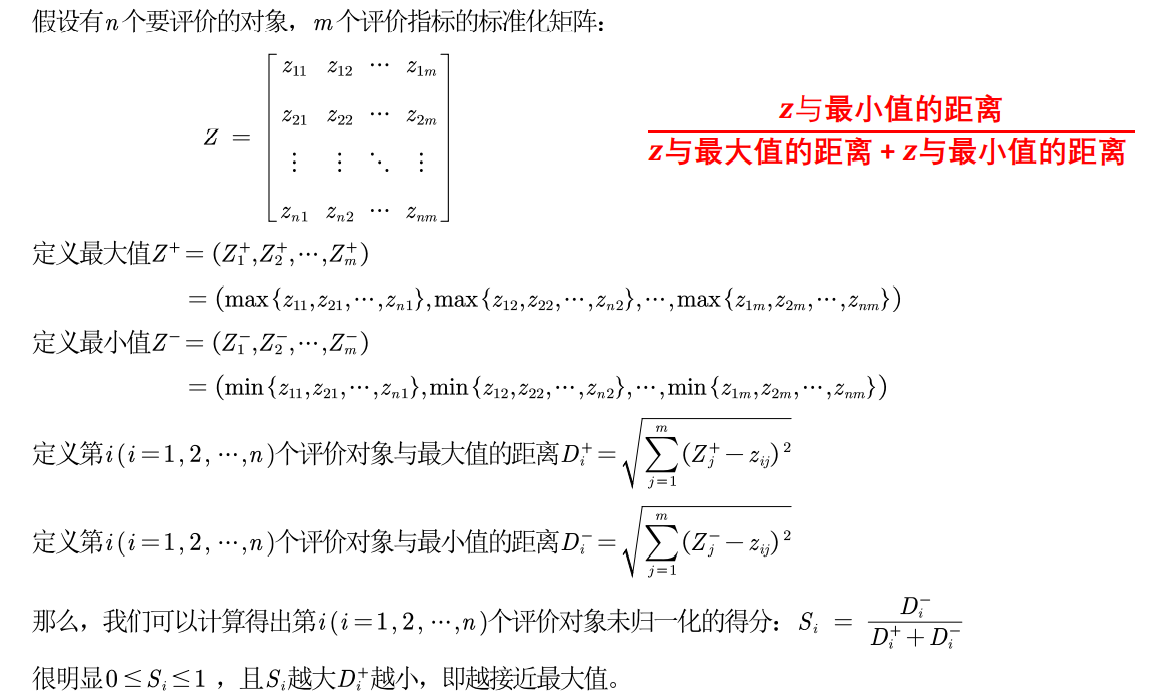
The basic process is to unify the original data matrix with the index type (general forward processing) to obtain the forward matrix, then standardize the forward matrix to eliminate the influence of each index dimension, find the optimal scheme and the worst scheme in the limited scheme, and then calculate the distance between each evaluation object and the optimal scheme and the worst scheme respectively, The relative proximity between each evaluation image and the optimal scheme is obtained as the basis for evaluating the advantages and disadvantages. This method has no strict restrictions on the data distribution and sample size, and the data calculation is simple and easy.
Forward
The four most common indicators
| Indicator name | Index characteristics | example |
|---|---|---|
| Very large | The bigger the better | Achievements, GDP growth, corporate profits |
| Very small | The smaller the better | Cost and pollution degree |
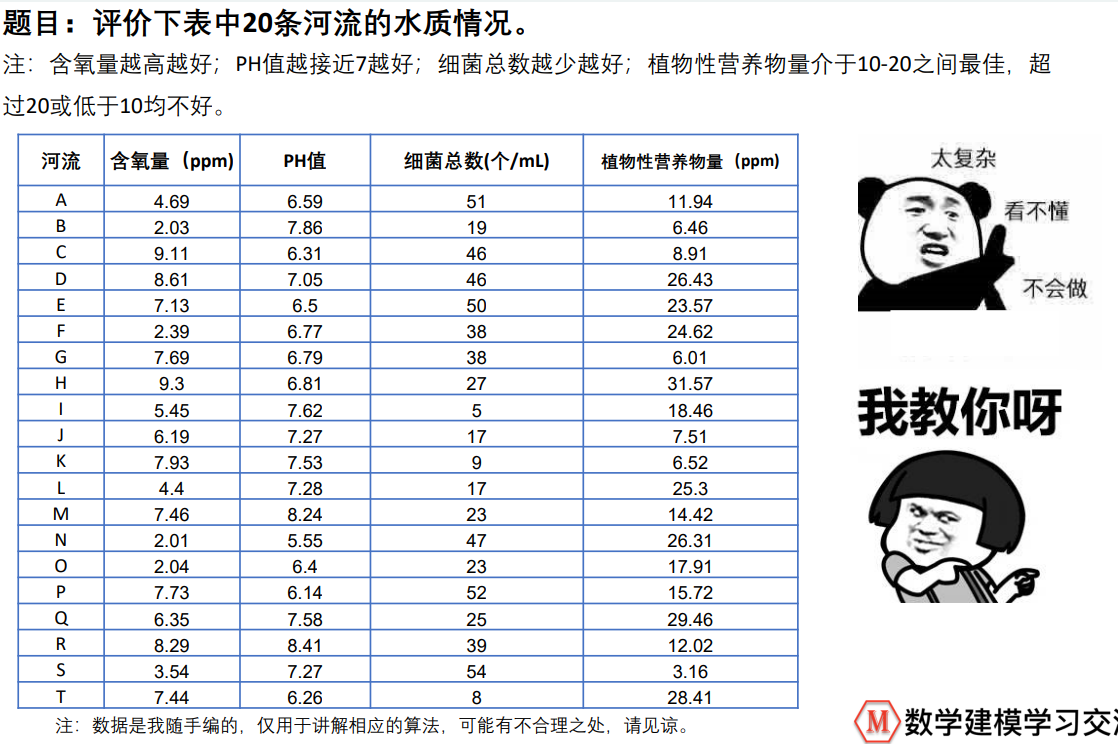
| Intermediate type | The closer you get to a value, the better | PH value during water quality assessment |
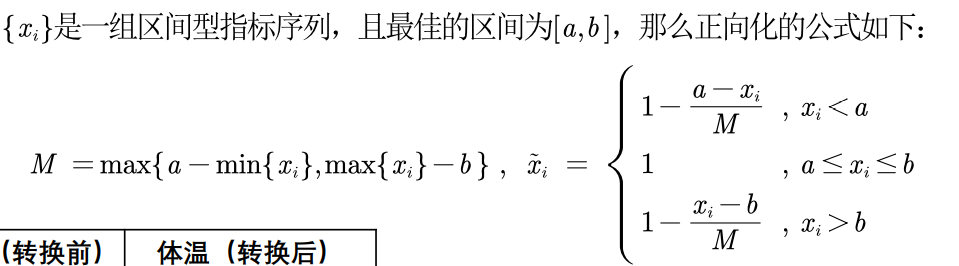
| Interval type | It's best to fall in a certain range | Body temperature and amount of plant nutrients in water |
The so-called forward transformation of the original matrix is to uniformly convert all indicator types into very large indicators (the conversion function is not unique, see the specific example).
Very small indicators - > very large indicators
m a x − x or 1 / x max-x or 1/x max − x or 1/x
Intermediate index - > very large index
M = m a x ∣ X i − X b e s t ∣ M=max{|Xi-Xbest|} M=max∣Xi−Xbest∣
x i = 1 − [ ( X i − X b e s t ) / M ] xi=1-[(Xi-Xbest)/M] xi=1−[(Xi−Xbest)/M]
Interval index - > very large index
Standardization
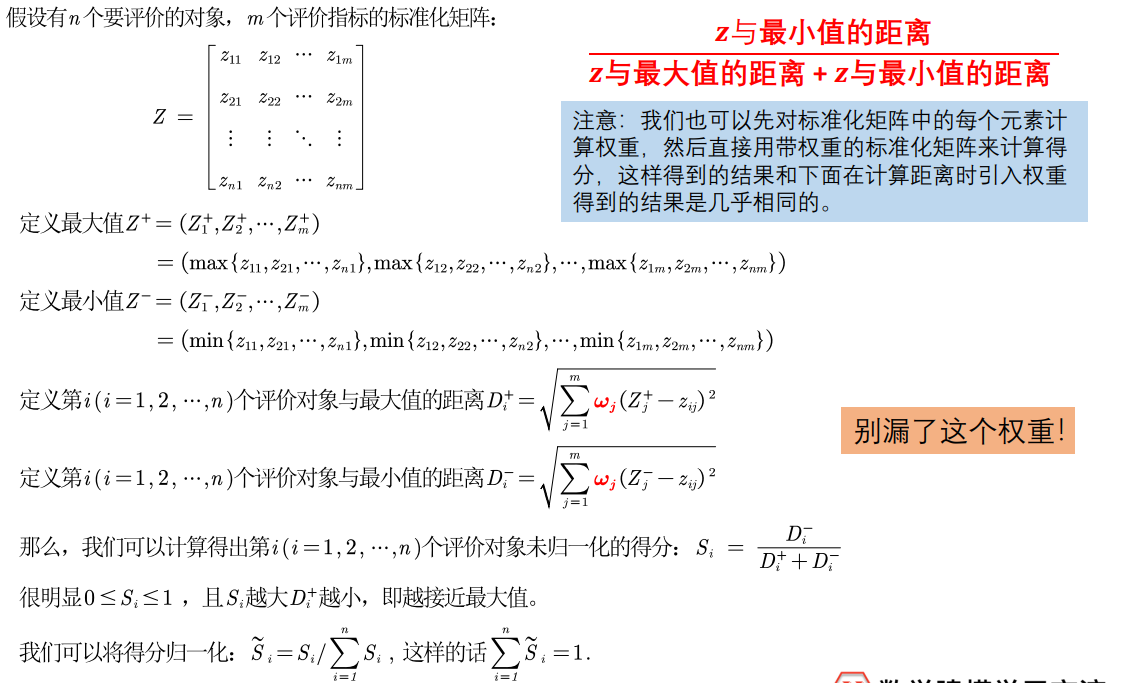
Analytic hierarchy process can be used to determine the weight of these m indicators
- Of course, the subjectivity of analytic hierarchy process is too strong. It is more recommended to use entropy weight method for objective assignment (make up after leaving the pit).
normalization
Small case
subject
Answer code
topsis.m
%%  Step 1: copy the data to the workspace and name the matrix X
% (1)Right click in the workspace and click new( Ctrl+N),The input variable name is X
% (2)stay Excel Copy data in and back to Excel Middle right click and click Paste Excel Data( Ctrl+Shift+V)
% (3)Close this window and click X Variable, right click Save as, save as mat File (no need to copy and paste next time, just use load Command to load data)
% (4)Note that the code and data should be placed in the same directory, and Matlab The current folder of is also this directory.
clear;clc
load data_water_quality.mat
%% Note: if prompted: Wrong use load,Unable to read file 'data_water_quality.mat'. There are no such files or directories.
% So the reason is because of your Matlab This file does not exist in the current folder of
% have access to cd Function modification Matlab Current folder for
% For example, my code and data are in: D:Lesson 2.TOPSIS Method (good and bad solution distance method)\Code and example data
% Then I can enter the command:
% cd 'D:Lesson 2.TOPSIS Method (good and bad solution distance method)\Code and example data'
% You can also watch my updated video: "update 9_Topsis Why did the code fail_How to visualize the score results and how to determine the weight more accurately ", which is introduced

%%  Step 2: determine whether to forward
[n,m] = size(X);
disp(['share' num2str(n) 'Evaluation objects, ' num2str(m) 'Evaluation index'])
Judge = input(['this' num2str(m) 'Whether indicators need to be processed forward, please enter 1 instead of 0:  ']);

if Judge == 1
    Position = input('Please enter the column of the indicator to be processed forward. For example, if columns 2, 3 and 6 need to be processed, you need to enter[2,3,6]:  '); %[2,3,4]
    disp('Please enter the indicator type of these columns to be processed (1: very small, 2: intermediate, 3: interval) ')
    Type = input('For example, if column 2 is very small, column 3 is interval type, and column 6 is intermediate type, enter[1,3,2]:   '); %[2,1,3]
    % be careful, Position and Type Are two row vectors of the same dimension
    for i = 1 : size(Position,2)  %These columns need to be processed separately, so we need to know the total number of times to be processed, that is, the number of cycles
        X(:,Position(i)) = Positivization(X(:,Position(i)),Type(i),Position(i));
    % Positivization It is a function defined by ourselves. Its function is to forward. It receives three parameters in total
    % The first parameter is the column of vectors to forward X(:,Position(i))   Review the knowledge of the previous lecture, X(:,n)Means take the second n All elements of the column
    % The second parameter is the indicator type of the corresponding column (1: very small, 2: intermediate, 3: interval)
    % The third parameter tells the function which column in the original matrix we are dealing with
    % The function has a return value, which returns the index after forward. We can directly assign it to the column vector we originally want to process
    end
    disp('Forward matrix X =  ')
    disp(X)
end

%% Step 3: standardize the forward matrix
Z = X ./ repmat(sum(X.*X) .^ 0.5, n, 1);
disp('Standardized matrix Z = ')
disp(Z)

%% Step 4: calculate the distance from the maximum value and the minimum value, and calculate the score
D_P = sum([(Z - repmat(max(Z),n,1)) .^ 2 ],2) .^ 0.5;   % D+ Distance vector from maximum
D_N = sum([(Z - repmat(min(Z),n,1)) .^ 2 ],2) .^ 0.5;   % D- Distance vector from minimum
S = D_N ./ (D_P+D_N);    % Non normalized score
disp('The final score is:')
stand_S = S / sum(S)
[sorted_S,index] = sort(stand_S ,'descend')

% A = magic(5)  % Magic square matrix
% M = magic(n)Return from 1 to n^2 And the total number of rows is equal to the total number of columns n×n Matrix. Order n Must be a scalar greater than or equal to 3.
% sort(A)if A Is a vector. Whether it is a column or row vector, it is true by default A Sort in ascending order. sort(A)Is the default ascending order, and sort(A,'descend')Is a descending sort.
% sort(A)if A Is a matrix. The default is yes A The columns of are arranged in ascending order
% sort(A,dim)
% dim=1 Time equivalent sort(A)
% dim=2 When yes, it means yes A The elements in each row are arranged in ascending order
% A = [2,1,3,8]
% Matlab To sort one-dimensional vectors in sort Function: sort(A),Sorting is in ascending order, where A Is the vector to be sorted;
% Available if you want to keep the index before the arrangement [sA,index] = sort(A,'descend') ,After sorting, sA Is a sorted vector, index It's a vector sA Middle pair A Index of.
% sA  =  8     3     2     1
% index =  4     3     1     2
Positivization.m
% function [Output variable] = Function name((input variable)
% The middle part of the function is the function body
% At the end of the function end ending
% There can be multiple output variables and input variables, separated by commas
% function [a,b,c]=test(d,e,f)
%     a=d+e;
%     b=e+f;
%     c=f+d;
% end
% Custom functions should be placed in a separate m Files cannot be placed directly in the main function (different from most other languages)

function [posit_x] = Positivization(x,type,i)
% There are three input variables:
% x: The original column vector corresponding to the indicator that needs forward processing
% type:  Type of indicator (1: very small, 2: intermediate, 3: interval)
% i: Which column in the original matrix is being processed
% Output variable posit_x Represents: the forward column vector
    if type == 1  %Very small
        disp(['The first' num2str(i) 'Columns are very small and are being normalized'] )
        posit_x = Min2Max(x);  %call Min2Max Function to forward
        disp(['The first' num2str(i) 'Column miniaturization forward processing completed'] )
        disp('~~~~~~~~~~~~~~~~~~~~Dividing line~~~~~~~~~~~~~~~~~~~~')
    elseif type == 2  %Intermediate type
        disp(['The first' num2str(i) 'Column is intermediate'] )
        best = input('Please enter the best value: ');
        posit_x = Mid2Max(x,best);
        disp(['The first' num2str(i) 'Column intermediate type forward processing completed'] )
        disp('~~~~~~~~~~~~~~~~~~~~Dividing line~~~~~~~~~~~~~~~~~~~~')
    elseif type == 3  %Interval type
        disp(['The first' num2str(i) 'Column is interval type'] )
        a = input('Please enter the lower bound of the interval: ');
        b = input('Please enter the upper bound of the interval: ');
        posit_x = Inter2Max(x,a,b);
        disp(['The first' num2str(i) 'Column interval type forward processing completed'] )
        disp('~~~~~~~~~~~~~~~~~~~~Dividing line~~~~~~~~~~~~~~~~~~~~')
    else
        disp('There is no indicator of this type, please check Type Is there any value in the vector other than 1, 2 and 3')
    end
end
Min2Max.m
function [posit_x] = Min2Max(x)
    posit_x = max(x) - x;
     %posit_x = 1 ./ x;    %If x All are greater than 0, which can also be forward
end
Mid2Max.m
function [posit_x] = Mid2Max(x,best)
    M = max(abs(x-best));
    posit_x = 1 - abs(x-best) / M;
end
Inter2Max.m
function [posit_x] = Inter2Max(x,a,b)
    r_x = size(x,1);  % row of x
    M = max([a-min(x),max(x)-b]);
    posit_x = zeros(r_x,1);   %zeros Function usage: zeros(3)  zeros(3,1)  ones(3)
    % initialization posit_x The purpose of all 0 initialization is to save processing time
    for i = 1: r_x
        if x(i) < a
           posit_x(i) = 1-(a-x(i))/M;
        elseif x(i) > b
           posit_x(i) = 1-(x(i)-b)/M;
        else
           posit_x(i) = 1;
        end
    end
end