The theoretical basis of Distributed Service Tracking in the industry today comes mainly from Google's paper "Dapper, a Large-Scale Distributed Systems Tracing Infrastructure". The most widely used open source implementation is Zipkin of Twitter. To achieve platform-independent, vendor-independent distributed service tracing, CNCF released Open Tracing, the standard for distributed service tracing.In China, Eagle Eye of Taobao, Hydra of Jingdong, CAT of public comment, Watchman of Sina, Microscope of tastefulness, Tracing of pit net are all such systems.
A distributed service tracking system consists of three main components: data collection, data storage, and data display.The structure of each part varies depending on the size of the system.For example, for large-scale distributed systems, data storage can be divided into real-time data and full data, real-time data for troubleshooting (Trouble)Shooting), full data for system optimization; data collection includes asynchronous data collection (need to track messages in queues, ensure consistency of calls) and less intrusive data collection in addition to supporting platform-independent and language-independent systems; data display also involves data mining and analysis.Although each part can become complex, the basic principles are similar.
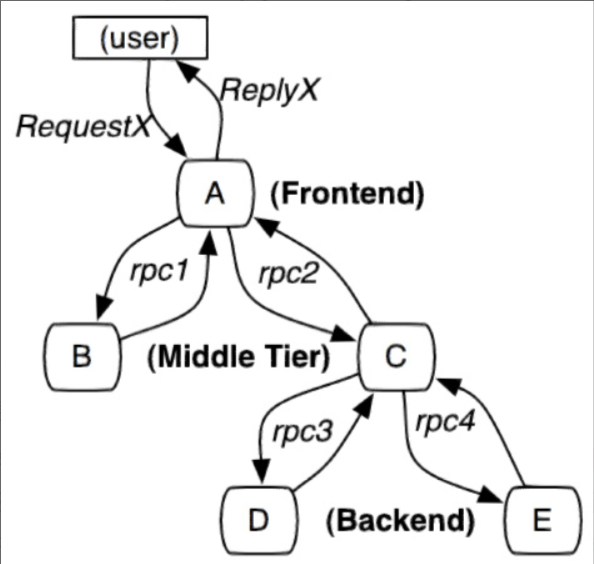
A tracking unit for service tracking is a process that begins when a customer initiates a request to reach the boundary of the tracked system and ends when the tracked system returns a response to the customer, called a trace.Several services are invoked in each trace. To record which services are invoked and how long each invocation takes, a call record, called a span, is embedded each time a service is invoked.In this way, several ordered spans form a trace.In the process of providing services to the outside world, requests and responses occur continuously, which in turn generates traces, which can be recorded with spans to depict a service topology of the system.Including information such as response time in the space and whether the request was successful or not, you can find abnormal services when problems occur and, based on historical data, analyze where performance is poor and target performance optimization from the overall system level.
SpringCloud Sleuth also provides us with a complete set of solutions.Sleuth provides link tracking for calls between services, and through Sleuth it is clear which services a service request passes through and how long each service takes to process.This allows us to easily clarify the call relationship between micro services.In addition, Sleuth can help us:
Time-consuming analysis: Sleuth makes it easy to understand how long each sample request takes to analyze which service calls are time-consuming;
Visualization error: Exceptions that are not caught by the program can be seen on the integrated Zipkin service interface;
Link optimization: For services that are frequently invoked, some optimization measures can be implemented for these services.
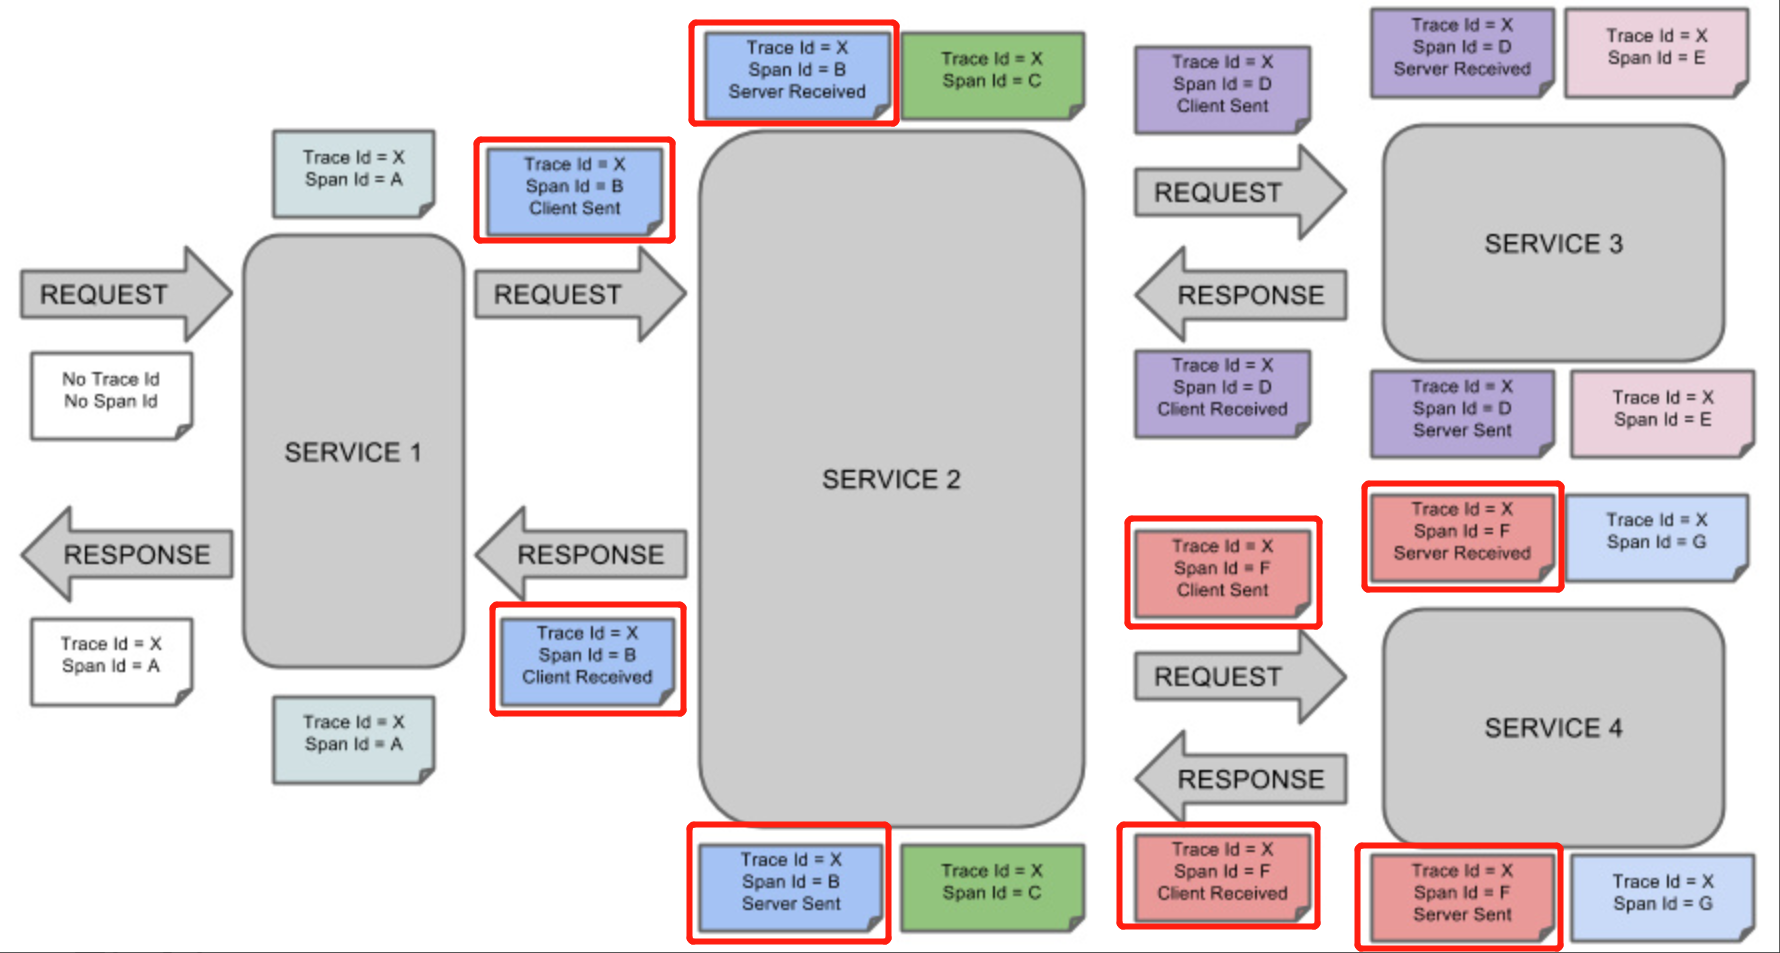
Conceptual diagram of Spring Cloud Sleuth, in which the part of the circle is Sleuth's marker (Annotation), a label can be interpreted as a snapshot of data at important moments in the life cycle of a space, such as a label that usually contains information such as the time stamp, event type (value), endpoint, and so on, representing:
Client sends client send: Client has sent request.This marker biao depicts the beginning of the span.
Server receives: Server receives requests and begins processing.
server send: Mark when the request is processed (when the response is sent back to the client).
Client receives client: indicates the end of the span and the client has successfully received a response from the server.
With these four tags, we can calculate the corresponding four values:
Request Delay=sr-cs
- Response Delay cr-ss
Server processing time: ss-sr
Client request time: cr-cs = request delay + response delay + server processing time
Getting Started with SpringCloud Sleuth
<!-- 1. join POM rely on -->
<dependency>
    <groupId>org.springframework.cloud</groupId>
    <artifactId>spring-cloud-starter-sleuth</artifactId>
</dependency>

<!-- 2. Modify property file, open sleuth Journal -->
logging.level.org.springframework.cloud.sleuth=debug
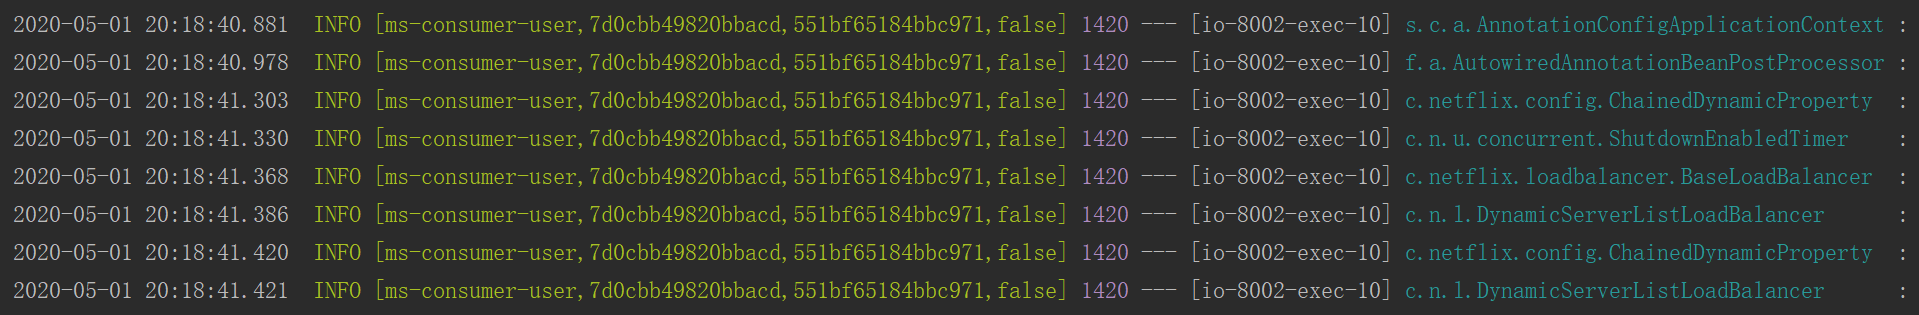
After starting the project, you can see more log information by calling provider through consumer to observe the output: [ms-consumer-user,7d0cbb49820bbacd,551bf65184bbc971,false], with four parameters representing [microservice application name, traceId,spanId, persistence]
Sleuth's persistent Sleuth+zipkin
SpringCloud Sleuth, combined with Zipkin, sends information to Zipkin, uses Zipkin's storage to store information, and uses Zipkin UI to display data.Zipkin is an open source project for Twitter based on the Google Dapper implementation, which focuses on collecting timing data for services to address delays in the microservice architecture, including data collection, storage, discovery, and presentation.We can use it to collect trace data for request links on each server and use the REST API interface it provides to assist us in querying trace data to monitor distributed systems, to detect latency increases in the system in a timely manner and to identify the root cause of system performance bottlenecks.In addition to the development-oriented API interface, it also provides convenient UI components to help us intuitively search for tracking information and analyze request link details, such as querying processing time for individual user requests over a period of time.Zipkin provides pluggable data storage: In-Memory, MySql, Cassandra, and Elasticsearch, which is recommended for production.
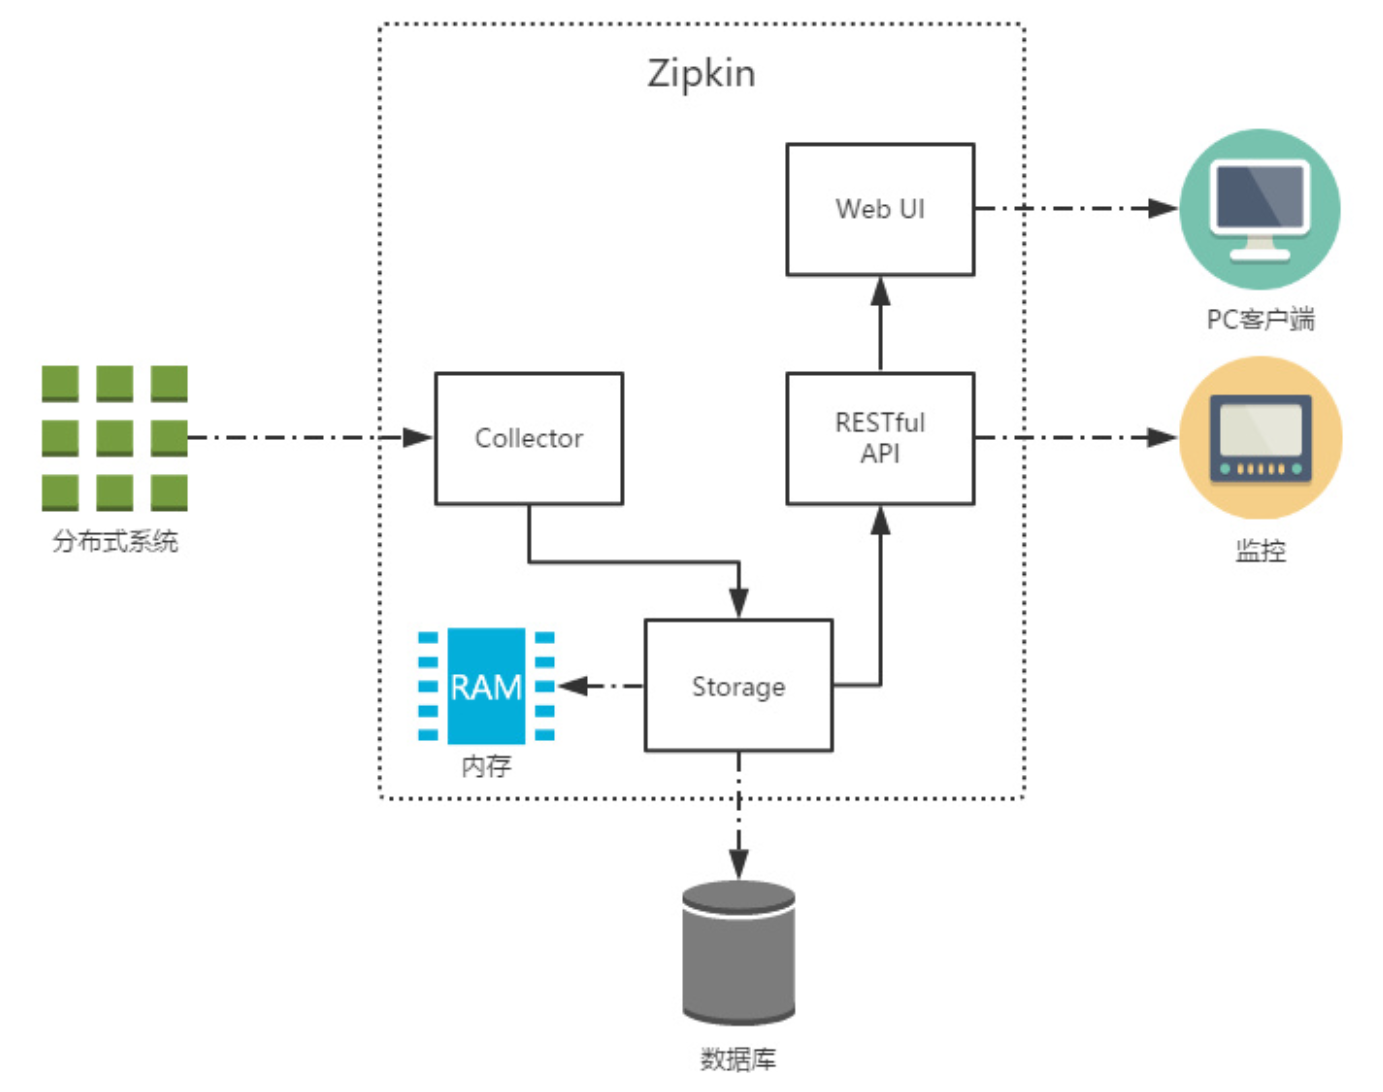
The Zipkin infrastructure, shown in the diagram, consists mainly of four core components:
Collector: A collector component that handles tracking information sent from an external system and converts it into a Span format processed internally by Zipkin to support subsequent storage, analysis, display, and other functions.
Storage: A storage component that processes tracking information received by the collector. By default, this information is stored in memory. We can also modify this storage policy to store tracking information in a database by using other storage components.
RESTful API: An API component that primarily provides an external access interface.For example, display tracking information to clients, or add-in system access for monitoring.
Web UI: A UI component, an upper application based on API components.Users of UI components can easily and intuitively query and analyze tracking information.
Introduction to Zipkin
Zipkin is divided into two ends, one is Zipkin server, the other is Zipkin client, the client is also the application of micro services.Clients configure the URL address of the server, which is monitored by Sleuth's monitors configured in the microservice when an inter-service call occurs, and the corresponding Trace and Span information is generated and sent to the server.There are two main ways to send messages, one is HTTP message, and the other is message bus, such as RabbitMQ.
Method 1: HTTP message format:
<!-- 1. join POM rely on -->
<dependency>
<groupId>org.springframework.cloud</groupId>
<artifactId>spring-cloud-starter-sleuth</artifactId>
</dependency>

<dependency>
<groupId>org.springframework.cloud</groupId>
<artifactId>spring-cloud-starter-zipkin</artifactId>
</dependency>

<!-- 2. Modify property file, open sleuth Journal -->
#Address of zipkin server
spring.zipkin.base-url=http://localhost:9411/
spring.sleuth.web.client.enabled=true
#Sampling scale defaults to 0.1 1 means all reports
spring.sleuth.sampler.probability=1

<!-- 3.Start a Zipkin Server, in SpringBoot1.x We need to build it manually at Springboot2.x Then we just need to go to the official website to download it, via java -jar Start up
 Download link as https://search.maven.org/remote_content?g=io.zipkin.java&a=zipkin-server&v=LATEST&c=exec -->
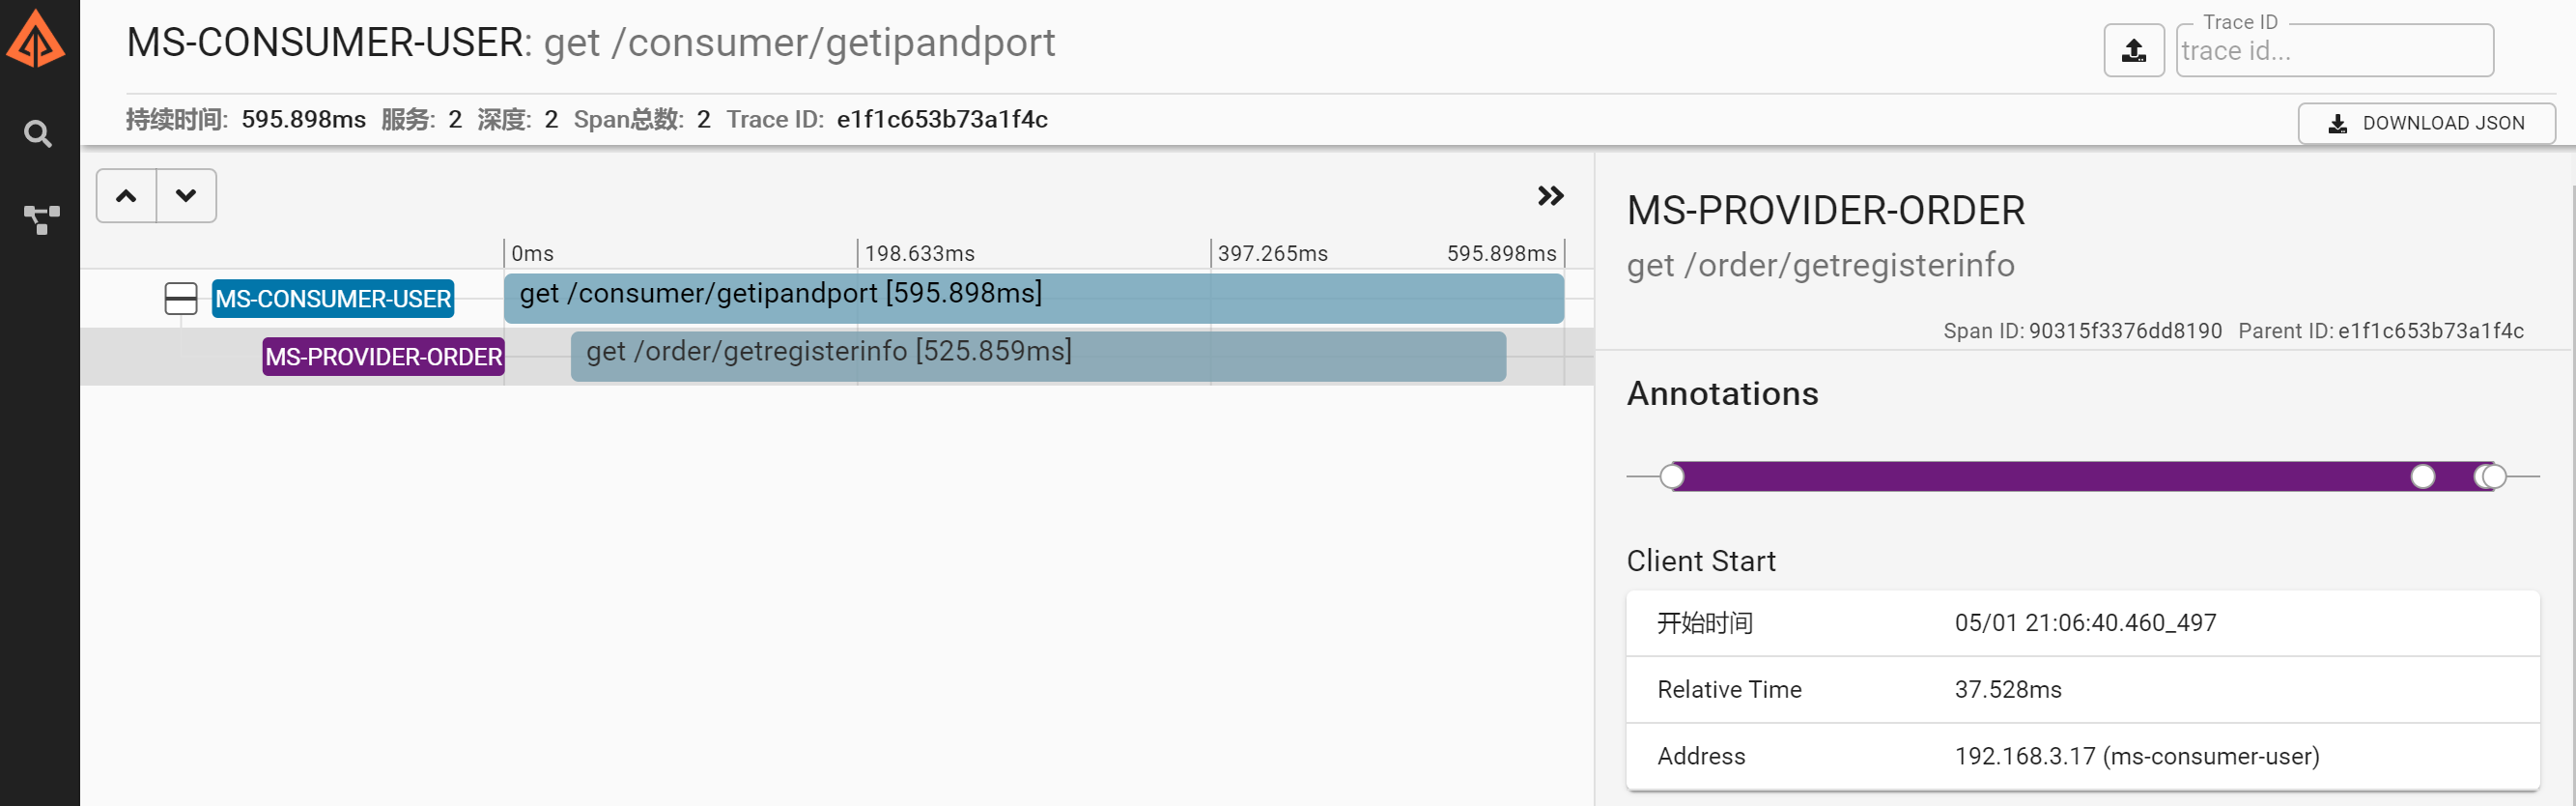
After startup, the user enters the interface through http://localhost:9411/zipkin, and the zipkinUI displays the relevant call chain information when the consumer sends a request to the provider.
Method 2 RabbitMQ:
<!-- 1. join POM rely on -->
<dependency>
    <groupId>org.springframework.cloud</groupId>
    <artifactId>spring-cloud-stream-binder-rabbit</artifactId>
</dependency>

<!-- 2. Modify property file, open sleuth Journal -->
spring.zipkin.sender.type=rabbit
spring.sleuth.web.client.enabled=true
#Sampling scale defaults to 0.1 1 means all reports
spring.sleuth.sampler.probability=1
spring.rabbitmq.host=127.0.0.1
spring.rabbitmq.port=5672
spring.rabbitmq.password=guest
spring.rabbitmq.username=guest
spring.rabbitmq.virtual-host=/

<!-- 3.Start a Zipkin Server, specified by command rabbit -->
java -jar zipkin-server-2.12.9-exec.jar --zipkin.collector.rabbitmq.address=127.0.0.1
Zipkin+mysql data persistence
<!-- 1. Create a zipkin Database and execute table-building statements -->
CREATE TABLE `zipkin_annotations` (
  `trace_id_high` bigint(20) NOT NULL DEFAULT '0' COMMENT 'If non zero, this means the trace uses 128 bit traceIds instead of 64 bit',
  `trace_id` bigint(20) NOT NULL COMMENT 'coincides with zipkin_spans.trace_id',
  `span_id` bigint(20) NOT NULL COMMENT 'coincides with zipkin_spans.id',
  `a_key` varchar(255) NOT NULL COMMENT 'BinaryAnnotation.key or Annotation.value if type == -1',
  `a_value` blob COMMENT 'BinaryAnnotation.value(), which must be smaller than 64KB',
  `a_type` int(11) NOT NULL COMMENT 'BinaryAnnotation.type() or -1 if Annotation',
  `a_timestamp` bigint(20) DEFAULT NULL COMMENT 'Used to implement TTL; Annotation.timestamp or zipkin_spans.timestamp',
  `endpoint_ipv4` int(11) DEFAULT NULL COMMENT 'Null when Binary/Annotation.endpoint is null',
  `endpoint_ipv6` binary(16) DEFAULT NULL COMMENT 'Null when Binary/Annotation.endpoint is null, or no IPv6 address',
  `endpoint_port` smallint(6) DEFAULT NULL COMMENT 'Null when Binary/Annotation.endpoint is null',
  `endpoint_service_name` varchar(255) DEFAULT NULL COMMENT 'Null when Binary/Annotation.endpoint is null',
  UNIQUE KEY `trace_id_high` (`trace_id_high`,`trace_id`,`span_id`,`a_key`,`a_timestamp`),
  KEY `trace_id_high_2` (`trace_id_high`,`trace_id`,`span_id`),
  KEY `trace_id_high_3` (`trace_id_high`,`trace_id`),
  KEY `endpoint_service_name` (`endpoint_service_name`),
  KEY `a_type` (`a_type`),
  KEY `a_key` (`a_key`)
) ENGINE=InnoDB DEFAULT CHARSET=utf8 ROW_FORMAT=COMPRESSED;

<!-- 2.Start a Zipkin Server, specified by command mysql -->
zipkin server start-up java -jar zipkin-server-2.11.1-exec.jar --STORAGE_TYPE=mysql --MYSQL_DB=zipkin --MYSQL_USER=root --MYSQL_PASS=root --MYSQL_HOST=127.0.0.1 --MYSQL_TCP_PORT=3306
Note: The article refers to https://windmt.com/2018/04/24/spring-cloud-12-sleuth-zipkin/