Copyright Statement: This article is the original article of the blogger. It can not be reproduced without the permission of the blogger.
Chapter 1 Hello: Understanding p5.js
Chapter 2 begins coding: Create your first p5.js program
Chapter III Painting: Definition and Drawing Simple Shapes
Chapter IV Variables: Storage, Modification and Reuse of Data
Chapter 5 Response: Control and Impact Procedures Using Mouse, Keyboard and Touchpad
Chapter 6 Translation, Rotation and Scaling: Coordinate Transform
Chapter 7 Multimedia: Loading and displaying multimedia, including pictures and fonts
Chapter 8 Motion: Moving Graphics and Designing "Dance Steps"
Chapter 9 Functions: Building New Code Modules
Chapter 10 Objects: Creating Code Modules with Variables and Functions
Chapter 11 Arrays: Make it easy to process a list of variables
Chapter 12 Data: Loading and Visualizing Data
Chapter 13 Extensions: Understanding Sound DOM
3, painting
First of all, drawing on a computer screen is similar to drawing on paper. Usually this process starts with a cautious technical operation, but with the introduction of new content, the process extends from drawing simple graphics with software to animation and interaction. Before we make this flight, we need to start from scratch.
A computer screen is a grid of light-emitting points called pixels. The position of each pixel in the grid is defined as the coordinates of the pixels. When you create a p5.js project, you will use a browser to view it. In the browser window, p5.js creates a canvas on which all the graphics you create will be drawn. The canvas may be the same size as the window, or it may have different dimensions. This canvas is usually placed in the upper left corner of your window by default, but you can place it in other parts of the window.
When you draw a picture on a canvas, the X coordinate represents the distance to the left edge of the canvas and the Y coordinate represents the distance to the edge of the canvas. We write the coordinates of a pixel as (x,y). Therefore, if the size of a canvas is 200*200 pixels, the coordinates of the upper left corner are (0,0), the coordinates of the center position are (100,100), and the coordinates of the lower right corner are (199,199). These numbers seem confusing to you: why do we use 0 to 1999 instead of 1 to 200? This is because in programs, we usually count from zero. As you will see later, this counting is easier to calculate.
canvas
The process of creating canvas and spending patterns on canvas is accomplished through the code element of functions. Function is the basic component of p5.js program. The behavior of a function is defined by its parameters. For example, almost every p5.js program has a "create Canvas ()" function to create a canvas with a specific width and height. If your program does not have this function, p5.js creates a 100*100 pixel canvas by default.
Example 3-1: Create a canvas
The createCanvas() function has two parameters: the first parameter is the width of the canvas, and the second parameter is the height of the canvas. To draw a canvas 800 pixels wide and 600 pixels high, we need to enter the following code:
function setup() {
 createCanvas(800, 600);
}
Run this line of code to see the results. Turn the numbers into other values to see what happens. Try using very small numbers or numbers larger than your screen size.
Example 3-2: Draw a point
We use the point() function to draw a colored pixel on the canvas. This function defines a position with two parameters, i. e. x coordinate and y coordinate. In order to create a 480*120 pixel canvas and draw a point in its center, it is obvious that the coordinates of this point should be (240,60). We need to enter the following code:
function setup() {
 createCanvas(480, 120);
}
function draw() {
 background(204);
 point(240, 60);
}
The effect is shown in Figure 3-1.

Figure 3-1
Try writing a program that draws one pixel at each corner and center of the canvas. Then try to draw horizontal, vertical or diagonal lines by arranging points one by one.
elementary school figure
p5.js contains a series of functions to draw basic shapes (Figure 3-2). By combining simple shapes (such as lines), more complex shapes (such as leaves and faces) can be created.
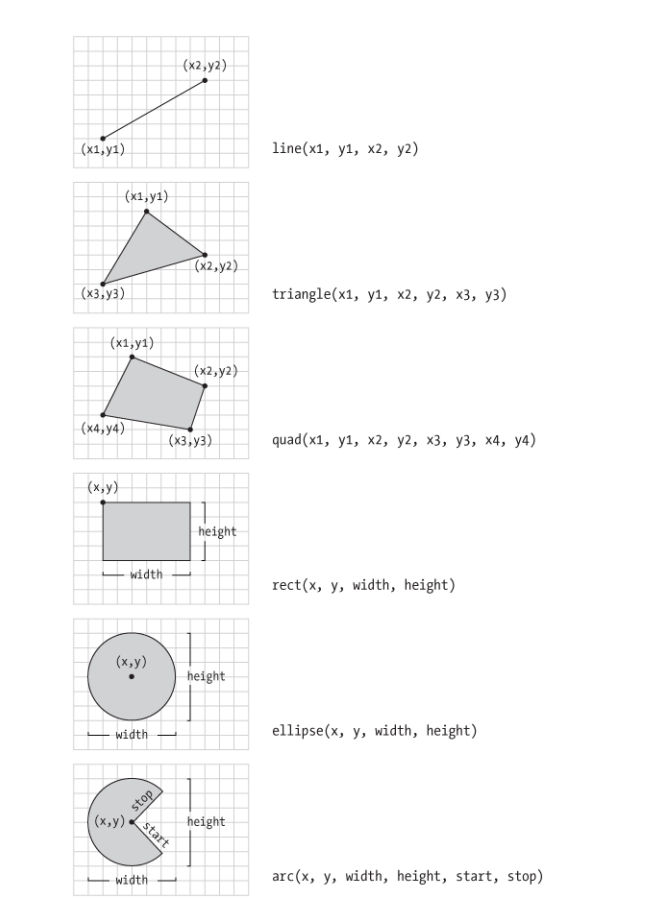
Figure 3-2
In order to draw a line segment, we need four parameters: two are the coordinates of the starting point and two are the coordinates of the ending point.
Example 3-3: Draw a line segment
To draw a line from (20,50) to (420,110), we need to enter the following code:
function setup() {
 createCanvas(480, 120);
}
function draw() {
 background(204);
 line(20, 50, 420, 110);
}
The effect is shown in Figure 3-3. 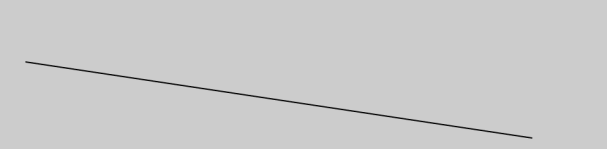
Figure 3-3
Example 3-4: Draw basic shapes
The following pattern (Figure 3-4) requires six parameters for a triangle and eight parameters for a quadrilateral. The code is as follows:
function setup() {
 createCanvas(480, 120);
}
function draw() {
 background(204);
 quad(158, 55, 199, 14, 392, 66, 351, 107);
 triangle(347, 54, 392, 9, 392, 66);
 triangle(158, 55, 290, 91, 290, 112);
}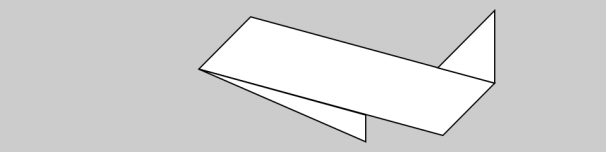
Figure 3-4
Example 3-5: Draw a rectangle
Rectangles and ellipses have four parameters: the first parameter and the second parameter are the x and y coordinates of their fixed points (for a rectangle, the vertex in the upper left corner), and the third and fourth parameters are the width and height of the graph. The following code uses rect() to draw a rectangle with a central position of (180, 60), a width of 220 and a height of 40, respectively (Fig. 3-5):
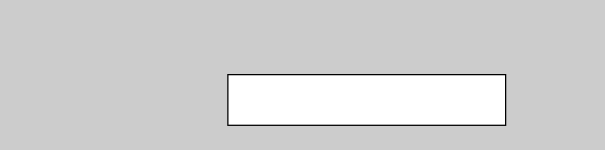
Figure 3-5
function setup() {
 createCanvas(480, 120);
}
function draw() {
 background(204);
 rect(180, 60, 220, 40);
}
Example 3-6: Draw an ellipse
For a rectangle, the coordinates of x and y refer to the vertex coordinates of the upper left corner of the rectangle, but for an ellipse, the coordinates of its center. In this example, you will notice that the y coordinate of the center of the first ellipse is already outside the canvas (Figure 3-6). So now you know that objects can be painted out of the canvas in part or in whole, and the program won't make a mistake. 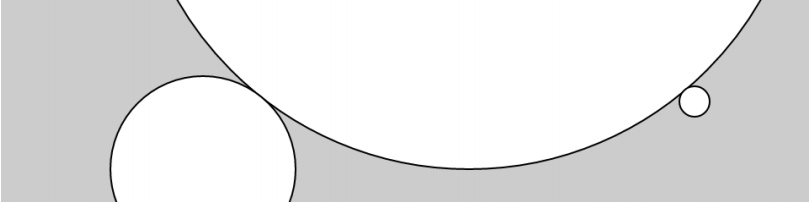
Figure 3-6
function setup() {
 createCanvas(480, 120);
}
function draw() {
 background(204);
 ellipse(278, -100, 400, 400);
 ellipse(120, 100, 110, 110);
 ellipse(412, 60, 18, 18);
}
p5.js has no separate function to draw squares and circles. You can draw these graphs by giving * ellipse()* and rect() the same width and value.
Example 3-7: Draw a part of an ellipse
Using arc(), you can draw a part of an ellipse with the following code:
function setup() {
 createCanvas(480, 120);
}
function draw() {
 background(204);
 arc(90, 60, 80, 80, 0, HALF_PI);
 arc(190, 60, 80, 80, 0, PI+HALF_PI);
 arc(290, 60, 80, 80, PI, TWO_PI+HALF_PI);
 arc(390, 60, 80, 80, QUARTER_PI, PI+QUARTER_PI);
}
The first two parameters of arc() function determine the center position of ellipse, and the second two parameters determine the width and height of ellipse. The fifth parameter sets the angle at which the arc begins and the sixth parameter sets the angle at which the arc ends. The unit used for the angle is the radian system rather than the angle system. The radian system is based on pi(3.14159) to measure the angular value. Figure 3-7 shows the relationship between the two. In this example, four radian values are used very frequently, so we add four radian values as constants to the p5.js library. These four values are PI, QUARTER_PI,HALF_PI and TWO_PI. You can use them to replace 180 degrees, 45 degrees, 90 degrees and 360 degrees in your program.
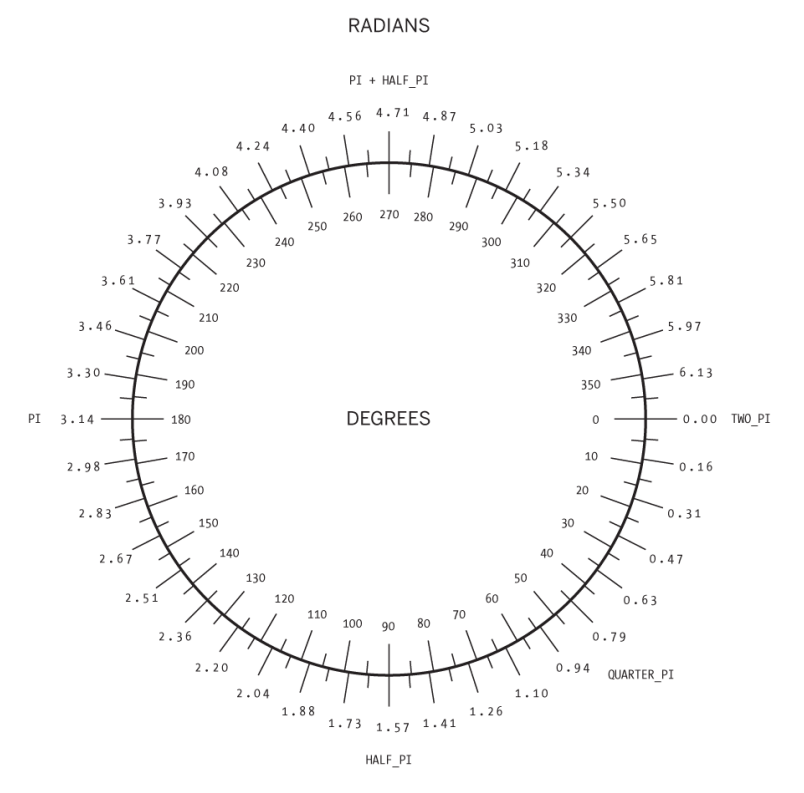
Figure 3-7
Example 3-8: Drawing from an angle
If you prefer angle drawing, you can use radians() function to convert the angle value into radian value. This function receives an angle parameter and converts it into the corresponding radian value. The result of the following example is the same as that of example 3-7, but it uses radians() function and uses angle values to determine the starting and ending points of an arc. The code is as follows:
function setup() {
 createCanvas(480, 120);
}
function draw() {
 background(204);
 arc(90, 60, 80, 80, 0, radians(90));
 arc(190, 60, 80, 80, 0, radians(270));
 arc(290, 60, 80, 80, radians(180), radians(450));
 arc(390, 60, 80, 80, radians(45), radians(225));
}
Example 3-9: Use Angle Mode
Of course, you can use the angleMode() function to set the angle system instead of the radian value throughout the project. This function allows all functions in your project to have input and return values in the form of angle values or radian values, rather than converting them by yourself. The following example yields the same results as Example 3-8, but it uses the angleMode(DEGREES) function to represent both the starting and ending points of an arc in terms of angles:
function setup() {
 createCanvas(480, 120);
 angleMode(DEGREES);
}
function draw() {
 background(204);
 arc(90, 60, 80, 80, 0, 90);
 arc(190, 60, 80, 80, 0, 270);
 arc(290, 60, 80, 80, 180, 450);
 arc(390, 60, 80, 80, 45, 225);
}
Drawing order
When a program runs, the computer starts at the top of the program and reads it line by line until the last line of the program. If you want a graph to be displayed on all the other graphics, you need to put the code that draws the graph behind all the other graphics.
Example 3-10: Control the order in which you draw
As shown in Figure 3-8.
function setup() {
 createCanvas(480, 120);
}
function draw() {
 background(204);
 ellipse(140, 0, 190, 190);
 // The rectangle draws on top of the ellipse
 // because it comes after in the code
 rect(160, 30, 260, 20);
}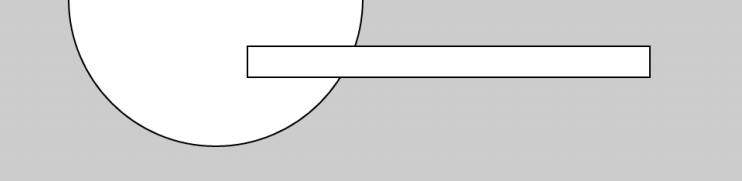
Figure 3-8
Example 3-11: Reverse the order
If you reverse the order of * rect()* and * ellipse()* functions in 3-10, you will find that the circle is now above the rectangle (Figure 3-9). 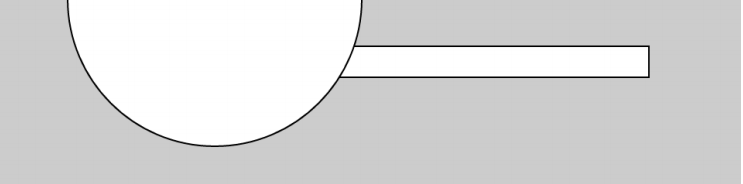
Figure 3-9
function setup() {
 createCanvas(480, 120);
}
function draw() {
 background(204);
 rect(160, 30, 260, 20);
 // The ellipse draws on top of the rectangle
 // because it comes after in the code
 ellipse(140, 0, 190, 190);
}
You can think of it as drawing with a brush or making a jigsaw puzzle. The last element you add is always at the top.
Setting the Properties of Graphics
Now, you may want to control more graphics attributes, rather than just modify location and size. To do this, you need a series of functions to set these properties.
Example 3-12: Set the width of the line
The default width of a line is a pixel, but you can change it through the * strokeWeight()* function (Figure 3-10). This function has only one parameter, which is the line width value you want to set. The code is as follows:
function setup() {
 createCanvas(480, 120);
}
function draw() {
 background(204);
 ellipse(75, 60, 90, 90);
 strokeWeight(8); // Stroke weight to 8 pixels
 ellipse(175, 60, 90, 90);
 ellipse(279, 60, 90, 90);
 strokeWeight(20); // Stroke weight to 20 pixels
 ellipse(389, 60, 90, 90);
}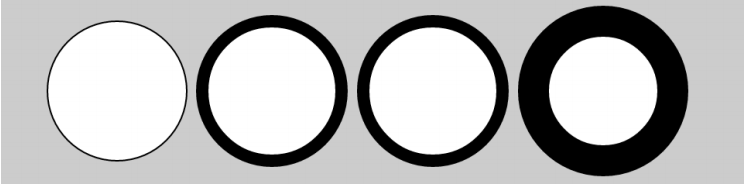
Figure 3-10
Example 3-13: Setting the attributes of a line
The strokeJoin() function sets the way the lines are connected, while the strokeCap() function sets the style of the two endpoints of the line segment (Figure 3-11):
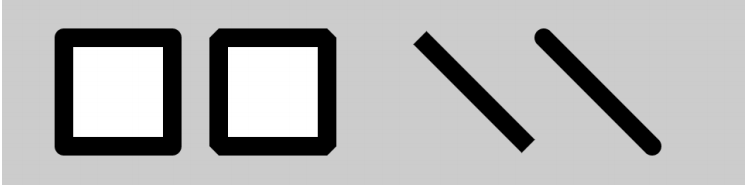
Figure 3-11
function setup() {
 createCanvas(480, 120);
 strokeWeight(12);
}
function draw() {
 background(204);
 strokeJoin(ROUND); // Round the stroke corners
 rect(40, 25, 70, 70);
 strokeJoin(BEVEL); // Bevel the stroke corners
 rect(140, 25, 70, 70);
 strokeCap(SQUARE); // Square the line endings
 line(270, 25, 340, 95);
 strokeCap(ROUND); // Round the line endings
 line(350, 25, 420, 95);
}
The location of rect() function and ellipse() function is determined by rectMode() function and ellipse mode () function. By consulting the p5.js reference document, you can see how to use the center of the rectangle to place the rectangle (rather than the vertex of the upper left corner) or how to use the position of the upper left corner of the ellipse to place the ellipse like a rectangle.
When these attributes are determined, then all the drawings will be affected. For example, in Example 3-12, you will find that the second circle and the third circle have the same contour width, although the line width was set only once before.
In this case, strokeWeight(12) appears in the setup() function rather than in the draw() function. This is because we want to use the same settings for all graphics, so we put it in the setup() function, so we only need to set it once. Of course, this is written to make the structure of the program clearer, although putting it into the draw() function will give the same visual effect.
colour
In previous examples, all graphics used black contours and were filled in white. If you want to make graphics more colorful, you need to use * fill() and stroke() functions. The parameters of these two functions range from 0 to 255, of which 255 represents white, 128 represents medium gray, and 0 represents black. Figure 3-12 shows the different gray levels represented by parameter values ranging from 0 to 255. The ** back used in our previous example
The ground()** function is used to set the background color of the canvas, not to set the outline color or fill color.
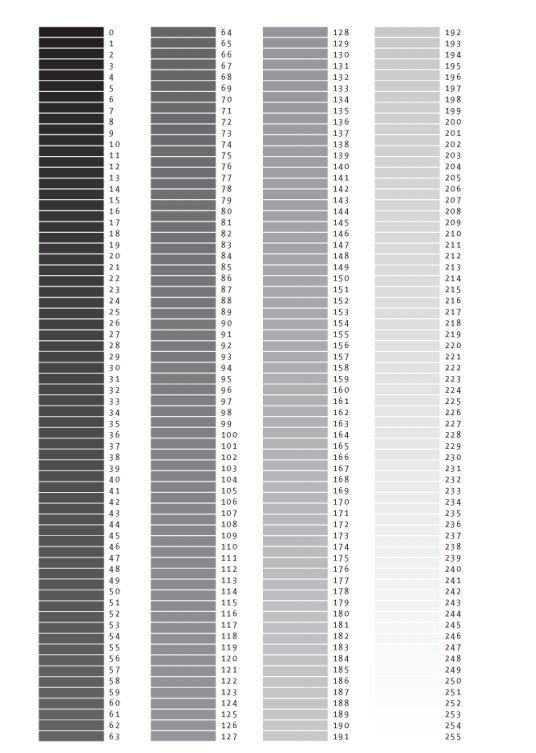
Figure 3-12
Example 3-14: Draw different grays
This example shows three different grey values on a black background (Fig. 3-13): 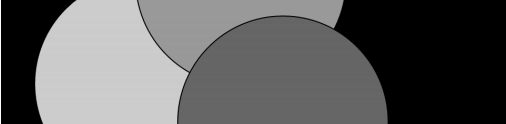
Figure 3-13
function setup() {
 createCanvas(480, 120);
}
function draw() {
 background(0); // Black
 fill(204); // Light gray
 ellipse(132, 82, 200, 200); // Light gray circle
 fill(153); // Medium gray
 ellipse(228, -16, 200, 200); // Medium gray circle
 fill(102); // Dark gray
 ellipse(268, 118, 200, 200); // Dark gray circle
}
Example 3-15: Controlling Filling and Contour
You can use the noStroke() function to cancel the outline of a graph, or you can use the noFill() function to cancel the color filling of a graph (Figure 3-14):
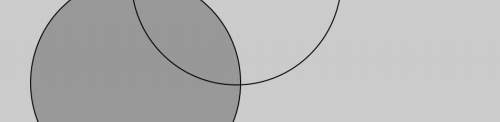
Figure 3-14
function setup() {
 createCanvas(480, 120);
}
function draw() {
 background(204);
 fill(153); // Medium gray
 ellipse(132, 82, 200, 200); // Gray circle
 noFill(); // Turn off fill
 ellipse(228, -16, 200, 200); // Outline circle
 noStroke(); // Turn off stroke
 ellipse(268, 118, 200, 200); // Doesn't draw!
}
It's important to note that you can't cancel both filling and outlining, which will cause nothing to appear on the canvas.
Example 3-16: Add color to your graphics
You can use three parameters to mix into a color, which represent red, green and blue, respectively. Because the book is printed in black and white, you can only see grey (but we have an electronic version, haha). Run the following code to show the color (Figure 3-15):
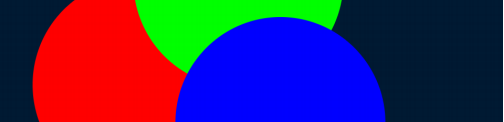
Figure 3-15
function setup() {
 createCanvas(480, 120);
 noStroke();
}
function draw() {
 background(0, 26, 51); // Dark blue color
 fill(255, 0, 0); // Red color
 ellipse(132, 82, 200, 200); // Red circle
 fill(0, 255, 0); // Green color
 ellipse(228, -16, 200, 200); // Green circle
 fill(0, 0, 255); // Blue color
 ellipse(268, 118, 200, 200); // Blue circle
}
In this example, the color is in RGB format, which is used by the computer to define the color output on the screen. The three values represent red, green and blue respectively, and the ranges of these three values are 0 to 255. Different values represent different gray levels. The parameters in background(), fill(), stroke() functions are these three values.
Example 3-17: Setting Transparency
In the fill() or stroke() function, you can control the transparency of the color by adding a fourth optional parameter. The fourth parameter is called alpha, and of course it ranges from 0 to 255. 0 represents the color is completely transparent (the color will not be displayed on the screen), while 255 represents the total opacity, and the value between 0 and 255 allows the color to mix on the screen (as shown in Figure 3-16):

Figure 3-16
function setup() {
 createCanvas(480, 120);
 noStroke();
}
function draw() {
 background(204, 226, 225); // Light blue color
 fill(255, 0, 0, 160); // Red color
 ellipse(132, 82, 200, 200); // Red circle
 fill(0, 255, 0, 160); // Green color
 ellipse(228, -16, 200, 200); // Green circle
 fill(0, 0, 255, 160); // Blue color
 ellipse(268, 118, 200, 200); // Blue circle
}
Custom Drawing
With p5.js, you will not be restricted to drawing only these basic geometric figures. You can also draw new graphics by connecting a series of points.
Example 3-18: Draw an arrow
beginShape() represents the beginning of a new graphic drawing. The vertex() function defines the coordinates (x,y) of each vertex of the new graph. Finally, endShape() represents the end of the new graphics rendering (Figures 3-17):
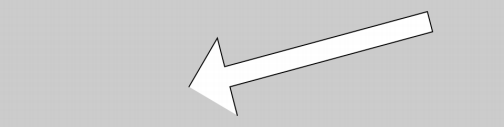
Figure 3-17
function setup() {
 createCanvas(480, 120);
}
function draw() {
 background(204);
 beginShape();
 vertex(180, 82);
 vertex(207, 36);
 vertex(214, 63);
 vertex(407, 11);
 vertex(412, 30);
 vertex(219, 82);
 vertex(226, 109);
 endShape();
}
Example 3-19: Close that gap
When you run examples 3-18, you will find that the first point is not connected to the last point. You can use CLOSE as a parameter to the endShape() function (Figure 3-18):
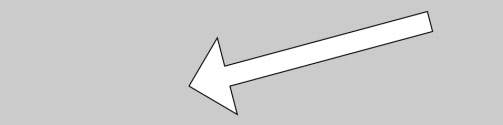
Figure 3-18
function setup() {
 createCanvas(480, 120);
}
function draw() {
 background(204);
 beginShape();
 vertex(180, 82);
 vertex(207, 36);
 vertex(214, 63);
 vertex(407, 11);
 vertex(412, 30);
 vertex(219, 82);
 vertex(226, 109);
 endShape(CLOSE);
}
Example 3-20: Create some animals
Using the vertex() function, we can draw many complex contours. p5.js can draw thousands of lines at a time, it can draw any graph you can imagine. See the following example (Figure 3-19):
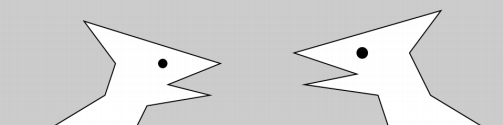
Figure 3-19
function setup() {
 createCanvas(480, 120);
}
function draw() {
 background(204);
 // Left creature
 beginShape();
 vertex(50, 120);
 vertex(100, 90);
 vertex(110, 60);
 vertex(80, 20);
 vertex(210, 60);
 vertex(160, 80);
 vertex(200, 90);
 vertex(140, 100);
 vertex(130, 120);
 endShape();
 fill(0);
 ellipse(155, 60, 8, 8);
 // Right creature
 fill(255);
 beginShape();
 vertex(370, 120);
 vertex(360, 90);
 vertex(290, 80);
 vertex(340, 70);
 vertex(280, 50);
 vertex(420, 10);
 vertex(390, 50);
 vertex(410, 90);
 vertex(460, 120);
 endShape();
 fill(0);
 ellipse(345, 50, 10, 10);
}
Program Comments
The example in this chapter uses a double slash (//) at the end of each line of code to annotate it. Annotations are part of a program, but they are ignored when the program is running. They are very useful and can remind you of the function of this code at all times. If other people read your code, comments can help them understand your ideas.
Annotations are also very helpful when you have to choose among a large number of options. When you try to choose an appropriate color for an ellipse:
function setup() {
 createCanvas(200, 200);
}
function draw() {
 background(204);
 fill(165, 57, 57);
 ellipse(100, 100, 80, 80);
}
Now suppose I want to try another kind of red, but I don't want to discard the previous color. I can copy and paste this line, modify it, and comment out the previous line:
function setup() {
 createCanvas(200, 200);
}
function draw() {
 background(204);
 //fill(165, 57, 57);
 fill(144, 39, 39);
 ellipse(100, 100, 80, 80);
}
Placing a double slash (//) at the beginning of a line of code can temporarily disable it. When I want to use this line again, I can remove // and put it in another line:
function setup() {
 createCanvas(200, 200);
}
function draw() {
 background(204);
 fill(165, 57, 57);
 //fill(144, 39, 39);
 ellipse(100, 100, 80, 80);
}
When you use p5.js, you'll find that you've created a lot of ideas, and using annotations to mark or disable code will help you keep multiple paths of choice.
Drawing Robot 1
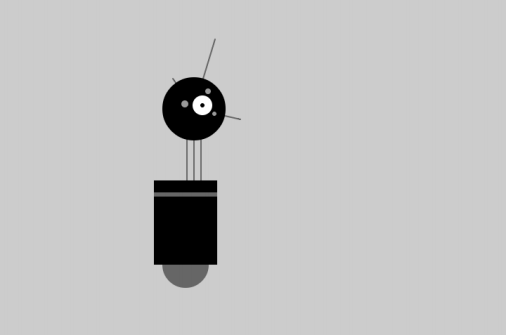
Figure 3-20
Figure 3-20 shows a robot named P5. In this book, we will have ten different programs to draw it. Each drawing method contains different programming ideas. The inspiration for the design of the P5 robot comes from the Sputnik I (1957) designed by Stanford Research Institute, the unmanned fighter aircraft in Star Wars (1984) directed by David Lynch, and the HAL 9000 in 2001 Space Roaming (1968). (Translator's Note: I'm sorry, but I don't know how to spit if I want to.)
The first drawing robot program uses the drawing functions mentioned earlier in this chapter. fill() and stroke() functions are used to set gray values. The line(), ellipse() and rect() functions define the shape of the robot's neck, antenna, body and head. To better familiarize yourself with these functions, you can run the following program and modify the parameters to redesign the robot.
function setup() {
 createCanvas(720, 480);
 strokeWeight(2);
 ellipseMode(RADIUS);
}
function draw() {
 background(204);
 // Neck
 stroke(102); // Set stroke to gray
 line(266, 257, 266, 162); // Left
 line(276, 257, 276, 162); // Middle
 line(286, 257, 286, 162); // Right
 // Antennae
 line(276, 155, 246, 112); // Small
 line(276, 155, 306, 56); // Tall
 line(276, 155, 342, 170); // Medium
 // Body
 noStroke(); // Disable stroke
 fill(102); // Set fill to gray
 ellipse(264, 377, 33, 33); // Antigravity orb
 fill(0); // Set fill to black
 rect(219, 257, 90, 120); // Main body
 fill(102); // Set fill to gray
 rect(219, 274, 90, 6); // Gray stripe
 // Head
 fill(0); // Set fill to black
 ellipse(276, 155, 45, 45); // Head
 fill(255); // Set fill to white
 ellipse(288, 150, 14, 14); // Large eye
 fill(0); // Set fill to black
 ellipse(288, 150, 3, 3); // Pupil
 fill(153); // Set fill to light gray
 ellipse(263, 148, 5, 5); // Small eye 1
 ellipse(296, 130, 4, 4); // Small eye 2
 ellipse(305, 162, 3, 3); // Small eye 3
}
(Translator: Jason Lee, mailbox: 676574039@qq.com)