Click on the top "Deephub Imba" to pay attention to the official account.
introduce
Through the development of the past decade, ordinary people have become more and more easy to enter the stock market, and the amount of funds entering and leaving the market every day has reached a record high.
As an investor, you can cultivate experience and intuition about when to buy or sell in many ways. One of the easiest ways is to consult friends or other investors, but they will soon drown you with conflicting views.
This article will try to solve the gold problem of making money with rigorous mathematical tools rather than rigid opinions - when should I buy or sell?
I will demonstrate how to use the Gaussian mixture model to help determine when funds enter or exit the market.
Mathematically speaking, the market situation at any given time can be called "market state". Market can usually be interpreted as any number of concepts, such as bear market or bull market; Fluctuation size, etc. We can cluster the states of trading days according to some characteristics, which is much better than naming each concept separately.
Since the market situation is not clearly defined - and therefore there is no response variable representing the market - it may be much better to use unsupervised machine learning model to confirm the market state than supervised model, which is also the theoretical hypothesis of this article.
Supervised and unsupervised machine learning
The difference between the two methods lies in whether the data set used is labeled: supervised learning uses labeled input and output data, while unsupervised learning algorithm has no definite output. The annotation of the data set is the response variable or the variable trying to predict contains numerical or classification values. Therefore, when using supervised machine learning algorithms, the predictive variables are clearly defined. A very simple but powerful example of supervised learning is linear regression. Predict y by x
Gaussian mixture model (GMM)
Gaussian mixture model is the overlap of multiple normal distributions in p-dimensional space. The dimension of a space is generated by the number of variables. For example, if we have a variable (S & P 500 return), GMM will fit based on one-dimensional data. GMM can be used to simulate the state of the stock market and other financial applications. A characteristic of stock market returns is the heavy tail produced by high volatility days. The ability to capture highly fluctuating days at the tail of the distribution is very important to capture information in the modeling process.
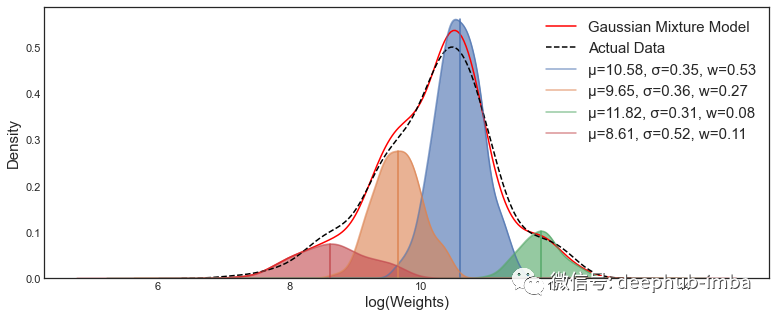
The figure above represents some multimodal data with four clusters. Gaussian mixture model is a clustering model for labeled data.
One of the main benefits of unsupervised clustering using GMM is that the space containing each cluster can present an elliptical shape. Gaussian mixture model considers not only mean but also covariance to form clusters
One advantage of GMM method is that it is completely data-driven. The data provided to the model can be clustered. Importantly, the label of each cluster can be digital, because the data drives the potential characteristics rather than human opinions.
Mathematical interpretation of GMM
The goal of Gaussian mixture model is to assign data points to one of n multi normal distributions. Therefore, expectation maximization (EM) algorithm is used to solve the parameters of each multi normal distribution.
Step 1: random initialization of initial normal distribution parameters
Step 2: execute step E (Expectation) to calculate the expectation of sample hidden variables according to the current parameter value;
Step 3: execute step M (Maximum) to solve the maximum likelihood estimation of parameters according to the hidden variables of the current sample;
Step 4: calculate the log likelihood of the joint probability (score of data state, mean, covariance)
Step 5: repeat steps 2-4 until the log likelihood converges
The probability that each data point belongs to a cluster is as follows. Based on the index, we get the probability that each data point belongs to each independent cluster. The size of the matrix will be the number of data points calculated by the number of clusters. Because it is a probability matrix, the sum of the values under index "i" is 1.
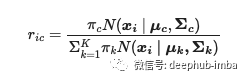
The index i represents each data point or vector. Index C represents a given cluster; If we have three clusters (c), it will be 1 or 2 or 3.
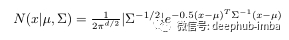
The above is the multivariable Gaussian formula, where mu and sigma are the parameters that need to be estimated by EM algorithm.
Another key concept is that each Gaussian distribution in our space is unbounded and overlaps each other. According to the location of data points, a probability is assigned to them from each distribution. The sum of the probabilities of each data point belonging to any cluster is 1.
Finally, since the EM algorithm is an iterative process, we need to measure the progress of each step to know when to stop. Therefore, we use the log likelihood function of the model to measure when the parameters converge.

Implementation of GMM
This section will be divided into two sections, each representing an application of GMM.
Use GMM to divide the return of S & P500 into three states. Data from Yahoo Finance.
import pandas as pd
import numpy as np
from datetime import datetime , timedelta
import yfinance as yf #import data via Yahoo
sp_list = ['SPY']
today = datetime.today()
# dd/mm/YY
#get last business day
offset = max(1, (today.weekday() + 6) % 7 - 3)
timed = timedelta(offset)
today_business = today - timed
print("d1 =", today_business)
today = today_business.strftime("%Y-%m-%d")
symbols_list = sp_list
start = '2000-01-01'
end = today
print('S&P500 Stock download')
r = yf.download(symbols_list, start,end)
df_pivot = r
#replace all nan data with zero
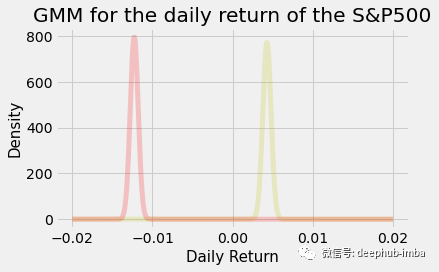
treasury_yeild = df_pivot.CloseHere I need to determine how many states best represent the market environment. We will assume three states - bear market, shock market and bull market.
I will use the logarithmic return of S & P500 to fit the GMM.
The Python implementation of GMM on one-dimensional data is very simple.
from scipy.stats import multivariate_normal
from sklearn.mixture import GaussianMixture
#'10YrYeild':treasury_yeild.Close.values
# 0. Create dataset
sp_list = ['SPY']

symbols_list = sp_list
start = '2008-01-01'

print('S&P500 Stock download')
r = yf.download(symbols_list, start,end)

daily_returns = (r.Close.pct_change()) #Daily log returns Close price for each day -  Y observations
daily_returns = daily_returns.iloc[1:]

X = daily_returns.values

GMM = GaussianMixture(n_components=3).fit(X.reshape(-1,1)) # Instantiate and fit the model
Using sklearn's Gaussian mixture model, we can find the state we want.
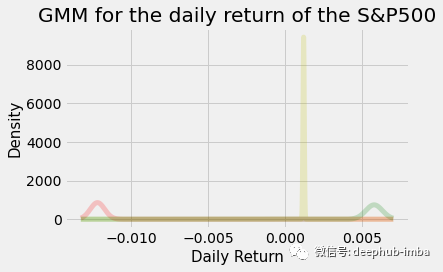
From the above analysis, the two states may also be OK
One possible problem is convergence. It may be based on the initial conditions and the definition of a threshold in the EM algorithm, or it may form different distributions. This needs further investigation.
The US economy is classified using GMM compliant macroeconomic data
To visually demonstrate GMM, I will use two-dimensional data (two variables). Each corresponding cluster is a three-dimensional multi normal distribution. In this example, the first dimension is inflation (we call it x), the second dimension is the monthly return of S & P500 (we call it Y), and the third dimension is the joint probability of X & Y. In other words, what is the probability of a combination of X and Y.
from scipy.stats import multivariate_normal
from sklearn.mixture import GaussianMixture
#'10YrYeild':treasury_yeild.Close.values
# 0. Create dataset
gmm_data = pd.DataFrame({'Inflation':inflation.Weight,'Market_return':spy.Close.values})
gmm_data = gmm_data.to_numpy()

X = gmm_data

x,y = np.meshgrid(np.sort(X[:,0]),np.sort(X[:,1]))
XY = np.array([x.flatten(),y.flatten()]).T

GMM = GaussianMixture(n_components=3).fit(X) # Instantiate and fit the model
print('Converged:',GMM.converged_) # Check if the model has converged
This figure shows a major advantage of GMM over other clustering algorithms. Normal distribution can produce elliptical shape, which comes from the covariance matrix.
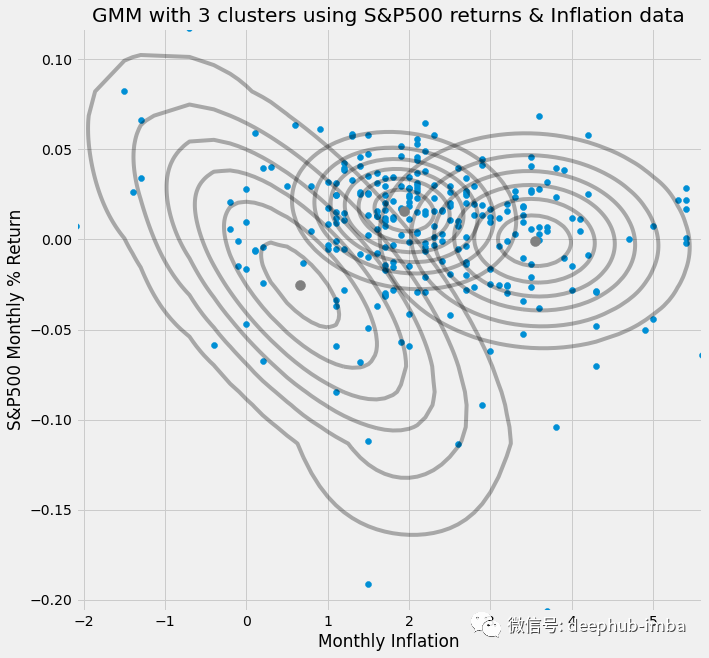
Given two-dimensional data, GMM can produce three different states.
Finally, if you want to create a meaningful model, you should consider more variables. In fact, a series of different indicators constitute the U.S. economy and its performance. We can continue and merge any number of dimensions, but it is important to understand the relevant structure of the data provided to the model before entering the n-dimension.
summary
This is a brief introduction to how we apply GMM to financial market and economy. Please remember that this is just an introduction. The GMM method is introduced to improve the robustness of classifying stock market price data into states. The relationship between market conditions and economy needs further research.
Author: Ethan Johnson Skinner, MSc