About Ganglia
Ganglia is an open source cluster monitoring visualization tool initiated by UC Berkeley, which is designed to measure thousands of nodes. Ganglia's core includes gmond, gmetad and a Web front end. It is mainly used to monitor the system performance, such as: cpu, mem, hard disk utilization, I/O load, network traffic, etc. it is easy to see the working status of each node through the curve, which plays an important role in reasonably adjusting and allocating system resources and improving the overall performance of the system.
For detailed introduction and working principle, please refer to Baidu Encyclopedia, https://baike.baidu.com/item/Ganglia/1283012?fr=aladdin
1, Installation and deployment of Ganglia
1. Install httpd service and php
[root@cos100 flume]# sudo yum -y install httpd php
2. Install other dependencies
[root@cos100 flume]# sudo yum -y install rrdtool perl-rrdtool rrdtool-devel apr-devel
3. Install Ganglia
1) . import rpm source
[root@cos100 flume]# sudo rpm -Uvh http://dl.fedoraproject.org/pub/epel/6/x86_64/epel-release-6-8.noarch.rpm
2) . install the three components of rpm
[root@cos100 flume]# sudo yum -y install ganglia-gmetad ganglia-web ganglia-gmond
4. Modify the configuration file ganglia.conf (modify the front-end access rights)
[root@cos100 flume]# sudo vim /etc/httpd/conf.d/ganglia.conf
Amend to read:
# Ganglia monitoring system php web frontend
Alias /ganglia /usr/share/ganglia
<Location /ganglia>
  Order deny,allow
  #Deny from all
  Allow from all
  # Allow from 127.0.0.1 (local access only)
  # Allow from ::1
  # Allow from .example.com
</Location>
5. Modify the configuration file gmetad.conf (modify data source)
[root@cos100 flume]# sudo vim /etc/ganglia/gmetad.conf
Amend to read:
Where "cos100" is the local host name
data_source "cos100" cos100
Or:
data_source "cos100" 192.168.xx.x
6. Modify the configuration file gmond.conf (modify the monitored data source)
[root@cos100 flume]# sudo vim /etc/ganglia/gmond.conf
Find three groups in the file: cluster {}, UDP ﹣ send ﹣ channel {}, UDP ﹣ recv ﹣ channel {}, and modify them as follows:
cluster {
  # Native host name
  name = "cos100"
  owner = "unspecified"
  latlong = "unspecified"
  url = "unspecified"
}
udp_send_channel {
  #bind_hostname = yes # Highly recommended, soon to be default.
                       # This option tells gmond to use a source address
                       # that resolves to the machine's hostname.  Without
                       # this, the metrics may appear to come from any
                       # interface and the DNS names associated with
                       # those IPs will be used to create the RRDs.
  # mcast_join = 239.2.11.71
  # Native IP
  host = 192.168.xx.x
  port = 8649
  ttl = 1
}
udp_recv_channel {
  # mcast_join = 239.2.11.71
  port = 8649
  # Native IP
  bind = 192.168.xx.x
  retry_bind = true
  # Size of the UDP buffer. If you are handling lots of metrics you really
  # should bump it up to e.g. 10MB or even higher.
  # buffer = 10485760
}
7. Modify selinux configuration
[root@cos100 flume]# sudo vim /etc/selinux/config
Set SELINUX=disabled to turn off Selinux.
After setting, you need to restart the virtual machine. If you do not want to restart it temporarily, you must make it take effect temporarily
[root@cos100 flume]# sudo setenforce 0
8. Start ganglia
[root@cos100 flume]# sudo service httpd start
[root@cos100 flume]# sudo service gmetad start
[root@cos100 flume]# sudo service gmond start
9. Browse Ganglia page on the website
Open the webpage and enter the website: http://cos100/ganglia to display the following pages: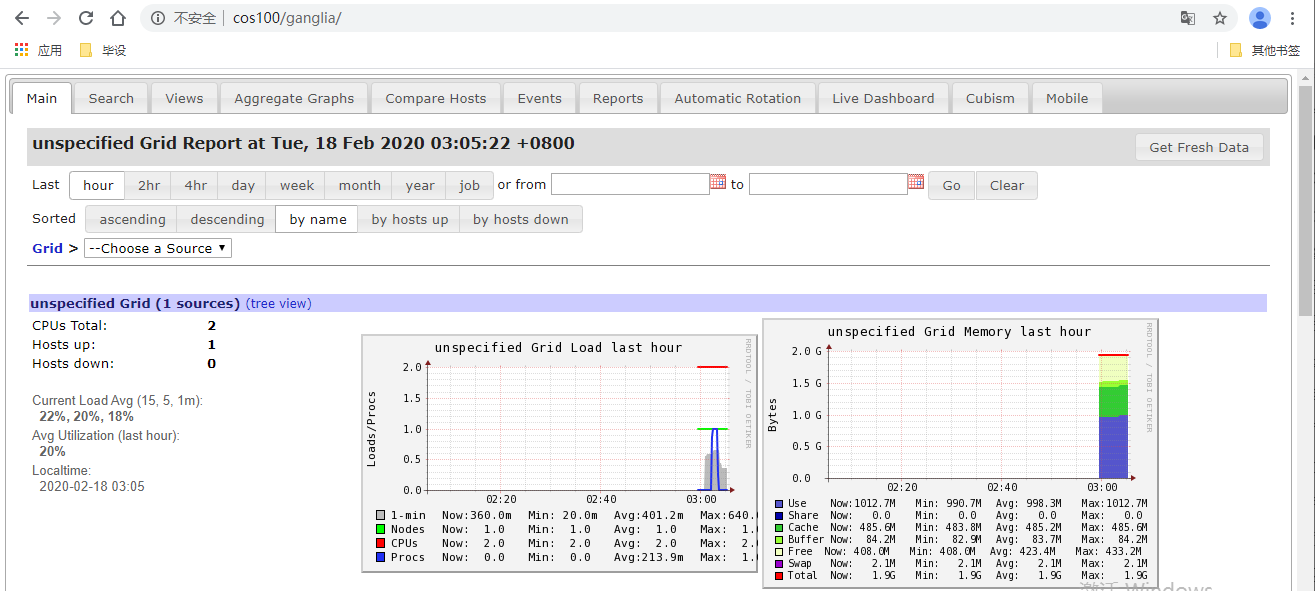 Note: if the above configuration is completed, the access page display permission is insufficient, as shown in the following figure:
This situation is caused by insufficient permission of / var/lib/ganglia directory. Granting permission is enough
[root@cos100 flume]# sudo chmod -R 777 /var/lib/ganglia
2, Monitoring Flume with Ganglia
1. Modify Flume configuration file flume-env.sh
[root@cos100 flume]# vim conf/flume-env.sh
Add the following to the document:
JAVA_OPTS="-Dflume.monitoring.type=ganglia
-Dflume.monitoring.hosts=cos100:8649
-Xms100m
-Xmx200m"
2. Start Flume task
[root@cos100 flume]# bin/flume-ng agent --conf conf/ --name a1 --conf-file job/flume-netcat-logger.conf -Dflume.root.logger==INFO,console -Dflume.monitoring.type=ganglia -Dflume.monitoring.hosts=cos100:8649
At this time, you can view the status of Flume on the webpage, as shown in the following red box
1). Grid drop-down box select Source as native host name
2) . click Select to enter the new web page and continue to select Node as the local host name
3) . click "select" to enter the webpage, and select "Metric Group" as flume in the drop-down box on the right below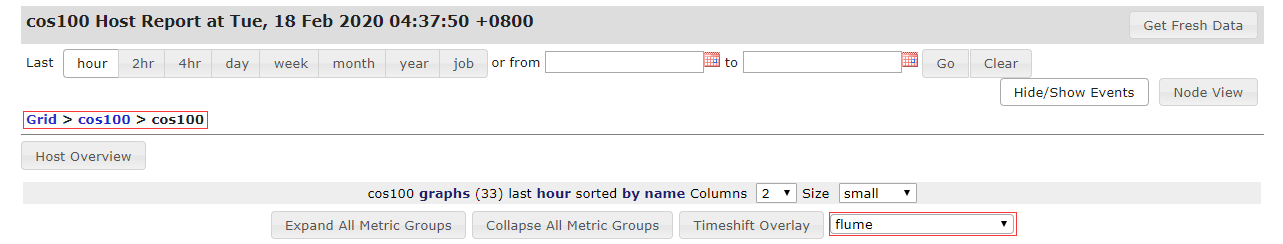
After selection, the status page of Flume will be displayed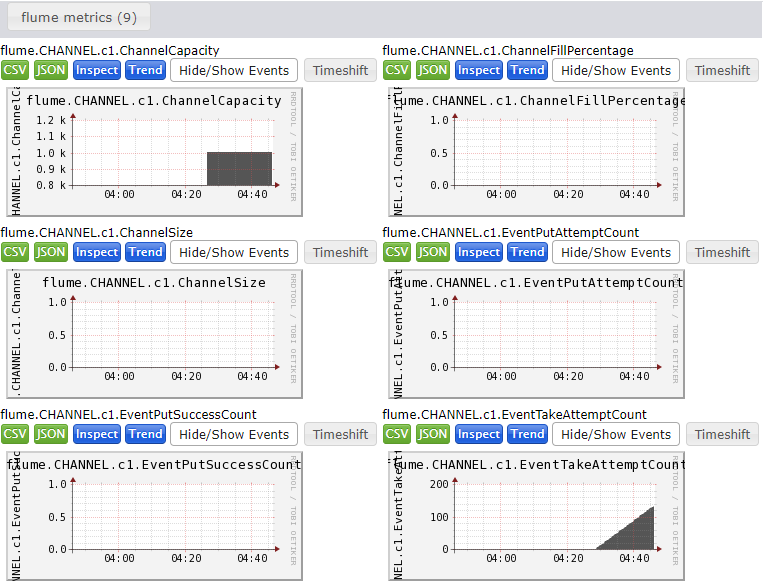
At this time, Flume is monitored by Ganglia in real time.
3. Send data to observe Ganglia monitoring chart
Open a new client window to produce data in real time through netcat
[root@cos100 flume]# nc localhost 44444
hello world
OK
The server monitoring page displays:
2020-02-18 04:59:02,343 (SinkRunner-PollingRunner-DefaultSinkProcessor) [INFO - org.apache.flume.sink.LoggerSink.process(LoggerSink.java:95)] Event: { headers:{} body: 68 65 6C 6C 6F 20 77 6F 72 6C 64 20 hello world
The webpage Flume monitoring page displays: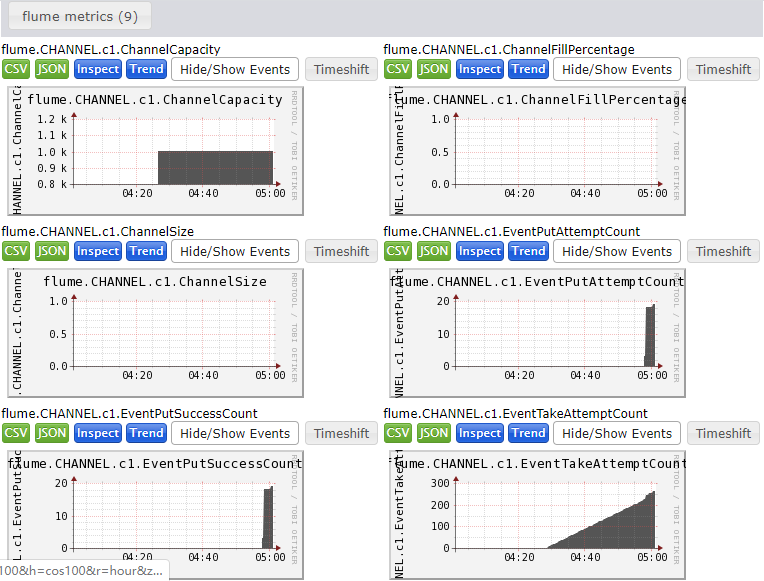
The following is the specific description of each monitoring page:
| Chart name | Specific instructions |
|---|---|
| EventPutAttemptCount | source total number of events trying to write to channel |
| EventPutSuccessCount | Total number of events successfully written to channel and submitted |
| EventTakeAttemptCount | The total number of events that sink attempts to pull from the channel. This does not mean that every event is returned, because the channel may not have any data when the sink is pulled. |
| EventTakeSuccessCount | Total number of events successfully read by sink |
| StartTime | channel start time (MS) |
| StopTime | channel stop time (MS) |
| ChannelSize | Total number of events in the current channel |
| ChannelFillPercentage | channel percentage |
| ChannelCapacity | channel capacity |
Complete!

