Preface
Recommend: Android learning PDF + Architecture Video + interview document + source notes
In the actual development, the proportion of testing and debugging time is relatively high in the total development time. When repairing product defects, we usually need to observe the value of an object in real time. Although output can be in the form of Log, in some cases, using better debugging tools can make it easier to observe these values.
Imagine that if you need to observe the values of all variables in a collection or an object, what do you need to do to simply use Log?
You may think of using loops, or you may use the "." operator to value variables in an object multiple times in the code that outputs Log. This makes writing the Log output statement itself complicated, and it may also run the risk of null pointers.
This article covers all debugging methods of the Flutter App code. Through this Chat learning, you will get the following knowledge:
- Recognize Dart language checker;
- How to debug step by step in IDE;
- Printing Log skills;
- Using "assertion" in Dart language;
- How to view the Widget tree level of the interface;
- How to get the semantic tree.
Let's learn one by one.
Recognize Dart language checker
Before running the application, using Dart language checker to analyze the code can help developers eliminate some code hidden dangers.
Of course, if the reader is using Android Studio, the Dart checker is automatically enabled by default.
To test the code manually, you can execute it in the project root directory:
flutter analyze
Command, the results of the check are later displayed in the command line dialog box. For example, in the default new counter application, remove the semicolon at the end of a statement:
void _incrementCounter() {
  setState(() {
    _counter++
  });
}
Do you see a semicolon missing behind the counter +?
At this point, run the Dart checker, and the command line output is:
error - Expected to find ';' - lib\main.dart:32:15 - expected_token
1 issue found. (ran in 8.9s)
How to debug step by step in IDE
At some point, we need to do a step-by-step debugging. Single step debugging allows the program to be executed one by one, and the current running position can be seen. In addition, in the process of single step debugging, we can also pay attention to the detailed change process of all variable values in the corresponding range in real time.
One step debugging is available in Android Studio. This is the same as the one-step debugging method when developing native Android platform App. The specific steps can be divided into three steps. The first step is to mark the breakpoint, the second step is to run the program to the breakpoint, and the third step is to use the Debug tool for debugging.
Take the default counter application as an example to observe the change of the counter value in the code and experience the whole process of single step debugging.
The first step is to mark the breakpoint. Since you want to observe the change of the counter value, add the breakpoint after each change of the counter value. It is ideal to observe the change of the value. Therefore, click the mouse slightly to the right of the line number to load the breakpoint into the position shown in the figure below.

After adding a breakpoint, a circular breakpoint marker will appear to the right of the corresponding line number, and the entire line will be highlighted.
At this point, the breakpoint is added, and of course, multiple breakpoints can be added at the same time to realize debugging in multiple locations.
The next step is to run the program. Different from the previous operation mode, this time you need to start the App in debug mode. Click the bug icon on the toolbar above Android Studio, as shown in the following figure:

Wait a moment, and the program starts. Since the location where we add breakpoints will be run immediately after the program starts, we can enter the debugging view without any other operations. If the breakpoint location is not executed as soon as the program starts, you need to manually run the program to the breakpoint location.
The following figure shows the IDE view when the code runs to the breakpoint location. It automatically enters the Debug view mode:
Here are two methods to get the value of counter. One is to execute the expression at the code, as shown in the following figure:
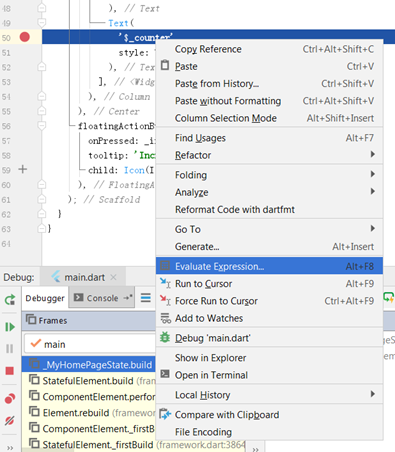
Right click the corresponding variable, select Evaluate Expression in the pop-up menu, and finally click Evaluate in the pop-up dialog box to get the operation result as shown in the following figure:

In addition, if the obtained value is an object, you can use the "." operator in the expression input box at the top of the window to call the method of the object to get the corresponding operation result.
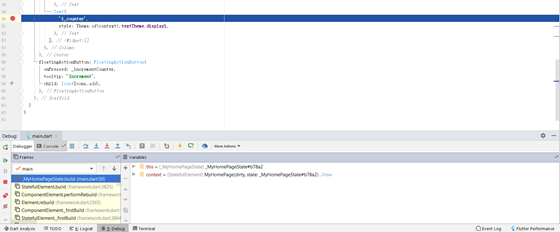
The other way is through the debug view at the bottom of the window, where there will be a more complete display of variable values, which are presented in the form of a tree.
We can expand the tree structure in turn to find the counter value, as shown in the following figure:

Next, keep the App running, and then click the FloatingActionButton in the lower right corner of the interface to verify the accuracy of the counter value after clicking. At this time, you need to click the "run to next breakpoint" button, as shown in the following figure:

After clicking this button, the program will continue to run until the next breakpoint.
This example adds only one breakpoint, so the program stays here again. As shown in the figure below, after clicking the FloatingActionButton, the program stops at the breakpoint position again. At this time, the counter value has changed, and the calculation of auto increment 1 is completed, and the result is correct.

We can exit the debugging mode at any time by clicking the stop operation button, which is located on the right side of the start debugging mode button.

After clicking this button, Android Studio will exit debugging mode, and programs running on the device will also be forced to close.
Printing Log skills;
In order to track and record the operation of the software, developers usually output logs, which are invisible to users. The traditional iOS and Android platforms provide complete Log output function, and Flutter is no exception. To view the Flutter's logs in real time, simply enter:
flutter logs
Yes. In Android Studio and Visual Studio Code, console is integrated by default. You can use the integrated console or start a new console. Note here that once the above command is executed, the console will enter an exclusive state, that is, other commands can no longer be used, unless Log viewing is interrupted.
When we want to output a Log somewhere in the program, we usually use the debugPrint() method. Combined with the previous example, modify the original main() method, add a Log output, the content is "I started to start", unmodified Code:
void main() => runApp(MyApp());
Code after adding Log:
void main() {
  debugPrint("I started");
  runApp(MyApp());
}
Use the fluent logs command in the console to monitor the Log output, and then reinstall and run the program. The console output:
I / flitter (12705): I started
The results are as follows:

To end monitoring Log output, you can use the Control + C key combination, then enter y, enter to confirm, or directly close the console. Finally, it should be noted that in order to ensure that the Log output is correct, it is recommended that you use English output instead of Chinese. Because in some cases, it may cause display garbled. After testing, start the command prompt under the English version of Windows, and execute the above example, you will get the following output:
I/flutter (13320): æˆ'开始å¯åŠ¨äº†
Using "assertion" in Dart language;
Dart runtime provides two modes of operation: Production and Checked. By default, it will run in Production mode. In this condition, performance is given priority and type checking and assertion are turned off. On the contrary, Checked mode is more conducive to debugging in development stage.
Assertions can check for some possible runtime logic errors in a program. For example, the following code:
// assert
var intValue = 300;
assert(intValue == 299);
Obviously, intValue does not meet the same conditions as 299. When running the program in the development environment, you will see the console error. Once you switch to production mode, you will not receive any error prompts. This is very effective for checking some implicit logic problems in the code.
How to view the Widget tree level of the interface;
Each layer in the Flutter framework provides a way to dump the current status or events, and the dumped information will be output to the console through debugPrint().
Next, let's explore the method and content of Log dump layer by layer.
Component layer
To dump the state of the component layer, you need to call the debugdumpapp() method.
The premise of ensuring that the method takes effective Log is to ensure that the App constructs at least one component and does not invoke it in the build() process.
Take the new counter application as an example, add a button to create a component layer log dump, and execute the debugdumpapp() method after the user clicks the button. The specific implementation is as follows:
import 'package:flutter/material.dart';
void main() => runApp(MyApp());
class MyApp extends StatelessWidget {
  @override
  Widget build(BuildContext context) {
    return MaterialApp(
      title: 'Flutter Demo',
      theme: ThemeData(
        primarySwatch: Colors.blue,
      ),
      home: MyHomePage(title: 'Flutter Demo Home Page'),
    );
  }
}
class MyHomePage extends StatefulWidget {
  MyHomePage({Key key, this.title}) : super(key: key);
  final String title;
  @override
  _MyHomePageState createState() => _MyHomePageState();
}
class _MyHomePageState extends State<MyHomePage> {
  int _counter = 0;
  void _incrementCounter() {
    setState(() {
      _counter++;
    });
  }
  @override
  Widget build(BuildContext context) {
    return Scaffold(
      appBar: AppBar(
        title: Text(widget.title),
      ),
      body: Center(
        child: Column(
          mainAxisAlignment: MainAxisAlignment.center,
          children: <Widget>[
            Text(
              'You have pushed the button this many times:',
            ),
            Text(
              '$_counter',
              style: Theme.of(context).textTheme.display1,
            ),
            RaisedButton(
                onPressed: () => debugDumpApp(),
                child: Text("Create app dump")),
          ],
        ),
      ),
      floatingActionButton: FloatingActionButton(
        onPressed: _incrementCounter,
        tooltip: 'Increment',
        child: Icon(Icons.add),
      ),
    );
  }
}
Note the newly added RaisedButton.
Run the above code, and then click this button, you can see the following output of the console (excerpt):
I/flutter ( 4489): WidgetsFlutterBinding - CHECKED MODE
I/flutter ( 4489): [root](renderObject: RenderView#d27b1)
I/flutter ( 4489): └MyApp
I/flutter ( 4489):  └MaterialApp(state: _MaterialAppState#51668)
I/flutter ( 4489):   └ScrollConfiguration(behavior: _MaterialScrollBehavior)
I/flutter ( 4489):    └WidgetsApp-[GlobalObjectKey _MaterialAppState#51668](state:
_WidgetsAppState#04e30)
I/flutter ( 4489):     └MediaQuery(MediaQueryData(size: Size(411.4, 797.7), devicePixelRatio: 2.6,
textScaleFactor: 1.1, platformBrightness: Brightness.light, padding: EdgeInsets(0.0, 24.0, 0.0, 0.0),
viewInsets: EdgeInsets.zero, alwaysUse24HourFormat: true, accessibleNavigation:
falsedisableAnimations: falseinvertColors: falseboldText: false))
I/flutter ( 4489):      └Localizations(locale: en_US, delegates:
[DefaultMaterialLocalizations.delegate(en_US), DefaultCupertinoLocalizations.delegate(en_US),
DefaultWidgetsLocalizations.delegate(en_US)], state: _LocalizationsState#c0c98)
I/flutter ( 4489):       └Semantics(container: false, properties: SemanticsProperties, label: null, value:
null, hint: null, textDirection: ltr, hintOverrides: null, renderObject: RenderSemanticsAnnotations#31c77)
I/flutter ( 4489):        └_LocalizationsScope-[GlobalKey#60b05]
I/flutter ( 4489):         └Directionality(textDirection: ltr)
I/flutter ( 4489):          └Title(title: "Flutter Demo", color: MaterialColor(primary value:
Color(0xff2196f3)))
I/flutter ( 4489):           └CheckedModeBanner("DEBUG")
I/flutter ( 4489):            └Banner("DEBUG", textDirection: ltr, location: topEnd, Color(0xa0b71c1c),
text inherit: true, text color: Color(0xffffffff), text size: 10.2, text weight: 900, text height: 1.0x, dependencies:
[Directionality])
I/flutter ( 4489):             └CustomPaint(renderObject: RenderCustomPaint#c2a34)
I/flutter ( 4489):              └DefaultTextStyle(debugLabel: fallback style; consider putting your text in a
Material, inherit: true, color: Color(0xd0ff0000), family: monospace, size: 48.0, weight: 900, decoration:
double Color(0xffffff00) TextDecoration.underline, softWrap: wrapping at box width, overflow: clip)
I/flutter ( 4489):               └Builder(dependencies: [MediaQuery])
......
The actual output is several times more than the excerpt above.
At first glance, these contents seem to be very complex, but after careful observation, it is found that the dump information of component layer is actually a list of all components according to the tree structure. It contains the style, value and other information of the component. Of course, you will also see some components that are not reflected in the code. This is because these components are used in the components of the framework itself. For example, although the InkWell in RaisedButton is not implemented by code, RaisedButton itself uses the InkWell component to achieve the corresponding effect.
In addition, in the dump information, a component will be marked as dirty because the creation of the dump information is triggered by that component. In this example, the components marked dirty are as follows:
RaisedButton(dependencies: [_LocalizationsScope-[GlobalKey#60b05], _InheritedTheme])
└RawMaterialButton(dirty, state: _RawMaterialButtonState#fe2da)
As you can see, it's just a button added to execute the debugDumpApp() method.
Render layer
From the previous section, we know that the component layer provides detailed information about each component. However, in some cases, this information is not enough. At this time, you can call the debugDumpRenderTree() method to dump the render layer.
Based on the example in the previous section, continue to add a button whose operation is to trigger the debugDumpRenderTree() method. As follows:
RaisedButton(
    onPressed: () => debugDumpRenderTree(),
    child: Text("Create render tree dump"))
After the program runs, click this button to observe the console output (excerpt):
I/flutter ( 7255): RenderView#7e860
I/flutter ( 7255):  │ debug mode enabled - android
I/flutter ( 7255):  │ window size: Size(1080.0, 2094.0) (in physical pixels)
I/flutter ( 7255):  │ device pixel ratio: 2.6 (physical pixels per logical pixel)
I/flutter ( 7255):  │ configuration: Size(411.4, 797.7) at 2.625x (in logical pixels)
I/flutter ( 7255):  │
I/flutter ( 7255):  └─child: RenderSemanticsAnnotations#62d7d
I/flutter ( 7255):    │ creator: Semantics ← Localizations ← MediaQuery ←
I/flutter ( 7255):    │   WidgetsApp-[GlobalObjectKey _MaterialAppState#d0498] ←
I/flutter ( 7255):    │   ScrollConfiguration ← MaterialApp ← MyApp ← [root]
I/flutter ( 7255):    │ parentData: <none>
I/flutter ( 7255):    │ constraints: BoxConstraints(w=411.4, h=797.7)
I/flutter ( 7255):    │ size: Size(411.4, 797.7)
I/flutter ( 7255):    │
I/flutter ( 7255):    └─child: RenderCustomPaint#e2d03
I/flutter ( 7255):      │ creator: CustomPaint ← Banner ← CheckedModeBanner ← Title ←
I/flutter ( 7255):      │   Directionality ← _LocalizationsScope-[GlobalKey#6be84] ←
I/flutter ( 7255):      │   Semantics ← Localizations ← MediaQuery ←
I/flutter ( 7255):      │   WidgetsApp-[GlobalObjectKey _MaterialAppState#d0498] ←
I/flutter ( 7255):      │   ScrollConfiguration ← MaterialApp ← ⋯
I/flutter ( 7255):      │ parentData: <none> (can use size)
I/flutter ( 7255):      │ constraints: BoxConstraints(w=411.4, h=797.7)
I/flutter ( 7255):      │ size: Size(411.4, 797.7)
I/flutter ( 7255):      │
I/flutter ( 7255):      └─child: RenderPointerListener#9b873
I/flutter ( 7255):        │ creator: Listener ← Navigator-[GlobalObjectKey<NavigatorState>
I/flutter ( 7255):        │   _WidgetsAppState#74612] ← IconTheme ← IconTheme ←
I/flutter ( 7255):        │   _InheritedCupertinoTheme ← CupertinoTheme ← _InheritedTheme ←
I/flutter ( 7255):        │   Theme ← AnimatedTheme ← Builder ← DefaultTextStyle ←
I/flutter ( 7255):        │   CustomPaint ← ⋯
I/flutter ( 7255):        │ parentData: <none> (can use size)
I/flutter ( 7255):        │ constraints: BoxConstraints(w=411.4, h=797.7)
I/flutter ( 7255):        │ size: Size(411.4, 797.7)
I/flutter ( 7255):        │ behavior: deferToChild
I/flutter ( 7255):        │ listeners: down, up, cancel
I/flutter ( 7255):        │
I/flutter ( 7255):        └─child: RenderAbsorbPointer#52153
I/flutter ( 7255):          │ creator: AbsorbPointer ← Listener ←
......
This excerpt is still much less than the actual output.
However, these dumps usually only focus on the size and constraints parameters. Because they represent size and constraints. In addition, for box constraints, there may be a relayoutSubtreeRoot, which indicates how many parent controls depend on the size of the component.
Layer synthesis
If you want to debug problems with composition, you need to dump information about the hierarchy.
The way to dump hierarchical relationships is debugDumpLayerTree(). We continue to add a button that triggers the debugdumplayertree () method. As follows:
RaisedButton(
    onPressed: () => debugDumpLayerTree(),
    child: Text("Create layer tree dump"))
Run and click this button to get the console output:
I/flutter (10050): TransformLayer#256a4
I/flutter (10050):  │ owner: RenderView#6c917
I/flutter (10050):  │ creator: [root]
I/flutter (10050):  │ offset: Offset(0.0, 0.0)
I/flutter (10050):  │ transform:
I/flutter (10050):  │   [0] 2.625,0.0,0.0,0.0
I/flutter (10050):  │   [1] 0.0,2.625,0.0,0.0
I/flutter (10050):  │   [2] 0.0,0.0,1.0,0.0
I/flutter (10050):  │   [3] 0.0,0.0,0.0,1.0
I/flutter (10050):  │
I/flutter (10050):  ├─child 1: OffsetLayer#03fdc
I/flutter (10050):  │ │ creator: RepaintBoundary ← _FocusScopeMarker ← Semantics ←
I/flutter (10050):  │ │   FocusScope ← PageStorage ← Offstage ← _ModalScopeStatus ←
I/flutter (10050):  │ │
_ModalScope<dynamic>-[LabeledGlobalKey<_ModalScopeState<dynamic>>#ea0b8]
I/flutter (10050):  │ │   ← _OverlayEntry-[LabeledGlobalKey<_OverlayEntryState>#d7b44] ←
I/flutter (10050):  │ │   Stack ← _Theatre ←
I/flutter (10050):  │ │   Overlay-[LabeledGlobalKey<OverlayState>#404b4] ← ⋯
I/flutter (10050):  │ │ offset: Offset(0.0, 0.0)
I/flutter (10050):  │ │
I/flutter (10050):  │ └─child 1: OffsetLayer#9ca96
I/flutter (10050):  │   │ creator: RepaintBoundary-[GlobalKey#71e3e] ← IgnorePointer ←
I/flutter (10050):  │   │   FadeTransition ← FractionalTranslation ← SlideTransition ←
I/flutter (10050):  │   │   _FadeUpwardsPageTransition ← AnimatedBuilder ← RepaintBoundary
I/flutter (10050):  │   │   ← _FocusScopeMarker ← Semantics ← FocusScope ← PageStorage ← ⋯
I/flutter (10050):  │   │ offset: Offset(0.0, 0.0)
I/flutter (10050):  │   │
I/flutter (10050):  │   └─child 1: PhysicalModelLayer#9986e
I/flutter (10050):  │     │ creator: PhysicalModel ← AnimatedPhysicalModel ← Material ←
I/flutter (10050):  │     │   PrimaryScrollController ← _ScaffoldScope ← Scaffold ←
I/flutter (10050):  │     │   MyHomePage ← Semantics ← Builder ←
I/flutter (10050):  │     │   RepaintBoundary-[GlobalKey#71e3e] ← IgnorePointer ←
I/flutter (10050):  │     │   FadeTransition ← ⋯
I/flutter (10050):  │     │ elevation: 0.0
I/flutter (10050):  │     │ color: Color(0xfffafafa)
I/flutter (10050):  │     │
I/flutter (10050):  │     ├─child 1: PictureLayer#1f44b
I/flutter (10050):  │     │   paint bounds: Rect.fromLTRB(0.0, 0.0, 411.4, 797.7)
I/flutter (10050):  │     │
I/flutter (10050):  │     ├─child 2: PhysicalModelLayer#e486c
I/flutter (10050):  │     │ │ creator: PhysicalShape ← _MaterialInterior ← Material ←
I/flutter (10050):  │     │ │   ConstrainedBox ← _InputPadding ← Semantics ← RawMaterialButton
I/flutter (10050):  │     │ │   ← RaisedButton ← Column ← Center ← MediaQuery ←
I/flutter (10050):  │     │ │   LayoutId-[<_ScaffoldSlot.body>] ← ⋯
I/flutter (10050):  │     │ │ elevation: 2.0
I/flutter (10050):  │     │ │ color: Color(0xffe0e0e0)
I/flutter (10050):  │     │ │
I/flutter (10050):  │     │ └─child 1: PictureLayer#225de
I/flutter (10050):  │     │     paint bounds: Rect.fromLTRB(130.2, 403.9, 281.2, 439.9)
I/flutter (10050):  │     │
I/flutter (10050):  │     ├─child 3: PhysicalModelLayer#f4d9a
I/flutter (10050):  │     │ │ creator: PhysicalShape ← _MaterialInterior ← Material ←
I/flutter (10050):  │     │ │   ConstrainedBox ← _InputPadding ← Semantics ← RawMaterialButton
I/flutter (10050):  │     │ │   ← RaisedButton ← Column ← Center ← MediaQuery ←
I/flutter (10050):  │     │ │   LayoutId-[<_ScaffoldSlot.body>] ← ⋯
I/flutter (10050):  │     │ │ elevation: 2.0
I/flutter (10050):  │     │ │ color: Color(0xffe0e0e0)
I/flutter (10050):  │     │ │
I/flutter (10050):  │     │ └─child 1: PictureLayer#c7baf
I/flutter (10050):  │     │     paint bounds: Rect.fromLTRB(105.2, 451.9, 306.2, 487.9)
I/flutter (10050):  │     │
I/flutter (10050):  │     ├─child 4: PhysicalModelLayer#eb57b
I/flutter (10050):  │     │ │ creator: PhysicalShape ← _MaterialInterior ← Material ←
I/flutter (10050):  │     │ │   ConstrainedBox ← _InputPadding ← Semantics ← RawMaterialButton
I/flutter (10050):  │     │ │   ← RaisedButton ← Column ← Center ← MediaQuery ←
I/flutter (10050):  │     │ │   LayoutId-[<_ScaffoldSlot.body>] ← ⋯
I/flutter (10050):  │     │ │ elevation: 2.0
I/flutter (10050):  │     │ │ color: Color(0xffe0e0e0)
I/flutter (10050):  │     │ │
I/flutter (10050):  │     │ └─child 1: PictureLayer#2350d
I/flutter (10050):  │     │     paint bounds: Rect.fromLTRB(111.2, 499.9, 300.2, 535.9)
I/flutter (10050):  │     │
I/flutter (10050):  │     ├─child 5: AnnotatedRegionLayer<SystemUiOverlayStyle>#a5e42
I/flutter (10050):  │     │ │ value: {systemNavigationBarColor: 4278190080,
I/flutter (10050):  │     │ │   systemNavigationBarDividerColor: null, statusBarColor: null,
I/flutter (10050):  │     │ │   statusBarBrightness: Brightness.dark, statusBarIconBrightness:
I/flutter (10050):  │     │ │   Brightness.light, systemNavigationBarIconBrightness:
I/flutter (10050):  │     │ │   Brightness.light}
I/flutter (10050):  │     │ │ size: Size(411.4, 80.0)
I/flutter (10050):  │     │ │ offset: Offset(0.0, 0.0)
I/flutter (10050):  │     │ │
I/flutter (10050):  │     │ └─child 1: PhysicalModelLayer#32968
I/flutter (10050):  │     │   │ creator: PhysicalModel ← AnimatedPhysicalModel ← Material ←
I/flutter (10050):  │     │   │   AnnotatedRegion<SystemUiOverlayStyle> ← Semantics ← AppBar ←
I/flutter (10050):  │     │   │   FlexibleSpaceBarSettings ← ConstrainedBox ← MediaQuery ←
I/flutter (10050):  │     │   │   LayoutId-[<_ScaffoldSlot.appBar>] ← CustomMultiChildLayout ←
I/flutter (10050):  │     │   │   AnimatedBuilder ← ⋯
I/flutter (10050):  │     │   │ elevation: 4.0
I/flutter (10050):  │     │   │ color: MaterialColor(primary value: Color(0xff2196f3))
I/flutter (10050):  │     │   │
I/flutter (10050):  │     │   └─child 1: PictureLayer#e562b
I/flutter (10050):  │     │       paint bounds: Rect.fromLTRB(0.0, 0.0, 411.4, 80.0)
I/flutter (10050):  │     │
I/flutter (10050):  │     └─child 6: TransformLayer#4e3f3
I/flutter (10050):  │       │ offset: Offset(0.0, 0.0)
I/flutter (10050):  │       │ transform:
I/flutter (10050):  │       │   [0] 1.0,2.4492935982947064e-16,0.0,-1.7053025658242404e-13
I/flutter (10050):  │       │   [1] -2.4492935982947064e-16,1.0,0.0,1.1368683772161603e-13
I/flutter (10050):  │       │   [2] 0.0,0.0,1.0,0.0
I/flutter (10050):  │       │   [3] 0.0,0.0,0.0,1.0
I/flutter (10050):  │       │
I/flutter (10050):  │       └─child 1: PhysicalModelLayer#79c2c
I/flutter (10050):  │         │ creator: PhysicalShape ← _MaterialInterior ← Material ←
I/flutter (10050):  │         │   ConstrainedBox ← _InputPadding ← Semantics ← RawMaterialButton
I/flutter (10050):  │         │   ← Semantics ← Listener ← RawGestureDetector ← GestureDetector ←
I/flutter (10050):  │         │   Tooltip ← ⋯
I/flutter (10050):  │         │ elevation: 6.0
I/flutter (10050):  │         │ color: Color(0xff2196f3)
I/flutter (10050):  │         │
I/flutter (10050):  │         └─child 1: PictureLayer#0e8dc
I/flutter (10050):  │             paint bounds: Rect.fromLTRB(339.4, 725.7, 395.4, 781.7)
I/flutter (10050):  │
I/flutter (10050):  └─child 2: PictureLayer#1ae80
I/flutter (10050):      paint bounds: Rect.fromLTRB(0.0, 0.0, 1080.0, 2094.0)
I/flutter (10050):
This is the full output. Because the combination of interface levels is very simple, the Log of this part will be shorter.
In the Log above, the RepaintBoundary component creates a renderremainboundary in the rendering tree to create a new layer in the hierarchical tree structure. This step is used to reduce the need for redrawing.
How to get the semantic tree.
Semantic debugging is usually used in apps that provide system auxiliary functions. When the system auxiliary functions are enabled, the system will understand what a component does according to the semantics provided by the App, or simply indicate the content of the component.
Debugging semantics is actually outputting "semantic tree". Different from the previous two sections, to obtain the semantic tree, you must first make a declaration at the beginning, as follows:
class MyApp extends StatelessWidget {
  @override
  Widget build(BuildContext context) {
    return MaterialApp(
      showSemanticsDebugger: true,
      title: 'Flutter Demo',
      theme: ThemeData(
        primarySwatch: Colors.blue,
      ),
      home: MyHomePage(title: 'Flutter Demo Home Page'),
    );
  }
}
Pay special attention to the showSemanticsDebugger in the above code, which is the premise to enable semantic debugging.
The next step is to add semantic tree output. This step is similar to the previous two sections, as follows:
RaisedButton(
    onPressed: () => debugDumpSemanticsTree(DebugSemanticsDumpOrder.traversalOrder),
    child: Text("Create semantics tree dump"))
At this time, run App to get the interface as shown in the figure below, which means the configuration is successful.

At this time, click the debug semantics button to observe the output of the console:
I/flutter ( 8341): SemanticsNode#0
I/flutter ( 8341):  │ Rect.fromLTRB(0.0, 0.0, 1080.0, 1794.0)
I/flutter ( 8341):  │
I/flutter ( 8341):  └─SemanticsNode#1
I/flutter ( 8341):    │ Rect.fromLTRB(0.0, 0.0, 411.4, 683.4) scaled by 2.6x
I/flutter ( 8341):    │ textDirection: ltr
I/flutter ( 8341):    │
I/flutter ( 8341):    └─SemanticsNode#2
I/flutter ( 8341):      │ Rect.fromLTRB(0.0, 0.0, 411.4, 683.4)
I/flutter ( 8341):      │ flags: scopesRoute
I/flutter ( 8341):      │
I/flutter ( 8341):      ├─SemanticsNode#9
I/flutter ( 8341):      │ │ Rect.fromLTRB(0.0, 0.0, 411.4, 80.0)
I/flutter ( 8341):      │ │ thicknes: 4.0
I/flutter ( 8341):      │ │
I/flutter ( 8341):      │ └─SemanticsNode#10
I/flutter ( 8341):      │     Rect.fromLTRB(16.0, 40.5, 242.0, 63.5)
I/flutter ( 8341):      │     flags: isHeader, namesRoute
I/flutter ( 8341):      │     label: "Flutter Demo Home Page"
I/flutter ( 8341):      │     textDirection: ltr
I/flutter ( 8341):      │     elevation: 4.0
I/flutter ( 8341):      │
I/flutter ( 8341):      ├─SemanticsNode#3
I/flutter ( 8341):      │   Rect.fromLTRB(65.7, 257.7, 345.7, 273.7)
I/flutter ( 8341):      │   label: "You have pushed the button this many times:"
I/flutter ( 8341):      │   textDirection: ltr
I/flutter ( 8341):      │
I/flutter ( 8341):      ├─SemanticsNode#4
I/flutter ( 8341):      │   Rect.fromLTRB(195.7, 273.7, 215.7, 313.7)
I/flutter ( 8341):      │   label: "0"
I/flutter ( 8341):      │   textDirection: ltr
I/flutter ( 8341):      │
I/flutter ( 8341):      ├─SemanticsNode#5
I/flutter ( 8341):      │   Rect.fromLTRB(135.7, 313.7, 275.7, 361.7)
I/flutter ( 8341):      │   actions: tap
I/flutter ( 8341):      │   flags: isButton, hasEnabledState, isEnabled
I/flutter ( 8341):      │   label: "Create app dump"
I/flutter ( 8341):      │   textDirection: ltr
I/flutter ( 8341):      │   thicknes: 2.0
I/flutter ( 8341):      │
I/flutter ( 8341):      ├─SemanticsNode#6
I/flutter ( 8341):      │   Rect.fromLTRB(113.2, 361.7, 298.2, 409.7)
I/flutter ( 8341):      │   actions: tap
I/flutter ( 8341):      │   flags: isButton, hasEnabledState, isEnabled
I/flutter ( 8341):      │   label: "Create render tree dump"
I/flutter ( 8341):      │   textDirection: ltr
I/flutter ( 8341):      │   thicknes: 2.0
I/flutter ( 8341):      │
I/flutter ( 8341):      ├─SemanticsNode#7
I/flutter ( 8341):      │   Rect.fromLTRB(118.2, 409.7, 293.2, 457.7)
I/flutter ( 8341):      │   actions: tap
I/flutter ( 8341):      │   flags: isButton, hasEnabledState, isEnabled
I/flutter ( 8341):      │   label: "Create layer tree dump"
I/flutter ( 8341):      │   textDirection: ltr
I/flutter ( 8341):      │   thicknes: 2.0
I/flutter ( 8341):      │
I/flutter ( 8341):      ├─SemanticsNode#8
I/flutter ( 8341):      │   Rect.fromLTRB(100.7, 457.7, 310.7, 505.7)
I/flutter ( 8341):      │   actions: tap
I/flutter ( 8341):      │   flags: isButton, hasEnabledState, isEnabled
I/flutter ( 8341):      │   label: "Create semantics tree dump"
I/flutter ( 8341):      │   textDirection: ltr
I/flutter ( 8341):      │   thicknes: 2.0
I/flutter ( 8341):      │
I/flutter ( 8341):      └─SemanticsNode#11
I/flutter ( 8341):        │ merge boundary ⛔️
I/flutter ( 8341):        │ Rect.fromLTRB(0.0, 0.0, 56.0, 56.0) with transform
I/flutter ( 8341):        │   [1.0,2.4492935982947064e-16,0.0,339.42857142857144;
I/flutter ( 8341):        │   -2.4492935982947064e-16,1.0,0.0,611.4285714285714;
I/flutter ( 8341):        │   0.0,0.0,1.0,0.0; 0.0,0.0,0.0,1.0]
I/flutter ( 8341):        │ label: "Increment"
I/flutter ( 8341):        │ textDirection: ltr
I/flutter ( 8341):        │
I/flutter ( 8341):        └─SemanticsNode#12
I/flutter ( 8341):            merged up ⬆️
I/flutter ( 8341):            Rect.fromLTRB(0.0, 0.0, 56.0, 56.0)
I/flutter ( 8341):            actions: tap
I/flutter ( 8341):            flags: isButton, hasEnabledState, isEnabled
I/flutter ( 8341):            thicknes: 6.0
I/flutter ( 8341):
OK, that's all.
In the actual development process, the interface of App is usually much more complex than the above example. When using these debugging tools, it is recommended that you do not stick to one of them. Flexible use of tools is an important prerequisite for building an excellent App.
I hope these contents can help you. We'll see you next time.
Recommend: Android learning PDF + Architecture Video + interview document + source notes
Limited time reader benefits
Here I share a PDF + Architecture Video + interview documents + source notes of Android learning collected and organized by myself, advanced brain map of advanced architecture technology, and special materials of Android development interview. Advanced architecture materials help you learn and upgrade, save time for you to search information on the Internet, and also share them with your friends to learn.
If you need to, you can click like + forward, follow me, and then join Android Development Exchange Group (820198451) free
