Too much data is being generated every day.
Although sometimes we can use tools such as Rapids or parallelism to manage big data, Spark is a good tool if you use TB level data.
Although this article explains how to use RDD and basic Dataframe operations, I missed a lot when using PySpark Dataframes.
Only when I need more functions can I read and propose multiple solutions to do one thing.
How do I create a new column in Spark?
Now, that sounds trivial, but trust me, it's not. You may want to work with so much data, so I'm sure you'll end up using most of these column creation processes in your workflow. Sometimes you use the Pandas function, sometimes you use RDD based partitions, sometimes you use a mature python ecosystem.
This article will be about "multiple ways to create a new column in the pspark dataframe.".
If you have PySpark installed, you can skip the getting started section below.
Getting started with Spark
I know that many people will not install Spark in the system to try and learn. But installing Spark itself is a headache.
Because we want to know how it works and how to use it, we recommend that you use Spark on Databricks online with the Community Edition here. Don't worry, it's free. Although there are few resources, it's suitable for us now for learning purposes.

Once registered and logged in, the following screen will be displayed.
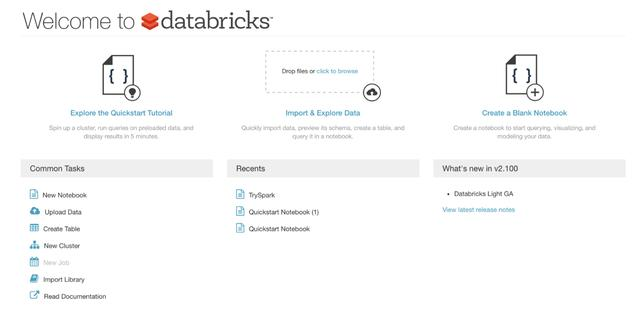
You can start a new notebook here.
Select the Python notebook and name it.
After starting a new notebook and trying to execute any commands, the notebook asks if you want to start a new cluster. Do it.
The next step is to check whether the sparkcontext exists. To check if the sparkcontext exists, you must run the following command:
sc
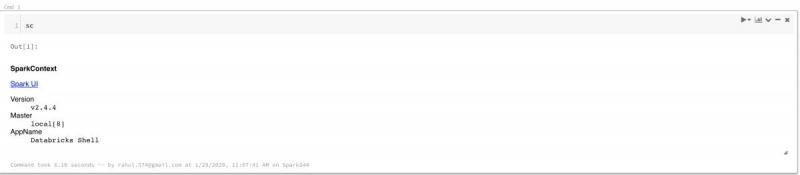
This means that we have set up a laptop that can run Spark.
data
Here, I'll work with the Movielens ml-100k.zip dataset. 1000 users scored 100000 when they watched 1700 movies. In this compressed folder, the file we will use exclusively is the evaluation file. The filename is reserved as "u.data"
If you want to upload this data or any data, you can click the data tab on the left and add the data using the provided GUI.
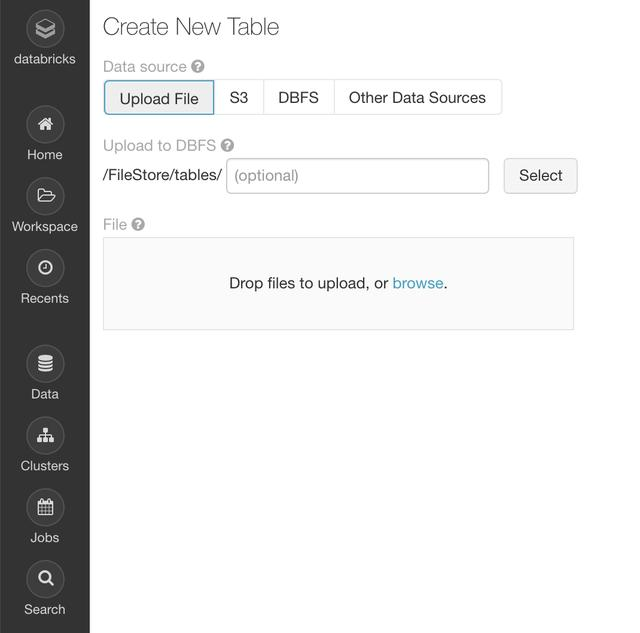
Then, we can load the data using the following command:
ratings = spark.read.load("/FileStore/tables/u.data",format="csv", sep="\t", inferSchema="true", header="false")
ratings = ratings.toDF(*['user_id', 'movie_id', 'rating', 'unix_timestamp'])
The appearance is as follows:
ratings.show()
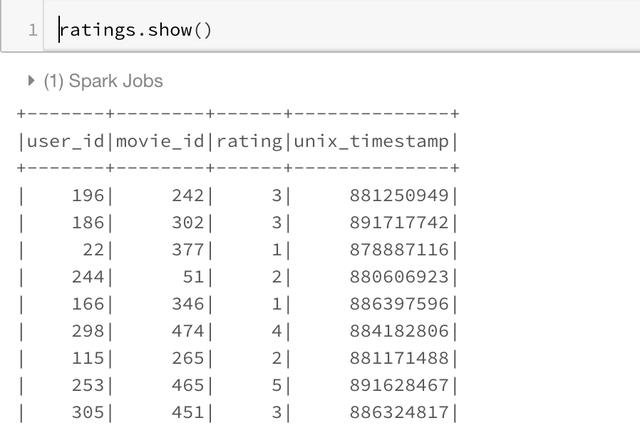
OK, now we're ready to start what we're interested in. How to create a new column in the PySpark Dataframe?
Using Spark native functions
The most pysparkish way to create a new column in a PySpark DataFrame is to use built-in functions. This is the most efficient way to program new columns, so this is the first place I want to do some column operations.
We can use. withcolumn with the PySpark SQL function to create new columns. In essence, you can find String functions, Date functions, and Math functions that have been implemented using spark functions. We can import the spark function as:
import pyspark.sql.functions as F
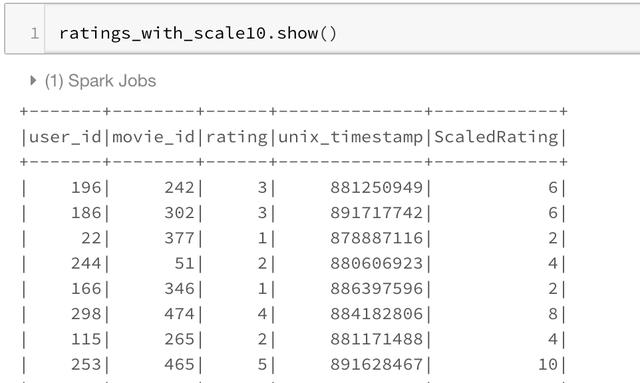
Our first function, the F.col function, allows us to access columns. So if we want to multiply a column by two, we can use F.col as:
ratings_with_scale10 = ratings.withColumn("ScaledRating", 2*F.col("rating"))
ratings_with_scale10.show()
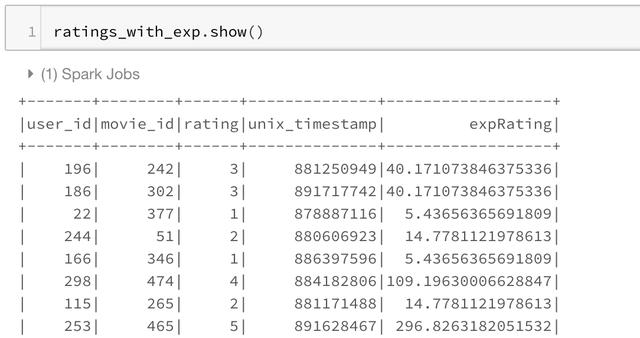
We can also use mathematical functions, such as the F.exp function:
ratings_with_exp = ratings.withColumn("expRating", 2*F.exp("rating"))
ratings_with_exp.show()
Many other functions are provided in this module, enough to satisfy most simple use cases. You can view a list of features here.
Spark UDF
Sometimes we want to do complex things with one or more columns. You can think of it as a mapping operation from a PySpark data frame to a single column or multiple columns. Although Spark SQL functions do solve many use cases related to column creation, I will use Spark UDF whenever I want to use more mature Python functions.
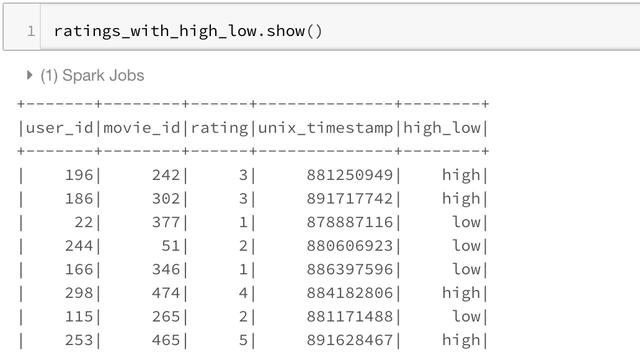
To use Spark UDF, we need to use the F.udf function to convert regular python functions to Spark UDF. We also need to specify the return type of the function. In this example, the return type is StringType()
import pyspark.sql.functions as F
from pyspark.sql.types import *

def somefunc(value):
	if value < 3:
  	return 'low'
	else:
  	return 'high'

#convert to a UDF Function by passing in the function and return type of function
udfsomefunc = F.udf(somefunc, StringType())
ratings_with_high_low = ratings.withColumn("high_low", udfsomefunc("rating"))
ratings_with_high_low.show()
Using RDD
Sometimes, Spark UDF and SQL functions are not enough for a specific use case. You may want to use Spark RDD to get better partitions. Alternatively, you may want to use group functions in Spark RDD. You can use this method mainly when you need to access all the columns in the spark data box inside the python function.
In any case, I find this way of creating new columns using RDD very useful for people with experienced RDD, which is an essential part of the Spark ecosystem.
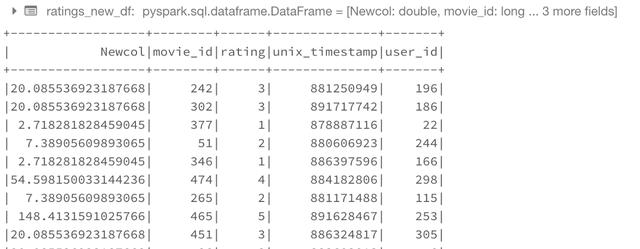
The following procedure uses this capability to transform between Row and python dict objects. We convert the Row object to a dictionary. Use the dictionary as we are accustomed to, and then convert the dictionary back to the Row again.
import math
from pyspark.sql import Row

def rowwise_function(row):
	# convert row to dict:
  row_dict = row.asDict()
	# Add a new key in the dictionary with the new column name and value.
  row_dict['Newcol'] = math.exp(row_dict['rating'])
	# convert dict to row:
  newrow = Row(**row_dict)
	# return new row
  return newrow

# convert ratings dataframe to RDD
ratings_rdd = ratings.rdd
# apply our function to RDD

ratings_rdd_new = ratings_rdd.map(lambda row: rowwise_function(row))

# Convert RDD Back to DataFrame
ratings_new_df = sqlContext.createDataFrame(ratings_rdd_new)
ratings_new_df.show()
Pandas UDF
This feature is introduced in Spark version 2.3.1. This allows you to use the Pands feature in Spark. I usually use it when I need to run the groupby operation on the Spark data frame or need to create a scrolling function and want to use the Pandas scrolling function / window function.
The way we use it is with the f.Pandas \udf decorator. Here we assume that the input of this function will be a panda data box. We need to return a Pandas data box in turn from this function.
The only complexity here is that we have to provide an architecture for the output data frame. We can use the following format to achieve this.
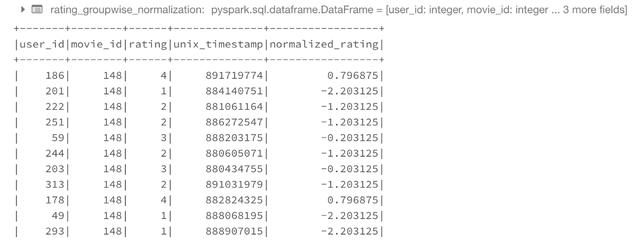
# Declare the schema for the output of our function
outSchema = StructType([StructField('user_id',IntegerType(),True),StructField('movie_id',IntegerType(),True),StructField('rating',IntegerType(),True),StructField('unix_timestamp',IntegerType(),True),StructField('normalized_rating',DoubleType(),True)])
# decorate our function with pandas_udf decorator
@F.pandas_udf(outSchema, F.PandasUDFType.GROUPED_MAP)
def subtract_mean(pdf):
    # pdf is a pandas.DataFrame
    v = pdf.rating
    v = v - v.mean()
    pdf['normalized_rating'] =v
    return pdf
rating_groupwise_normalization = ratings.groupby("movie_id").apply(subtract_mean)
rating_groupwise_normalization.show()
We can also use it to train multiple individual models on each spark node. To do this, we copy the data and provide a key and some training parameters for each copy, such as Max UU depth. Then, our function will use panda Dataframe to run the required model and return the result. The structure is as follows.
# 0. Declare the schema for the output of our function
outSchema = StructType([StructField('replication_id',IntegerType(),True),StructField('RMSE',DoubleType(),True)])
# decorate our function with pandas_udf decorator
@F.pandas_udf(outSchema, F.PandasUDFType.GROUPED_MAP)
def run_model(pdf):
    # 1. Get hyperparam values
    num_trees = pdf.num_trees.values[0]
    depth = pdf.depth.values[0]
    replication_id = pdf.replication_id.values[0]
    # 2. Train test split
    Xtrain,Xcv,ytrain,ycv = train_test_split.....
    # 3. Create model using the pandas dataframe
    clf = RandomForestRegressor(max_depth = depth, num_trees=num_trees,....)
    clf.fit(Xtrain,ytrain)
    # 4. Evaluate the model
    rmse = RMSE(clf.predict(Xcv,ycv)
    # 5. return results as pandas DF
    res =pd.DataFrame({'replication_id':replication_id,'RMSE':rmse})
    return res

results = replicated_data.groupby("replication_id").apply(run_model)
The above is just an idea, not a valid code. Although it should be slightly modified.
Using SQL
For those who like SQL, you can even use SQL to create columns. To do this, we need to register a temporary SQL table and then use a simple select query with additional columns. One can also use it to make connections.
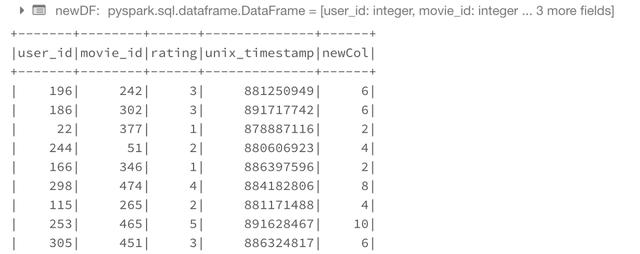
ratings.registerTempTable('ratings_table')
newDF = sqlContext.sql('select *, 2*rating as newCol from ratings_table')
newDF.show()
I hope I've covered the column creation process well to help you solve the Spark problem.
Source network, for learning purposes only, invasion and deletion.
Don't panic. I have a set of learning materials, including 40 + E-books, 800 + teaching videos, involving Python foundation, reptile, framework, data analysis, machine learning, etc. I'm not afraid you won't learn! https://shimo.im/docs/JWCghr8prjCVCxxK/ Python learning materials
Pay attention to the official account [Python circle].