A picture is worth a thousand words. This is especially true when testing performance. For the results of fio tests we often use, how can we quickly generate charts?
Ensure that the FIO command can record performance data
Refer to the following command:
fio -filename=/dev/nvme2n1 -thread -numjobs=1 -iodepth=64 --bs=4K -direct=1 --rw=write -ioengine=libaio --group_reporting -name=perf --output-format=normal --log_avg_msec=10000 --write_bw_log=1M-write.results --write_iops_log=1M-write.results --write_lat_log=1M-write.results --runtime=21 --time_based
After the above command is executed, the following performance data files will be generated:
[root@szw] nvme_ssd_performance_test]# ls -alrt
total 40
drwxr-xr-x 6 root root 4096 Jan 21 07:57 ..
-rw-r--r-- 1 root root  305 Jan 21 08:20 draw_result.py
-rw------- 1 root root 2999 Jan 21 14:20 nohup.out
-rw-r--r-- 1 root root  650 Jan 21 15:39 run-fio.sh
drwxr-xr-x 2 root root 4096 Jan 21 15:39 .
-rw-r--r-- 1 root root  171 Jan 21 15:40 1M-write.results_slat.1.log
-rw-r--r-- 1 root root  203 Jan 21 15:40 1M-write.results_lat.1.log
-rw-r--r-- 1 root root  203 Jan 21 15:40 1M-write.results_clat.1.log
-rw-r--r-- 1 root root  171 Jan 21 15:40 1M-write.results_iops.1.log
-rw-r--r-- 1 root root  171 Jan 21 15:40 1M-write.results_bw.1.log
Preparing the drawing environment
In mac environment
sudo python -mpip install matplotlib
After installation, you can use the python -m pip list command to see if the matplotlib module is installed.
In Linux Environment
Debian / Ubuntu:
sudo apt-get install python-matplotlib
Fedora / Redhat:
sudo yum install python-matplotlib
Export performance data and make charts
Refer to the following command to draw:
chao@B00000B:~$cat draw.py
#!/usr/bin/python
# coding: utf-8
import matplotlib.pyplot as plt
import numpy as np
import matplotlib as mpl
mpl.rcParams['font.family'] = 'sans-serif'
mpl.rcParams['font.sans-serif'] = 'NSimSun,Times New Roman'
a = np.loadtxt('./bw.txt', delimiter=',')
print(a)
x,y,z,v = np.loadtxt('./bw.txt', delimiter=',', unpack=True)
#x, y, z = np.loadtxt('./bw.txt', delimiter=',')
plt.plot(x, y, '*', label='Data', color='black')
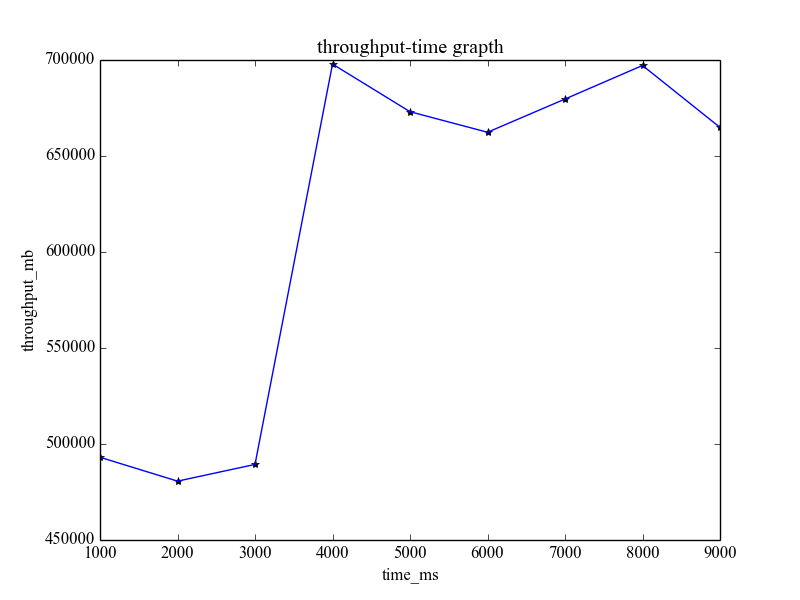
plt.xlabel('time_ms')
plt.ylabel('throughput_mb')
plt.title('throughput-time grapth')
plt.plot(x,y)
#plt.show()
#plt.legend()
plt.show()The actual effect is as follows: