Construction of Filebeat-> Logstash-> Kafka Data Acquisition Platform
brief introduction
Because our company needs to collect data from various businesses, we need to build a data acquisition platform. The original plan was to use the double-layer flume+kafka model, which is common in big data, but our company's back-end said that we did not want to use the flume method to collect, because flume needs to run on JVM, and it may take several hundred M in total, making docker image more troublesome (some of our business is only tens of M in PS). So we need a lightweight collector. Ultimately we decided to use Filbeat.
demand
1. First of all, we have hundreds of applications distributed on different machines. We need a log collection tool, and we need to achieve Docker image, so we need a relatively small log collection tool.
2. Because we have many applications, if all log collections are connected directly to kafka, the pressure on Kafka is too great, so we hope that the number of threads connected to Kafka is as small as possible.
3. Because the company is poorer and the machine configuration is not high, the disk size is expected to save usage (that is, data that is not needed is not transmitted into kafka).
programme
First of all, when choosing log collection tools, we finally decided to use Filebeat, a lightweight log collection tool. But our applications have a lot of pressure to connect directly to kafka, so we have a layer of logstash in the middle to reduce the number of threads connecting to kafka. In the logstash layer, we configure two logstash. For disaster recovery. In the case of one of them hanging, the log collection will not be affected in a short time.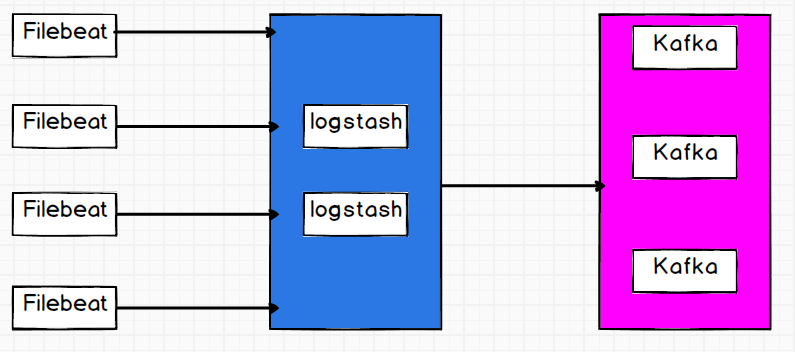
Filebeat
Filebeat, written in go language, is a lightweight log collection tool. Because it is a binary executable file, it can run without JVM and occupy tens of M of memory. It can be said that it meets our needs very well. Filebeat comes from Elastic, which is very simple and easy to use. It can accomplish most of the work only through configuration. There are common requirements, and because Elastic and ELK are well integrated (they are fairly well adapted to their own applications, but may not be so convenient for others).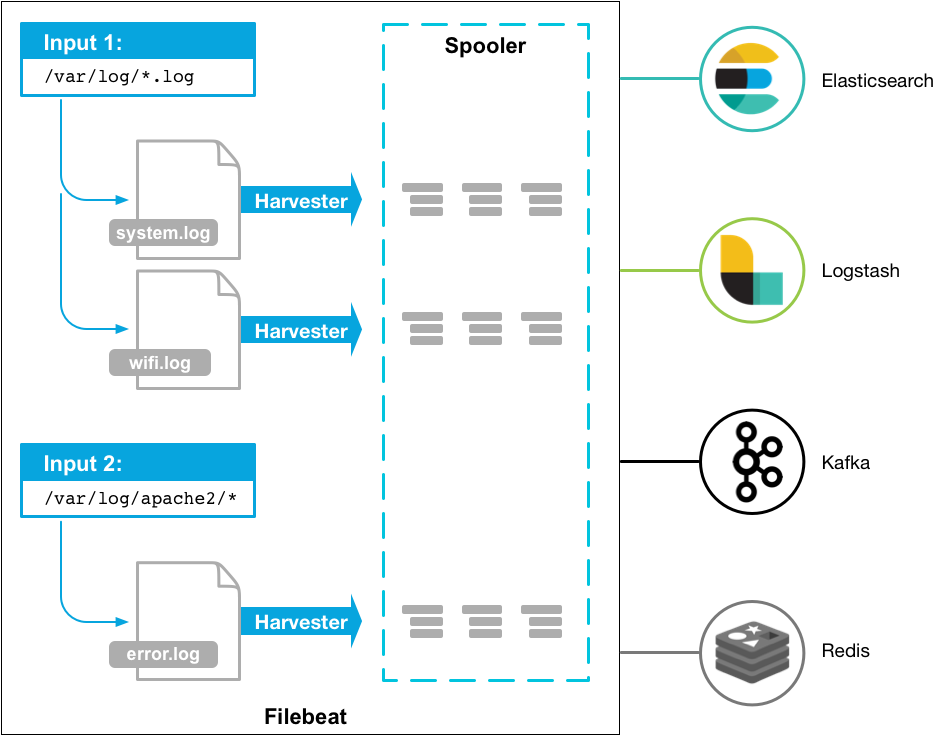
Although FIlebeat is relatively simple and easy to use, there are still many pits in the actual operation. For example, Filebeat adds many fields to our data by default. Chang:
{"host":{"name":"hdfs1.nspt.cs"},"tags":["beats_input_codec_plain_applied"],"topic":"test_logstash","message":"456","input":{"type":"log"},"@timestamp":"2019-09-16T03:18:09.786Z","log":{"file":{"path":"/home/hadoop/ding/log.txt"},"offset":1560},"@version":"1","agent":{"version":"7.3.1","id":"844f5a8b-d896-4b62-9b1f-031bd5728c9d","hostname":"hdfs1.nspt.cs","ephemeral_id":"26afd21e-d680-4779-921b-ac26542e1cbd","type":"filebeat"},"ecs":{"version":"1.0.1"}}
In fact, only the message field (456) is the data we collected, and the rest is added to me by Filebeat. The most important thing is that I haven't found how to configure the output field for half a day on the official website. I see a post from an official forum. It seems that this is not configurable. You can add it to it, but it can't be reduced. This is not in line with our demand 3. Of course, we have other ways.
It's easy to use Filebeat, just a configuration file. Here I write the configuration file directly to me:
#=========================== Filebeat inputs =============================
#Configuration input
filebeat.inputs:
- type: log
  paths:#Here you can configure multiple directories, support * numbers, monitor multiple files of directories
    - /home/hadoop/ding/log.txt
  codec: 'plain'#Decoding mode
  fields:#Add field topic
    topic: test_logstash
  fields_under_root: true#If there is no such sentence, fields: {topic: test_logstash} will be added, and this sentence is topic: test_logstash.
#================================ Outputs =====================================
#----------------------------- Logstash output --------------------------------
output.logstash:
   #The Logstash hosts
  hosts: ["192.168.5.243:5044","192.168.5.244:5044"]
  loadbalance: true
  codec: json#Coding mode
#================================ Processors =====================================
#Processors, similar to logstash castrated filters
processors:
  - drop_fields:#Here we delete some unnecessary fields, some fields can not be deleted, such as timestamp and version number, can only be processed in logstash, try to deal with here, reduce io
      fields: ["ecs","agent","input","log.offset"]
So our filebeat is ready, and then we configure logstash.
Logstash
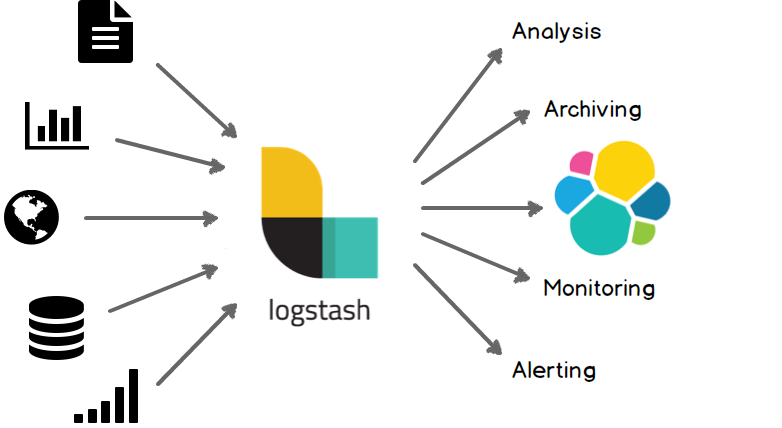
Logstash is very familiar to the students who use ELK. There are not many introductions here. Go directly to the configuration file.
input {#input
  beats {
    port => 5044
  }
}
filter {#Filter, filter out fields that filebeat cannot filter.
    mutate {
        remove_field => ["@timestamp", "@version","tags"]
    }
}
output {#Output to kafka
    kafka {
        bootstrap_servers => "192.168.5.242:9092,192.168.5.243:9092,192.168.5.244:9092"
        acks => "all"
        topic_id => "test_logstash"
        codec => json#json must be filled in here, whether to output to kafka format in logstash. It's not in line. Output message, timestamp, host.
  }
}
So Logstash is configured. Go to kafka to see if the data entered kafka normally.
{"host":{"name":"hdfs1.nspt.cs"},"topic":"test_logstash","log":{"file":{"path":"/home/hadoop/ding/log.txt"}},"message":"456"}
{"host":{"name":"hdfs1.nspt.cs"},"topic":"test_logstash","log":{"file":{"path":"/home/hadoop/ding/log.txt"}},"message":"456"}
{"host":{"name":"hdfs1.nspt.cs"},"topic":"test_logstash","log":{"file":{"path":"/home/hadoop/ding/log.txt"}},"message":"456"}
{"host":{"name":"hdfs1.nspt.cs"},"topic":"test_logstash","log":{"file":{"path":"/home/hadoop/ding/log.txt"}},"message":"456"}
The format is correct. I didn't filter all the fields filebeat added here, leaving the host and log paths as the data provided by the alarm later, so that we can quickly find out which application has problems.
Unfinished Work
Here we write all the data into a topic of kafka, but our logs may come from different sources and formats, so it's not good to put them into a topic. And we added a field topic to the filebeat configuration. I want logstash to parse the topic field like flume, and then dynamically write it into the topic of kafka. I don't seem to have inquired about the configuration on the official website, but the high version of logstash on the official website can write custom input and output and filters in java language. We can do this through custom output. Looking forward to the updates in the future.