Explore YOLO v3 source code - Part 5 Loss
GitHub source code of this article: https://github.com/SpikeKing
Updated:
Part 1 training:
https://mp.weixin.qq.com/s/T9LshbXoervdJDBuP564dQ
Part 2 model:
https://mp.weixin.qq.com/s/N79S9Qf1OgKsQ0VU5QvuHg
Part 3 network:
https://mp.weixin.qq.com/s/hC4P7iRGv5JSvvPe-ri_8g
Chapter 4 truth value:
https://mp.weixin.qq.com/s/5Sj7QadfVvx-5W9Cr4d3Yw
1. Loss layer
In the process of model training, the parameters in the network are continuously adjusted to minimize the value of loss function and complete the model training. In YOLO v3, the loss function yolo_loss encapsulates the loss layer of user-defined Lambda and participates in training as the last layer of the model. The input of Lambda in the loss layer is the output model of the existing model_body.output and truth y_true, the output is 1 value, that is, the loss value.
The core logic of the loss layer is located in yolo_loss, yolo_loss receives the input model of Lambda layer_ Body.output and y_true, also receives anchor box anchors and category num_classes and filter threshold ignore_thresh and other three parameters.
realization:
model_loss = Lambda(yolo_loss,
                    output_shape=(1,), name='yolo_loss',
                    arguments={'anchors': anchors,
                               'num_classes': num_classes,
                               'ignore_thresh': 0.5}
                    )(model_body.output + y_true)
Where, model_body.output is the predicted value of the existing model, y_true is the true value. The format of the two is the same, as follows:
model_body: [(?, 13, 13, 18), (?, 26, 26, 18), (?, 52, 52, 18)]
y_true: [(?, 13, 13, 18), (?, 26, 26, 18), (?, 52, 52, 18)]
Then, in Yolo_ In the loss method, the parameters are:
- args is the input of Lambda layer, i.e. model_body.output and Y_ Combination of true;
- anchors are two-dimensional arrays, and the structure is (9,2), that is, 9 anchor box es;
- num_classes is the number of categories;
- ignore_thresh is the filtering threshold;
- print_loss is the switch of the print loss function;
Namely:
def yolo_loss(args, anchors, num_classes, ignore_thresh=.5, print_loss=True):
2. Parameters
In the loss method Yolo_ In loss, set several parameters:
- num_layers: the number of layers, which is 1 / 3 of the number of anchors;
- yolo_outputs and y_true: detach args. The first three are yolo_outputs predicted value, the last three are y_true true value;
- anchor_mask: the index array of anchor box. Three are sorted in reverse order. 678 corresponds to 13x13345, 26x26123 corresponds to 52x52; That is [[6, 7, 8], [3, 4, 5], [0, 1, 2]];
- input_shape: K.shape(yolo_outputs[0])[1:3], the first prediction matrix YOLO_ The 1st to 2nd bits of the structure (shape) of outputs [0], that is, (13, 13) in (?, 13, 13, 18). Then x32 is the input size of the YOLO network, i.e. (416, 416), because the network contains five convolution operations with step size of (2, 2), and the dimension reduction is 32 = 5 ^ 2 times;
- grid_shapes: and input_ Similar to shape, K.shape()[1:3], select three dimensions of the forecast graph in the form of a list, namely [(13, 13), (26, 26), (52, 52)];
- m: The first bit of the structure of the first prediction graph, i.e. K.shape()[0], input the total number of pictures of the model, i.e. the number of batches;
- mf: the float type of M, i.e. K.cast(m, K.dtype())
- Loss: loss value is 0;
Namely:
num_layers = len(anchors) // 3  # default setting
yolo_outputs = args[:num_layers]
y_true = args[num_layers:]
anchor_mask = [[6, 7, 8], [3, 4, 5], [0, 1, 2]] if num_layers == 3 else [[3, 4, 5], [1, 2, 3]]
# input_shape is the output size * 32, which is the original input size, [1:3] is the position of the size, i.e. 416x416
input_shape = K.cast(K.shape(yolo_outputs[0])[1:3] * 32, K.dtype(y_true[0]))
# The size of each grid is listed
grid_shapes = [K.cast(K.shape(yolo_outputs[l])[1:3], K.dtype(y_true[0])) for l in range(num_layers)]

m = K.shape(yolo_outputs[0])[0]  # batch size, tensor
mf = K.cast(m, K.dtype(yolo_outputs[0]))

loss = 0
3. Forecast data
In Yolo_ In head, the prediction diagram yolo_outputs[l], split into the starting point xy, width and height wh, confidence and category probability class of the bounding box_ probs. Input parameters:
- yolo_outputs[l] or feats: the L-th prediction chart, such as (?, 13, 13, 18);
- anchors[anchor_mask[l]] or anchors: the first anchor box, such as [(116, 90), (156198), (373326)];
- num_classes: number of categories, such as 1;
- input_shape: enter the size of the picture, Tensor, and the value is (416, 416);
- calc_loss: switch to calculate loss. Calc is used to calculate loss value_ Open loss, True;
Namely:
grid, raw_pred, pred_xy, pred_wh = \        yolo_head(yolo_outputs[l], anchors[anchor_mask[l]], num_classes, input_shape, calc_loss=True)
    def yolo_head(feats, anchors, num_classes, input_shape, calc_loss=False):
Then, count the number of anchors num_anchors, i.e. 3. Convert anchors into Tensor, i.e. anchors, which is the same as the feats dimension of the prediction chart_ The structure of the Tensor is (1, 1, 1, 3, 2), that is:
num_anchors = len(anchors)
# Reshape to batch, height, width, num_anchors, box_params.
anchors_tensor = K.reshape(K.constant(anchors), [1, 1, 1, num_anchors, 2])
Next, create a grid:
- Gets the size of the grid_shape, i.e. the 1st ~ 2nd bits of the prediction graph feats, such as 13x13;
- grid_y and grid_x is used to generate the grid, and the combined grid of 012 of Y axis is created through the combination of range, reshape and tile_ y. Then create a combined grid of 012 on the x-axis_ x. concatenate the two, which is grid;
- grid is the value that traverses the binary value combination, and the structure is (13, 13, 1, 2);
Namely:
grid_shape = K.shape(feats)[1:3]grid_shape = K.shape(feats)[1:3]  # height, widthgrid_y = K.tile(K.reshape(K.arange(0, stop=grid_shape[0]), [-1, 1, 1, 1]),
                [1, grid_shape[1], 1, 1])grid_x = K.tile(K.reshape(K.arange(0, stop=grid_shape[1]), [1, -1, 1, 1]),
                [grid_shape[0], 1, 1, 1])grid = K.concatenate([grid_x, grid_y])grid = K.cast(grid, K.dtype(feats))
Next, expand the last dimension of feats to separate anchors from other data (number of categories + 4 box values + box confidence)
feats = K.reshape(
    feats, [-1, grid_shape[0], grid_shape[1], num_anchors, num_classes + 5])
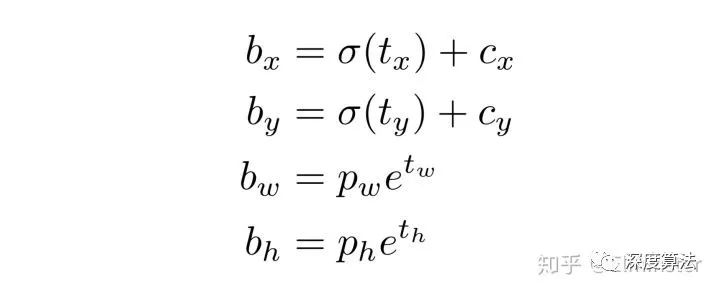
Next, calculate the starting point xy, width height wh and frame confidence box_confidence and category confidence box_class_probs:
- Starting point xy: normalize the value of xy in feats by sigmoid, add the binary of the corresponding grid, and then divide by the grid side length to normalize;
- Width height wh: the value of wh in feats is converted into positive value by exp, and then multiplied by anchors_ anchor box of tensor, divided by the width and height of the picture, normalized;
- Box confidence_ Confidence: normalize the confidence value in feats through sigmoid;
- Category confidence box_class_probs: class in feats_ Probs value, normalized by sigmoid;
Namely:
box_xy = (K.sigmoid(feats[..., :2]) + grid) / K.cast(grid_shape[::-1], K.dtype(feats))
box_wh = K.exp(feats[..., 2:4]) * anchors_tensor / K.cast(input_shape[::-1], K.dtype(feats))
box_confidence = K.sigmoid(feats[..., 4:5])
box_class_probs = K.sigmoid(feats[..., 5:])
In the calculation formula of xywh, tx, ty, tw and th are feats values, while bx, by, bw and bh are output values, as follows:
 Four values of the box
These four values are box_ xy, box_ wh, confidence, class_ The range of probs is 0 ~ 1.
Since the loss value is calculated, calc_ If loss is True, return:
- grid: the structure is (13, 13, 1, 2) and the value is 0 ~ 12;
- Predicted values feats: after reshape transformation, 18 dimensional data are separated into 3-dimensional anchors, and the structure is (?, 13, 13, 3, 6)
- box_xy and box_ The structure of the normalized starting point xy and width height wh, XY is (?, 13, 13, 3, 2), and the structure of wh is (?, 13, 13, 3, 2); box_ The range of XY is (01), box_ The range of wh is (01); That is, after bx, by, bw and bh are calculated, normalization is carried out.
Namely:
if calc_loss == True:
    return grid, feats, box_xy, box_wh
4. Loss function
When calculating the loss value, the loss value of each layer is calculated circularly and accumulated together, i.e
for l in range(num_layers):
        // ...
        loss += xy_loss + wh_loss + confidence_loss + class_loss
In each loop body:
- Get object confidence_ Mask, the 4th bit of the last dimension, the 0 ~ 3 bits are the box, and the 4th bit is the object confidence;
- Category confidence true_class_probs, the fifth digit of the last dimension;
Namely:
object_mask = y_true[l][..., 4:5]
true_class_probs = y_true[l][..., 5:]
Next, call yolo_head reconstruction prediction diagram, output:
- grid: the structure is (13, 13, 1, 2) and the value is 0 ~ 12;
- Predicted value raw_pred: after reshape transformation, anchors are separated. The structure is (?, 13, 13, 3, 6)
- pred_xy and pred_ The structure of the normalized starting point xy and width height wh, XY is (?, 13, 13, 3, 2), and the structure of wh is (?, 13, 13, 3, 2);
Then xy and wh are combined into prediction frame pred_box, the structure is (?, 13, 13, 3, 4).
grid, raw_pred, pred_xy, pred_wh = \       yolo_head(yolo_outputs[l], anchors[anchor_mask[l]],
              num_classes, input_shape, calc_loss=True)pred_box = K.concatenate([pred_xy, pred_wh])
Next, the truth value data is generated:
- raw_true_xy: the center point xy in the grid, the offset data, and the value range is 01; y_ Bits 0 and 1 of true are the relative positions of the center point xy, and the range is 01;
- raw_true_wh: the proportion of wh in the network to anchors, and then converted to log form. The range is positive and negative; y_ The 2nd and 3rd bits of true are the relative positions of width and height wh, and the range is 0 ~ 1;
- box_loss_scale: calculate wh weight, value range (1 ~ 2);
realization:
# Darknet raw box to calculate loss.
raw_true_xy = y_true[l][..., :2] * grid_shapes[l][::-1] - grid
raw_true_wh = K.log(y_true[l][..., 2:4] / anchors[anchor_mask[l]] * input_shape[::-1])  # 1
raw_true_wh = K.switch(object_mask, raw_true_wh, K.zeros_like(raw_true_wh))  # avoid log(0)=-inf
box_loss_scale = 2 - y_true[l][..., 2:3] * y_true[l][..., 3:4]  # 2-w*h
Next, ignore is generated according to the IoU ignore threshold_ Mask, the prediction box pred_box and truth box true_box calculates IoU and suppresses the value of unwanted anchor box, that is, the anchor box whose IoU is less than the maximum threshold. ignore_ The shape of the mask is (?,?,?, 3, 1), bit 0 is the number of batches, and bits 1 ~ 2 are the size of the feature map.
realization:
ignore_mask = tf.TensorArray(K.dtype(y_true[0]), size=1, dynamic_size=True)object_mask_bool = K.cast(object_mask, 'bool')def loop_body(b, ignore_mask):
    true_box = tf.boolean_mask(y_true[l][b, ..., 0:4], object_mask_bool[b, ..., 0])
    iou = box_iou(pred_box[b], true_box)
    best_iou = K.max(iou, axis=-1)
    ignore_mask = ignore_mask.write(b, K.cast(best_iou < ignore_thresh, K.dtype(true_box)))
    return b + 1, ignore_mask_, ignore_mask = K.control_flow_ops.while_loop(lambda b, *args: b < m, loop_body, [0, ignore_mask])ignore_mask = ignore_mask.stack()ignore_mask = K.expand_dims(ignore_mask, -1)
Loss function:
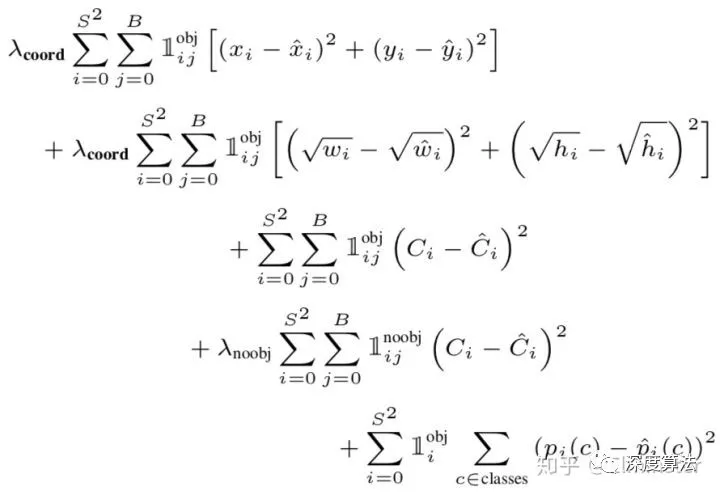
- xy_loss: the loss value of the center point. object_mask is y_ The fourth bit of true, that is, whether it contains objects, including 1 and excluding 0. box_ loss_ The value of scale is related to the size of the object frame. 2 minus the relative area, the value range is (1 ~ 2). binary_crossentropy is binary cross entropy.
- wh_loss: loss value of width and height. In addition, multiply by a factor of 0.5, square K.square().
- confidence_loss: the loss value of the box. It consists of two parts. The first part is the loss value of the existing object, and the second part is the loss value of the non existing object, which is multiplied by the ignore mask_ Mask, ignore the box in the prediction box where IoU is greater than the threshold.
- class_loss: category loss value.
- Divide the sum of the loss values of each part by the mean value and accumulate it as the final picture loss value.
Detailed implementation:
object_mask = y_true[l][..., 4:5]  # Object mask
box_loss_scale = 2 - y_true[l][..., 2:3] * y_true[l][..., 3:4]  # Frame loss ratio
z * -log(sigmoid(x)) + (1 - z) * -log(1 - sigmoid(x))  # Binary cross entropy function
iou = box_iou(pred_box[b], true_box)  # IoU of prediction box and real box
Loss function implementation:
xy_loss = object_mask * box_loss_scale * K.binary_crossentropy(raw_true_xy, raw_pred[..., 0:2],
                                                               from_logits=True)wh_loss = object_mask * box_loss_scale * 0.5 * K.square(raw_true_wh - raw_pred[..., 2:4])confidence_loss = object_mask * K.binary_crossentropy(object_mask, raw_pred[..., 4:5], from_logits=True) + \                                   (1 - object_mask) * K.binary_crossentropy(object_mask, raw_pred[..., 4:5],
                                                            from_logits=True) * ignore_maskclass_loss = object_mask * K.binary_crossentropy(true_class_probs, raw_pred[..., 5:], from_logits=True)xy_loss = K.sum(xy_loss) / mfwh_loss = K.sum(wh_loss) / mfconfidence_loss = K.sum(confidence_loss) / mfclass_loss = K.sum(class_loss) / mfloss += xy_loss + wh_loss + confidence_loss + class_loss
The loss function formula of YOLO v1 is slightly different from v3 as a reference:
supplement
1. "..." operator
In Python, the "..." (ellipsis) operator indicates that other dimensions remain unchanged and only the first or last dimension is operated;
import numpy as np

x = np.array([[1, 2, 3, 4], [5, 6, 7, 8], [9, 10, 11, 12]])
"""[[ 1  2  3  4] [ 5  6  7  8] [ 9 10 11 12]]"""
print(x.shape)  # (3, 4)
y = x[1:2, ...]
"""[[5 6 7 8]]"""
print(y)
2. Traversal value combination
In YOLO v3, when calculating the grid value, it needs to be converted from the relative position to the absolute position, that is, the relative value, plus the value in the upper left corner of the grid. For example, the absolute value of the relative value (0.2, 0.3) in the (1, 1) grid is (1.2, 1.3). When converting coordinate values, add corresponding initial values according to the position of coordinate points. In this way, it is necessary to traverse the numerical combination of two, such as generating a grid matrix of 0 to 12.
It can be completed quickly through the combination of orange - > reshape - > tile - > concatenate.
Source code:
from keras import backend as K

grid_y = K.tile(K.reshape(K.arange(0, stop=3), [-1, 1, 1]), [1, 3, 1])
grid_x = K.tile(K.reshape(K.arange(0, stop=3), [1, -1, 1]), [3, 1, 1])
sess = K.get_session()

print(grid_x.shape)  # (3, 3, 1)
print(grid_y.shape)  # (3, 3, 1)

z = K.concatenate([grid_x, grid_y])

print(z.shape)  # (3, 3, 2)
print(sess.run(z))
"""Create 3 x3 Two dimensional matrix, traversing all arrays 0~2"""
3. ::-1
":: - 1" is the value of the inverted array, for example:
import numpy as np

a = np.array([1, 2, 3, 4, 5])
print a[::-1]
"""[5 4 3 2 1]"""
4. Session
In Keras, the Session test is used to verify the data to achieve:
from keras import backend as K

sess = K.get_session()
a = K.constant([2, 4])
b = K.constant([3, 2])
c = K.square(a - b)

print(sess.run(c))
reference
@online{SpikeKing2021Nov,
author = {SpikeKing},
title = {{explore YOLO v3 source code - Part 5 Loss}},
organization = {wechat public platform},
year = {2021},
month = {11},
date = {2021-11-22},
urldate = {2021-11-22},
note = {[Online; accessed 22. Nov. 2021]},
url = {https://mp.weixin.qq.com/s/4L9E4WGSh0hzlD303036bQ},
abstract = {{this paper mainly shares the details of how to implement the algorithm of YOLO v3, Keras framework. This is the fifth part, Loss function Loss, exquisite design, Loss values of four parts: center point, width and height, frame confidence and category confidence. This is the last part of the training process. It is high and few.}}
}