brief introduction
log server
Improving security
 Centralized storage of logs
 Defect: Difficulty in log analysis
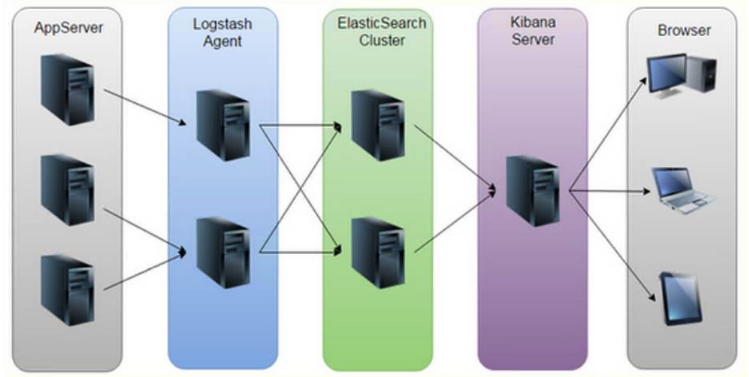
ELK Log Analysis System
Elasticsearch: Storage, Index Pool
Logstash: Log Collector
 Kibana: Data visualization
Log Processing Steps
1, centralize log management
 2, Logstash and output to Elasticsearch
 3. Index and store the formatted data (Elasticsearch)
4. Display of front-end data (Kibana)
Overview of Elasticsearch
Provides a full-text search engine with distributed multiuser capabilities
The concept of Elasticsearch
 Near Real Time
 colony
 node
 Index: Index (Library) -->Type (Table) -->Document (Record)
 Slices and copies
Introduction to Logstash
 A powerful data processing tool for data transmission, formatting, and formatting output
 Data input, data processing (such as filtering, rewriting, etc.) and data output
LogStash Main Components
 Shipper
 Indexer
 Broker
 Search and Storage
 Web Interface
Introduction to Kibana
 An open source analysis and visualization platform for Elasticsearch
 Search for and view data stored in the Elasticsearch index
 Advanced data analysis and presentation through various charts
Key Kibana features
 Seamless integration of Elasticsearch
 Integrate data, complex data analysis
 Benefit more team members
 Flexible interface for easy sharing
 Simple configuration, visualization of multiple data sources
 Simple Data Export
Experimental Topology
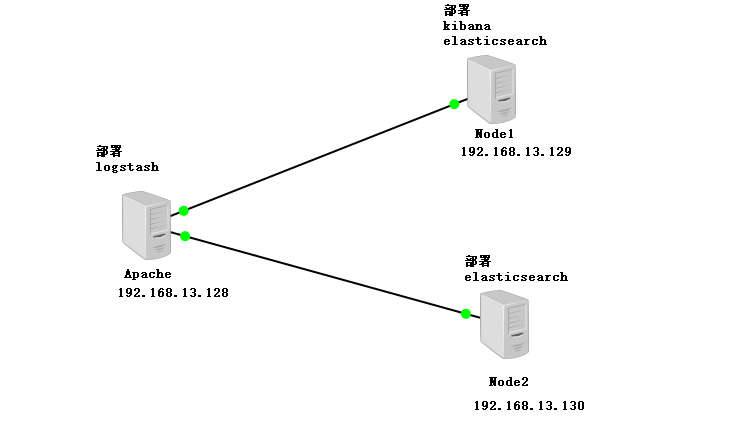
Experimental environment
Apache Server 192.168.13.128 (Logstash)
Node1 Server 192.168.13.129 (Elasticsearch, Kibana)
Node2 Server 192.168.13.130 (Elasticsearch)
1, install elasticsearch on node1, node2
[root@node1 ~]# vim /etc/hosts  ##Configuration Resolution Name
192.168.13.129 node1
192.168.13.130 node2
[root@node1 ~]# java -version  ##See if Java is supported
[root@node1 ~]# mount.cifs //192.168.100.3/LNMP-C7 /mnt/
Password for root@//192.168.100.3/LNMP-C7:
[root@node1 mnt]# cd /mnt/elk/
[root@node1 elk]# rpm -ivh elasticsearch-5.5.0.rpm   ##install
[root@node1 elk]# systemctl daemon-reload  ##Overload Daemon
[root@node1 elk]# systemctl enable elasticsearch.service   ##Start-Up Self-Starting
[root@node1 elk]# cd /etc/elasticsearch/
[root@node1 elasticsearch]# cp elasticsearch.yml elasticsearch.yml.bak  ##backups
[root@node1 elasticsearch]# vim elasticsearch.yml  ##Modify Profile
cluster.name: my-elk-cluster  ##Cluster name
node.name: node1    ##Node name, second node is node2
path.data: /data/elk_data   ##Data storage location
path.logs: /var/log/elasticsearch/  ##Log storage location
bootstrap.memory_lock: false  ##Do not lock memory at startup
network.host: 0.0.0.0   ##Provides service-bound IP addresses for all addresses
http.port: 9200  ##Port number 9200
discovery.zen.ping.unicast.hosts: ["node1", "node2"]  ##Cluster discovery via unicast
[root@node1 elasticsearch]# mkdir -p /data/elk_data   ##Create a data storage point
[root@node1 elasticsearch]# chown elasticsearch.elasticsearch /data/elk_data/  ##Give permission
[root@node1 elasticsearch]# systemctl start elasticsearch.service   ##Open Service
[root@node1 elasticsearch]# netstat -ntap | grep 9200  ##View opening
tcp6     0    0 :::9200        :::*          LISTEN      2166/java
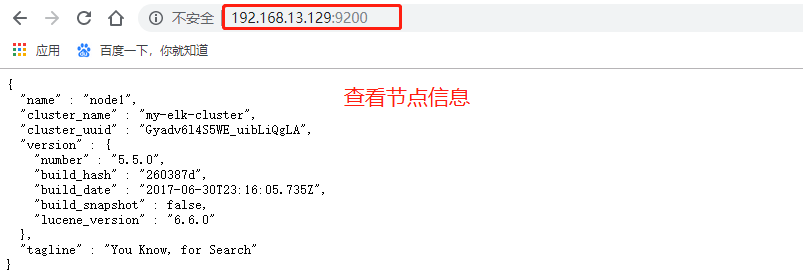
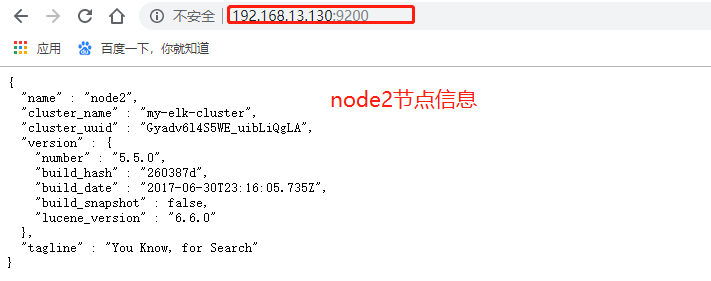
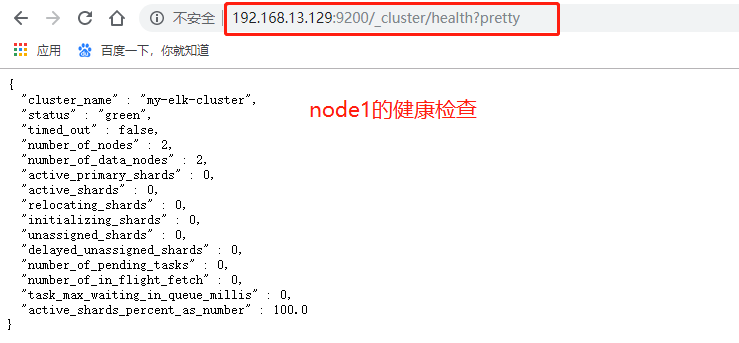
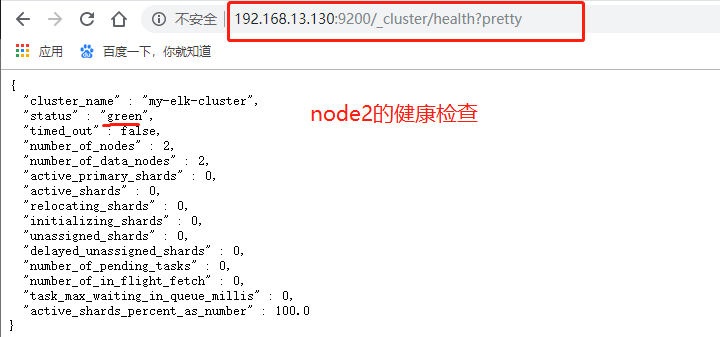
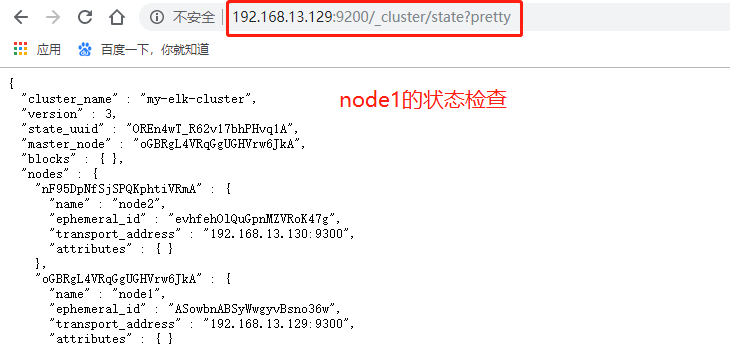
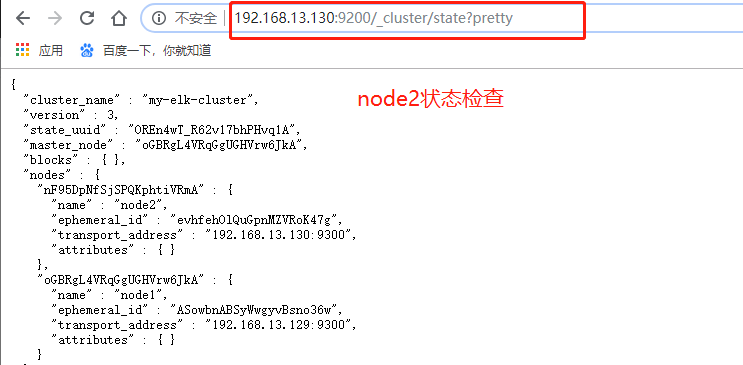
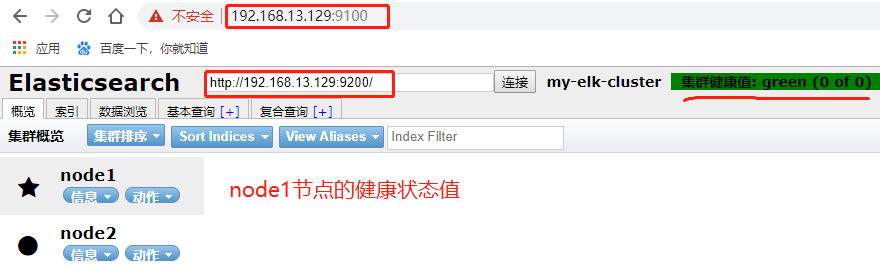
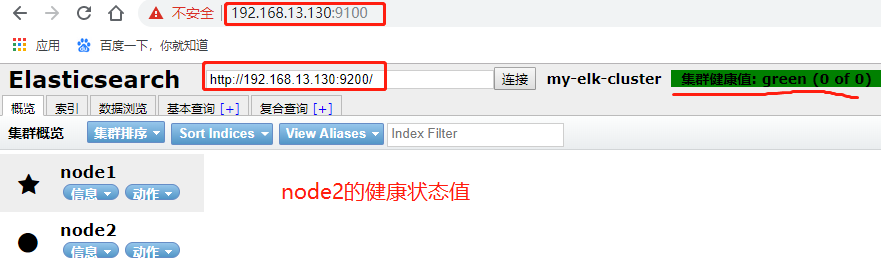
2. Check your health and status on your browser
3, Install node component dependency packages on node1, node2
[root@node1 elasticsearch]# yum install gcc gcc-c++ make -y  ##Install compilation tools
[root@node1 elasticsearch]# cd /mnt/elk/
[root@node1 elk]# tar zxvf node-v8.2.1.tar.gz -C /opt/  ##Unzip Plugin
[root@node1 elk]# cd /opt/node-v8.2.1/
[root@node1 node-v8.2.1]# ./configure   ##To configure
[root@node1 node-v8.2.1]# make && make install   ##Compile Installation
4, install phantomjs front-end framework on node1, node2
[root@node1 elk]# tar jxvf phantomjs-2.1.1-linux-x86_64.tar.bz2 -C /usr/local/src/
##Unzip to/usr/local/src
[root@node1 elk]# cd /usr/local/src/phantomjs-2.1.1-linux-x86_64/bin/
[root@node1 bin]# cp phantomjs /usr/local/bin/   ##Compile System Identification
5. Install elasticsearch-head data visualization on node1, node2
[root@node1 bin]# cd /mnt/elk/
[root@node1 elk]# tar zxvf elasticsearch-head.tar.gz -C /usr/local/src/  ##decompression
[root@node1 elk]# cd /usr/local/src/elasticsearch-head/
[root@node1 elasticsearch-head]# npm install  ##install
6, Modify the configuration file
[root@node1 elasticsearch-head]# vim /etc/elasticsearch/elasticsearch.yml
##Last row join
http.cors.enabled: true  ##Turn on cross-domain access support, default is false
http.cors.allow-origin: "*"    ##Cross-Domain Access Allowed Domain Name Addresses
[root@node1 elasticsearch-head]# systemctl restart elasticsearch.service  ##restart
[root@node1 elasticsearch-head]# cd /usr/local/src/elasticsearch-head/
[root@node1 elasticsearch-head]# npm run start &   ##Running data visualization services in the background
[1] 82515
[root@node1 elasticsearch-head]# netstat -ntap | grep 9100
tcp        0      0 0.0.0.0:9100    0.0.0.0:*      LISTEN      82525/grunt
[root@node1 elasticsearch-head]# netstat -ntap | grep 9200
tcp6       0    0 :::9200              :::*        LISTEN      82981/java
7, View health status on Browser
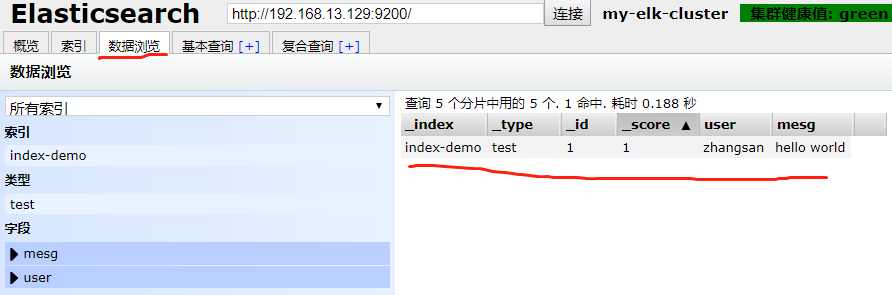
8, create index on node1
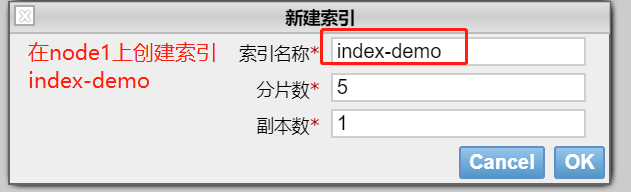
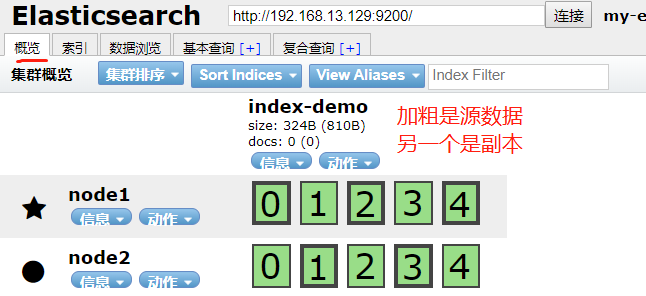
[root@node2 ~]# curl -XPUT 'localhost:9200/index-demo/test/1?pretty&pretty' -H 'content-Type: application/json' -d '{"user":"zhangsan","mesg":"hello world"}'
##Create Index Information
9. Install logstash on the Apache server and dock with multiple elastic searches
[root@apache ~]# yum install httpd -y ##Installation Services
[root@apache ~]# systemctl start httpd.service ##Start Services
[root@apache ~]# java -version
[root@apache ~]# mount.cifs //192.168.100.3/LNMP-C7/mnt/ ##Mount
Password for root@//192.168.100.3/LNMP-C7:
[root@apache ~]# cd /mnt/elk/
[root@apache elk]# rpm -ivh logstash-5.5.1.rpm ##Install logstash
[root@apache elk]# systemctl start logstash.service
[root@apache elk]# systemctl enable logstash.service ##Self-activation
[root@apache elk]# ln -s /usr/share/logstash/bin/logstash /usr/local/bin/ ##Easy system identification
[root@apache elk]# logstash -e 'input { stdin{} } output { stdout{} }' ##Standard Input and Output
The stdin plugin is now waiting for input:
16:58:11.145 [Api Webserver] INFO logstash.agent - Successfully started Logstash API endpoint {:port=>9600}
www.baidu.com ##input
2019-12-19T08:58:35.707Z apache www.baidu.com
www.sina.com.cn ##input
2019-12-19T08:58:42.092Z apache www.sina.com.cn
[root@apache elk]# logstash -e 'input { stdin{} } output { stdout{ codec=>rubydebug } }'
##Use rubydebug to display verbose output, codec is a codec
The stdin plugin is now waiting for input:
17:03:08.226 [Api Webserver] INFO logstash.agent - Successfully started Logstash API endpoint {:port=>9600}
www.baidu.com ##Formatting Processing
{
"@timestamp" => 2019-12-19T09:03:13.267Z,
"@version" => "1",
"host" => "apache",
"message" => "www.baidu.com"
}
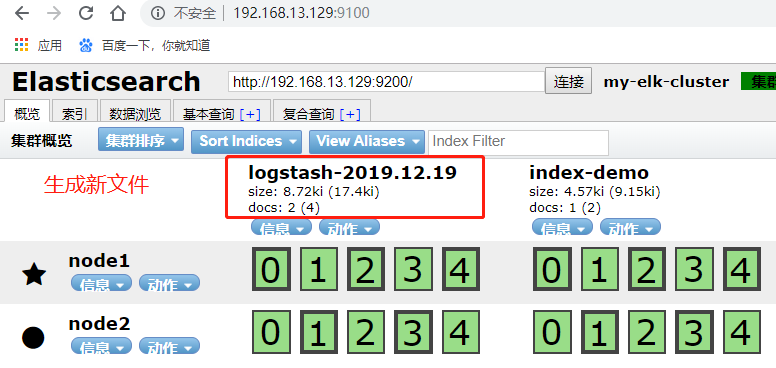
[root@apache elk]# logstash -e 'input { stdin{} } output { elasticsearch { hosts=>["192.168.13.129:9200"] } }'
##Writing information to elastic search using logstach
The stdin plugin is now waiting for input:
17:06:46.846 [Api Webserver] INFO logstash.agent - Successfully started Logstash API endpoint {:port=>9600}
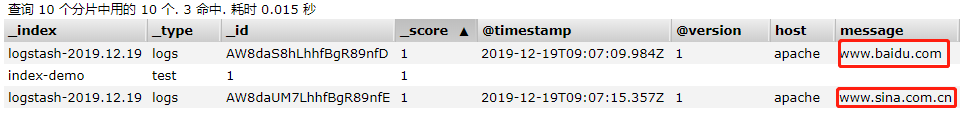
www.baidu.com ##Enter information
www.sina.com.cn
10, View information in browser
##You can view information in data browsing
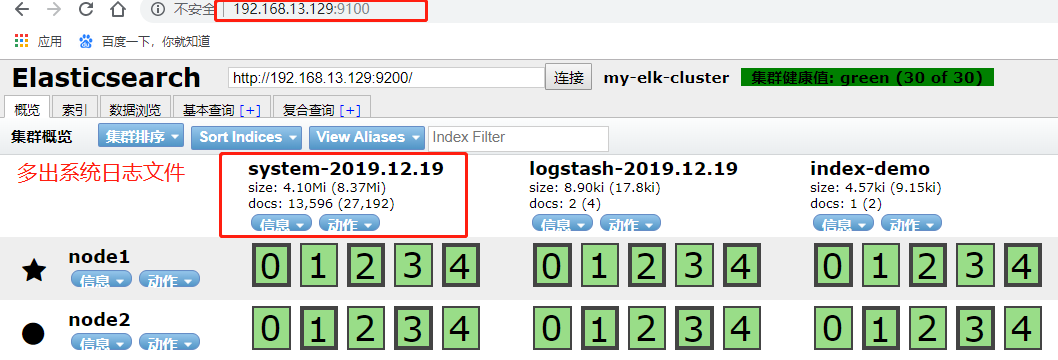
11, output the system log file to elasticsearch
[root@apache elk]# chmod o+r /var/log/messages   ##Read permissions to other users
[root@apache elk]# vim /etc/logstash/conf.d/system.conf  ##create a file
input {
                file{
                path => "/var/log/messages"   ##Output Directory
                type => "system"
                start_position => "beginning"
                }
}
output {
                elasticsearch {
                #Input Address Points to Node 1
                hosts => ["192.168.13.129:9200"]
                index => "system-%{+YYYY.MM.dd}"
                }
}
[root@apache elk]# systemctl restart logstash.service  ##Restart Service
##You can also view details using data browsing
12, Install kibana data visualization on the node1 server
[root@node1 ~]# cd /mnt/elk/
[root@node1 elk]# rpm -ivh kibana-5.5.1-x86_64.rpm   ##install
[root@node1 elk]# cd /etc/kibana/
[root@node1 kibana]# cp kibana.yml kibana.yml.bak  ##backups
[root@node1 kibana]# vim kibana.yml   ##Modify Profile
server.port: 5601  ##Port number
server.host: "0.0.0.0"   ##Listen on any segment
elasticsearch.url: "http://192.168.13.129:9200 "#Local Node Address"
kibana.index: ".kibana"   ##Index Name
[root@node1 kibana]# systemctl start kibana.service   ##Open Service
[root@node1 kibana]# systemctl enable kibana.service
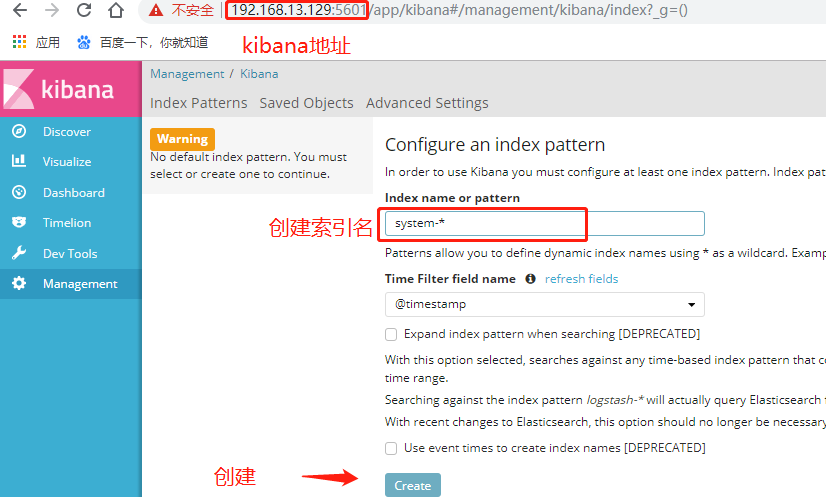
13, browser access to kibana
14, dock apache log files on the apache server for statistics
[root@apache elk]# vim /etc/logstash/conf.d/apache_log.conf ##create profile
input {
file{
path => "/etc/httpd/logs/access_log" ##Enter information
type => "access"
start_position => "beginning"
}
file{
path => "/etc/httpd/logs/error_log"
type => "error"
start_position => "beginning"
}
}
output {
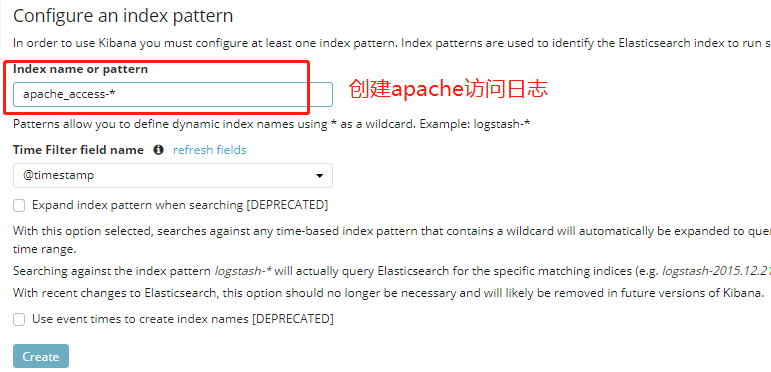
if [type] == "access" { ##Determine output information based on conditions
elasticsearch {
hosts => ["192.168.13.129:9200"]
index => "apache_access-%{+YYYY.MM.dd}"
}
}
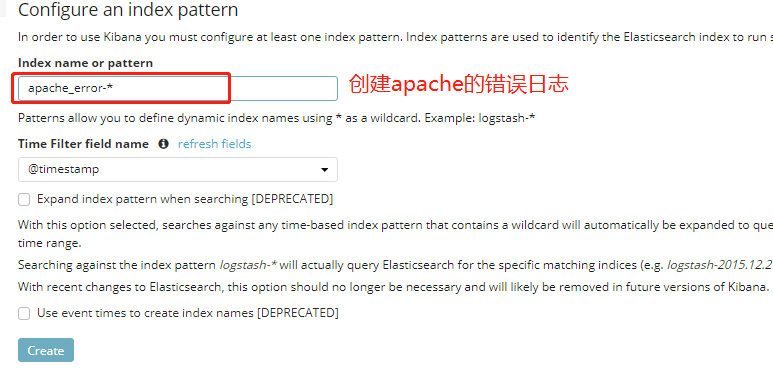
if [type] == "error" {
elasticsearch {
hosts => ["192.168.13.129:9200"]
index => "apache_error-%{+YYYY.MM.dd}"
}
}
}
[root@apache elk]# logstash -f /etc/logstash/conf.d/apache_log.conf
##Configure logstach based on configuration file
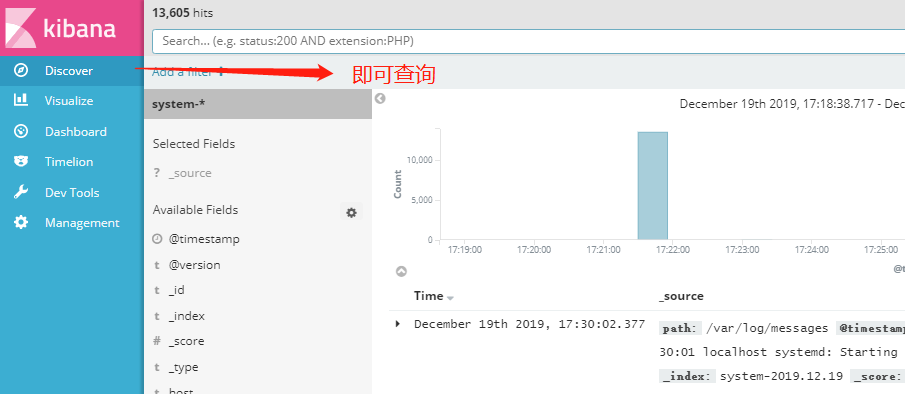
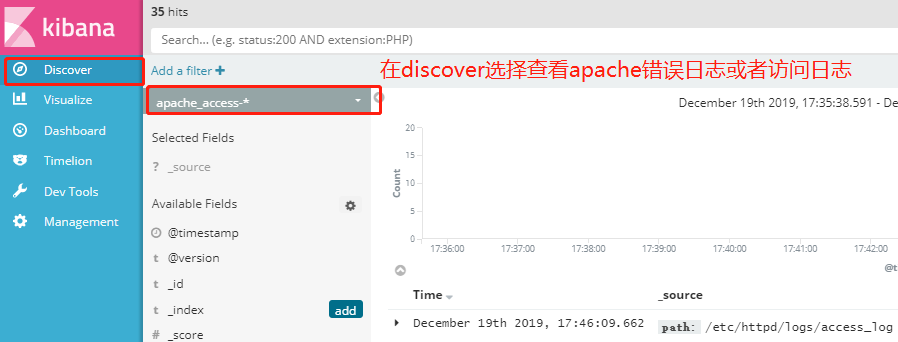
15, Visit web page information, view kibana statistics


##Select management>Index Patterns>create index patterns
 ##Information for creating two apache logs
Thank you for reading!