ELK learning
1, What is it
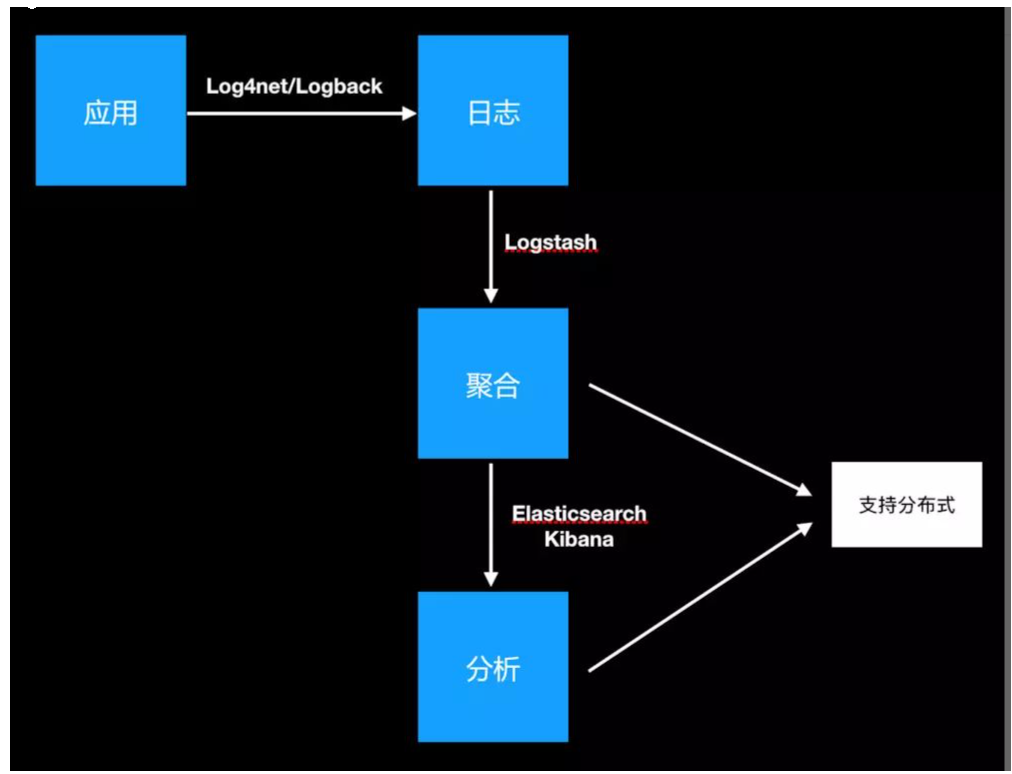
- Elasticsearch is an open source distributed search engine. Its features include: distributed, zero configuration, automatic discovery, automatic index fragmentation, index copy mechanism, restful style interface, multi data sources, automatic search load, etc.
- Logstash is a completely open source tool. It can collect, filter and store your logs for future use (such as search).
- Kibana is also an open source and free tool. It can provide log analysis friendly Web interface for Logstash and ElasticSearch, which can help you summarize, analyze and search important data logs
2, What scene
Usually, when the system fails, the engineer needs to log in to each server and use Linux script tools such as grep / sed / awk to find the cause of the failure in the log. If there is no log system, first locate the server that processes the request. If multiple instances are deployed to this server, you need to go to the log directory of each application instance to find the log file. Each application instance will also set log rolling strategy (such as generating a file every day), log compression and archiving strategy, etc.
Such a series of processes have caused great trouble for us to troubleshoot and find the cause of the fault in time. Therefore, if we can centrally manage these logs and provide centralized retrieval function, we can not only improve the efficiency of diagnosis, but also have a comprehensive understanding of the system situation and avoid the passive fire fighting afterwards.
In general, there are three points
- Data search: locate corresponding bug s and find solutions by retrieving log information.
- Service diagnosis: through statistics and analysis of log information, understand the server load and service operation status
- Data analysis: further data analysis can be done.
3, Advantages over similar software
FileBeat is a lightweight log collection system, which occupies less resources, but cannot forward the format. However, it can borrow filed for format conversion to a format recognized by els
Logstash can directly convert the log format into a format recognized by els
Content introduction
ELK consists of three log analysis architectures, Elasticsearch, Logstash and Kibana
Simple architecture diagram
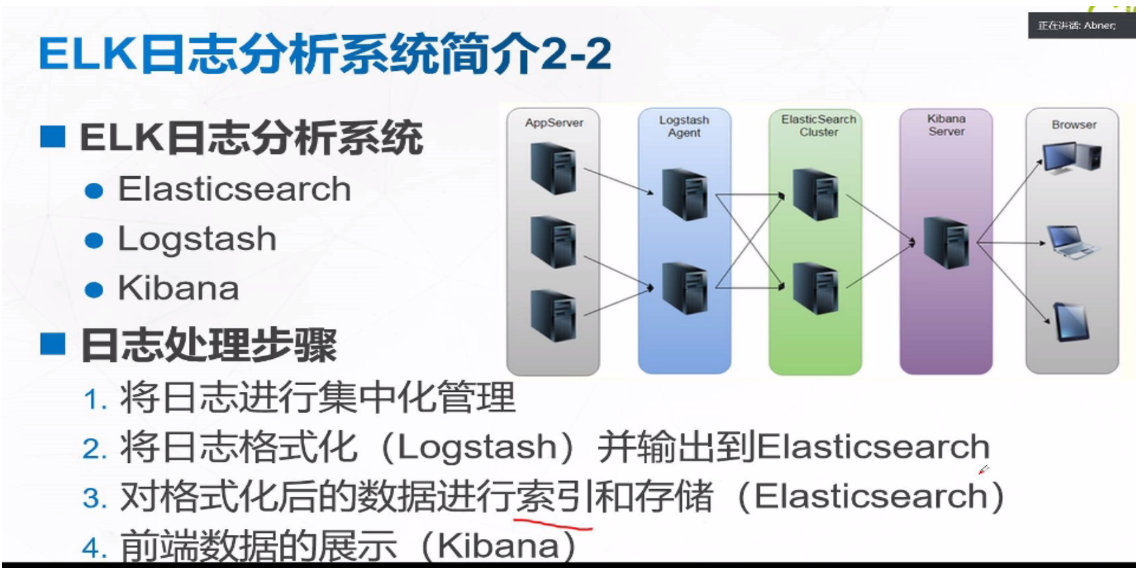
App Server represents the path of the server you need to collect
The Logstash Agent collects these logs
ElasticSearch Cluster is responsible for technical secondary school service and storage
Kibana Server is a friendly Web interface for log analysis
Important - note that if els wants to be transmitted by kibana orderly and quickly, it can borrow a middleware called kafka
Kafka is made by Apache Software Foundation An open source stream processing platform developed by Scala and Java to write. Kafka is a high throughput Distributed Publish and subscribe message system, which can process all the action flow data of consumers in the website. This action (web browsing, search and other user actions) is a key factor in many social functions on the modern network. These data are usually solved by processing logs and log aggregation due to throughput requirements. For image Hadoop same journal Data and off-line analysis system, but it requires the limitation of real-time processing, which is a feasible solution. Kafka's purpose is to pass Hadoop The parallel loading mechanism is also used to unify online and offline message processing colony To provide real-time messages.
PV - it means that every time a user opens a website page, a PV will be generated
The swap partition is on the hard disk. Once the data is exchanged to this partition, it will become very slow. Therefore, either do not make this partition or clean the data in it regularly
Common problems: optimization, one is how to increase your threads and processes when there is high concurrency. The second is how to manage your swap partition, that is, how to optimize the cache
The third is how to ensure your security optimization. 4, In high concurrency, the database often has deadlock. How do you break through the deadlock limit.
1. Introduction to elasticsearch
It is a full-text search engine that provides a distributed multi-user capability
The core concepts are
- near real time
- cluster
- node
- index
++++Index (Library) --- type (table) --- document (record)
Slice and copy
2. Logstash introduction
It is a powerful data processing tool, which can realize data transmission, format processing, format output, data input, data processing (such as filtering, rewriting) and data output
3. Main functions of Kibaba
It is a display form of wab page, which has the following advantages
- seamless integration with elasticsearch
- consolidate data, complex data analysis
- benefit more team members
- flexible interface and easier sharing
- simple configuration and visualization of multiple data sources
- simple data export
Experiment
1. Experimental design
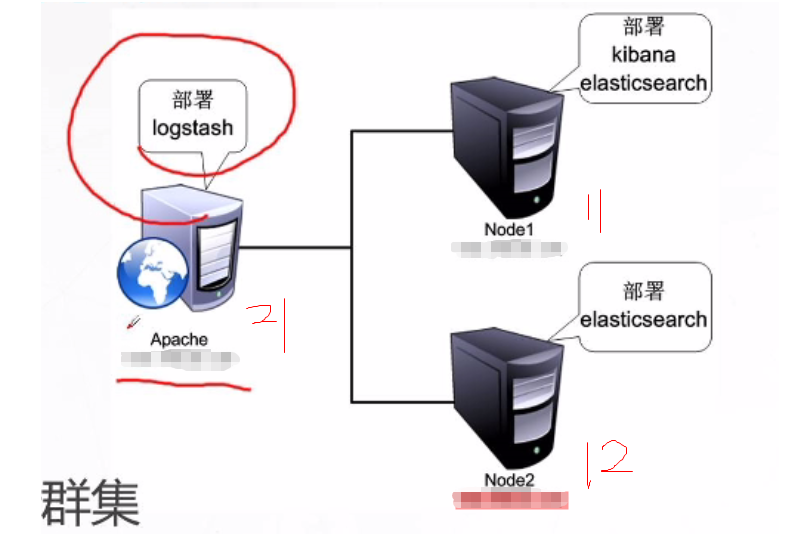
1. Address planning
| node | assembly | centos 7.4 |
|---|---|---|
| 10.4.7.11 | elasticsearch,kibaba | node1 |
| 10.4.7.12 | elasticsearch | node2 |
| 10.4.7.21 | logstash | apache |
2. Experimental topology
3. Requirement description
Configure the ELK log analysis cluster, use Logstash to collect logs, and use Kibaba to view analysis logs
4. Preparing the installation environment
Close the firewall and selinux, node1 and node2 node boards, allocate 4G memory, and apache nodes allocate 1g memory at least
2. Start the experiment
Note: turning off firewall core protection and configuring yum warehouse are no longer in operation
systemctl status firewalld
setenforce 0
hostnamectl set-hostname node
vi /etc/hosts
 add to
10.4.7.11 node1
10.4.7.12 node2
 Check the built-in java environment
[root@node2 ~]# java -version
openjdk version "1.8.0_181"
OpenJDK Runtime Environment (build 1.8.0_181-b13)
OpenJDK 64-Bit Server VM (build 25.181-b13, mixed mode)
1. Put ela's rpm under the root of node1 and 2 and install it
[root@node1 ~]# ll
 Total consumption 32616
-rw-r--r--. 1 root root 33396354 8 November 2017 elasticsearch-5.5.0.rpm
[root@node1 ~]#
2. Install the service, reload it, and set the startup and self startup
[root@node1 ~]# rpm -ivh elasticsearch-5.5.0.rpm
[root@node1 ~]# systemctl daemon-reload
[root@node1 ~]# systemctl enable elasticsearch.service
Created symlink from /etc/systemd/system/multi-user.target.wants/elasticsearch.service to /usr/lib/systemd/system/elasticsearch.service.
[root@node1 ~]# cd /etc/elasticsearch/
3. Modify profile
[root@node1 ~]# cd /etc/elasticsearch/
[root@node1 elasticsearch]# cp /etc/elasticsearch/elasticsearch.yml /etc/elasticsearch/elasticsearch.yml.bak
[root@node1 elasticsearch]# vim /etc/elasticsearch/elasticsearch.yml
 Omit some contents
cluster.name: my-elk-cluster	##Cluster name 17
node.name: node1		##Node name 23
path.data: /data/elk_data	##Data storage path 33
path.logs: /var/log/elasticsearch/	##Log storage path 37
bootstrap.memory_lock: false		##Do not lock memory at startup: Lock physical memory to prevent es memory from being swapped out 43
network.host: 0.0.0.0	    ##The service binding ip address 0.0.0.0 represents all addresses 55
http.port: 9200		    ##The listening port is 9200 59
discovery.zen.ping.unicast.hosts: ["node1", "node2"]
4. Create and authorize the data storage path, and then start
[root@node1 elasticsearch]# mkdir -p /data/elk_data
[root@node1 elasticsearch]# chown elasticsearch.elasticsearch /data/elk_data
[root@node1 elasticsearch]# id elasticsearch
uid=987(elasticsearch) gid=981(elasticsearch) group=981(elasticsearch)
[root@node1 elasticsearch]# systemctl start elasticsearch.service
[root@node1 elasticsearch]# netstat -luntp |grep 9200
tcp6       0      0 :::9200                 :::*                    LISTEN      22764/java
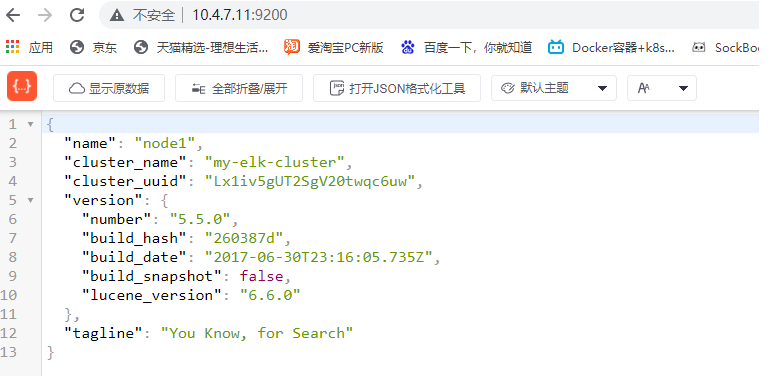
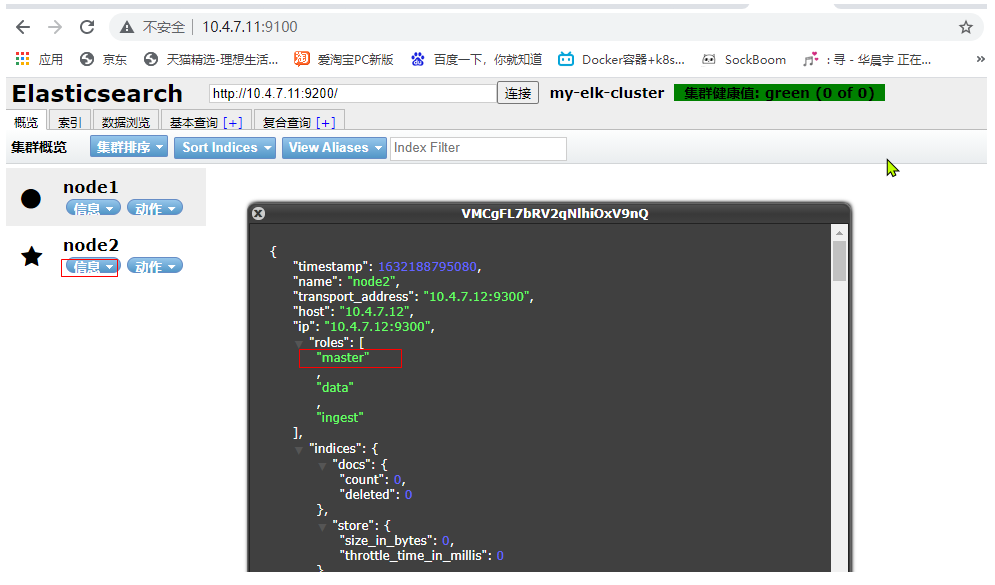
5. View the node information and use the real machine
10.4.7.11:9200, with the following node information
6. Operate on node 2
[root@node2 ~]# scp 10.4.7.11:/etc/elasticsearch/elasticsearch.yml /etc/elasticsearch/elasticsearch.yml
[root@node2 ~]# vim /etc/elasticsearch/elasticsearch.yml
 Omit some contents
node.name: node2   ##Change next
[root@node2 ~]# mkdir -p /data/elk_data
[root@node2 ~]# chown elasticsearch.elasticsearch /data/elk_data
[root@node2 ~]# systemctl restart elasticsearch.service
[root@node2 ~]# netstat -lunt |grep 9200
tcp6       0      0 :::9200                 :::*                    LISTEN
[root@node2 ~]#
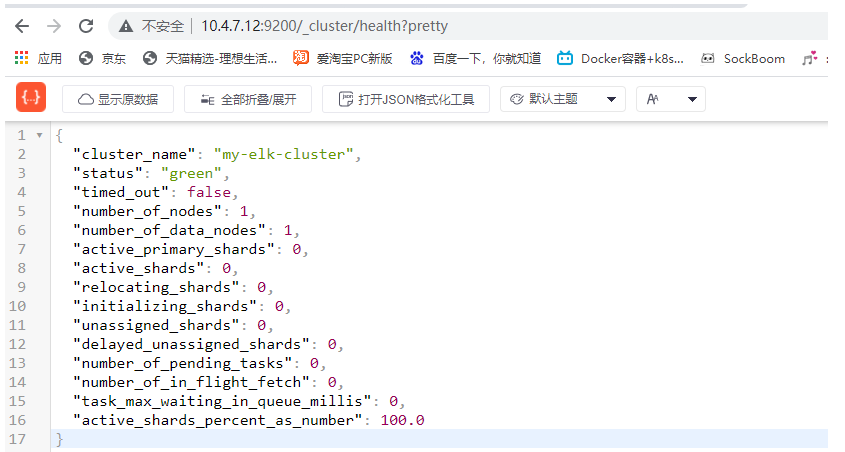
7. Check cluster health and status
Open on real browser http://10.4.7.12:9200/_cluster/health?pretty
Check cluster information- http://10.4.7.12:9200/_cluster/state?pretty
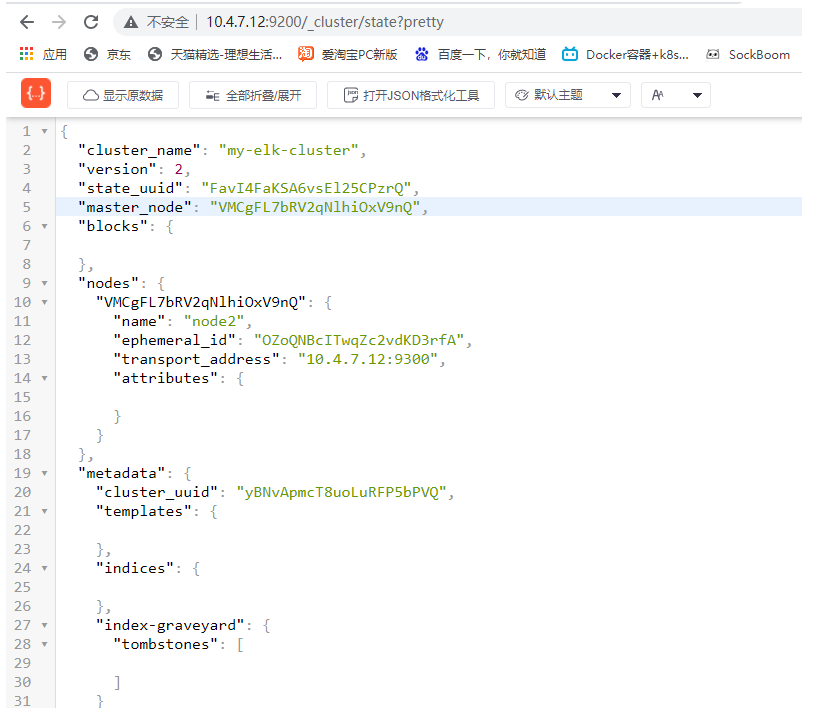
It should be noted that 9300 is the internal data port and 9200 is the external data port
3. Install the plug-in elasticsearch head on the node node
After installation, there will be a graphical interface display
[root@node1 ~]# yum -y install gcc gcc-c++ make
1. Compile and install node dependent packages
First, transfer the packet to two node nodes. Both sides are the same. Here, take one side as an example
[root@node1 opt]# tar zxf node-v8.2.1.tar.gz
[root@node1 opt]# cd node-v8.2.1/
[root@node1 node-v8.2.1]# ./configure
[root@node1 node-v8.2.1]# make -j3
[root@node1 node-v8.2.1]# make install
2. Install phantomjs front end architecture
Upload the software package to / root. Both sides are the same. Here I take one side as an example
[root@node1 ~]# tar xjf phantomjs-2.1.1-linux-x86_64.tar.bz2
[root@node1 ~]# /root/phantomjs-2.1.1-linux-x86_64/bin
[root@node1 bin]# cp phantomjs /usr/local/bin/
3. Install the visualizer for elasticsearch head data
Upload the software package on / root. Both sides are the same. Here, take one side as an example
[root@node1 ~]# tar zxf elasticsearch-head.tar.gz
[root@node1 ~]# cd elasticsearch-head/
[root@node1 elasticsearch-head]# npm install
npm WARN deprecated fsevents@1.2.13: fsevents 1 will break on node v14+ and could be using insecure binaries. Upgrade to fsevents 2.
npm WARN optional SKIPPING OPTIONAL DEPENDENCY: fsevents@^1.0.0 (node_modules/karma/node_modules/chokidar/node_modules/fsevents):
npm WARN notsup SKIPPING OPTIONAL DEPENDENCY: Unsupported platform for fsevents@1.2.13: wanted {"os":"darwin","arch":"any"} (current: {"os":"linux","arch":"x64"})
npm WARN elasticsearch-head@0.0.0 license should be a valid SPDX license expression

up to date in 16.732s
[root@node1 elasticsearch-head]#
4. Modify master profile
The two sides are the same. Take one side as an example
[root@node1 ~]# vim /etc/elasticsearch/elasticsearch.yml   ##Add 2 lines to the last line
[root@node1 ~]# tail -3 /etc/elasticsearch/elasticsearch.yml
#
http.cors.enabled: true     ##Enable cross domain access support. The default value is false
http.cors.allow-origin: "*"   ##Allowed domain names and addresses for cross domain access
[root@node1 ~]# systemctl restart elasticsearch
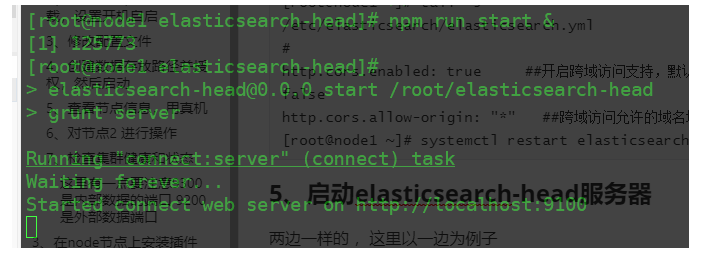
5. Start the elasticsearch head server
Both sides are the same. Take one side as an example
[root@node1 ~]# cd elasticsearch-head/
[root@node1 elasticsearch-head]# npm run start &
Open another port
[root@node1 ~]# netstat -luntp |grep 9100
tcp        0      0 0.0.0.0:9100            0.0.0.0:*               LISTEN      125783/grunt
When you open the browser, you can see the following results
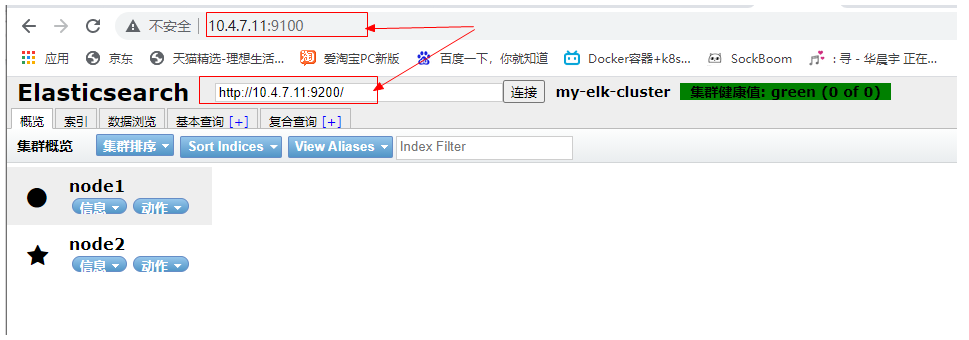
We can also see that the node is a master node through the node information. We can find that both nodes are master nodes because of the decentralized mechanism used here. One node can work normally
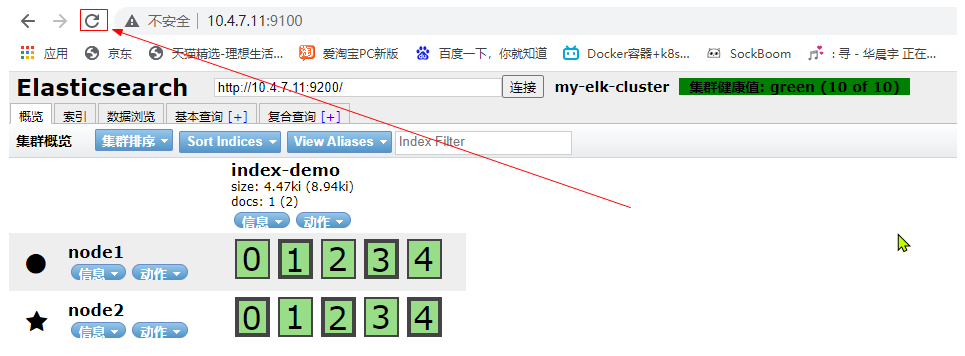
6. Create an index
Execute on the node1 host. Note: the index is index demo and the type is test. You can see that the creation is successful. The file format specified after - H is json
[root@node1 ~]# curl -XPUT 'localhost:9200/index-demo/test/1?pretty&pretty' -H 'content-Type: application/json' -d '{"user":"yunduan","mesg":"hello world"}'
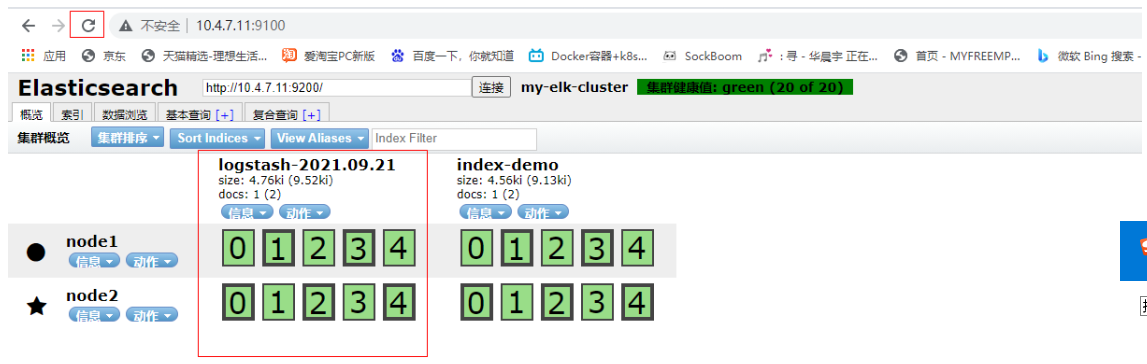
After the browser is refreshed, you will find that the service has made some pieces, cut them into 5 pieces, and the main pieces are thickened,
You can see this in the data browsing area, the index you created
The following is equivalent to a table, and "Yuan" and "hello world" are two fields
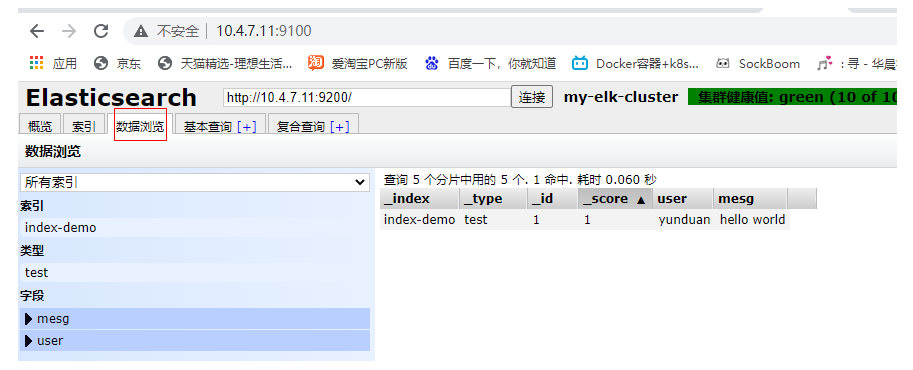
Note: the index is equivalent to a database, the type is equivalent to a table in the database, and the document is equivalent to a record in the table;;;; In this way, es is equivalent to a database
4. Install httpd and Logstash on the master node
1. Turn off the firewall, core protection, change the host name, install the httpd service, and confirm the java environment
[root@master ~]# yum -y install httpd
 Confirm that there are no logs
[root@master ~]# cd /var/log/httpd
[root@master httpd]# ls
[root@master httpd]#
Open service
[root@master httpd]# systemctl start httpd
[root@master httpd]# ls
access_log  error_log
[root@master httpd]# ll
total 4
-rw-r--r--. 1 root root   0 Sep 21 10:31 access_log
-rw-r--r--. 1 root root 817 Sep 21 10:31 error_log
[root@master httpd]#
Under browser access access_log There will be data
2. Install logstash
First, you need to create the package to the / root directory
[root@master ~]# rpm -ivh logstash-5.5.1.rpm
warning: logstash-5.5.1.rpm: Header V4 RSA/SHA512 Signature, key ID d88e42b4: NOKEY
Preparing...                          ################################# [100%]
Updating / installing...
   1:logstash-1:5.5.1-1               ################################# [100%]
Using provided startup.options file: /etc/logstash/startup.options
Successfully created system startup script for Logstash
[root@master ~]# systemctl start logstash
[root@master ~]# ln -s /usr/share/logstash/bin/logstash /usr/local/bin/
[root@master ~]#
3. Whether the functions of logstash (Apache) and elasticsearch are normal and the docking test shall be conducted
The logstash command is used for testing
Field Description:
-f through this option, you can specify the configuration file of logstash and configure logstash according to the configuration file
-e is followed by a string, which can be used as the configuration of logstash (if it is' ', stdin is used as input and stdout is used as output by default)
-f test whether the configuration file is correct, and then exit
4. The input adopts standard input and output, and the process operation of logging in to the master server adopts standard input and output
[root@master ~]# logstash -e 'input { stdin{} } output { stdout{} }'    ##Details cannot be displayed with this
[root@master ~]# logstash -e 'input { stdin{} } output { stdout{codec=>rubydebug} }'
You can enter something and see that the detailed information is displayed
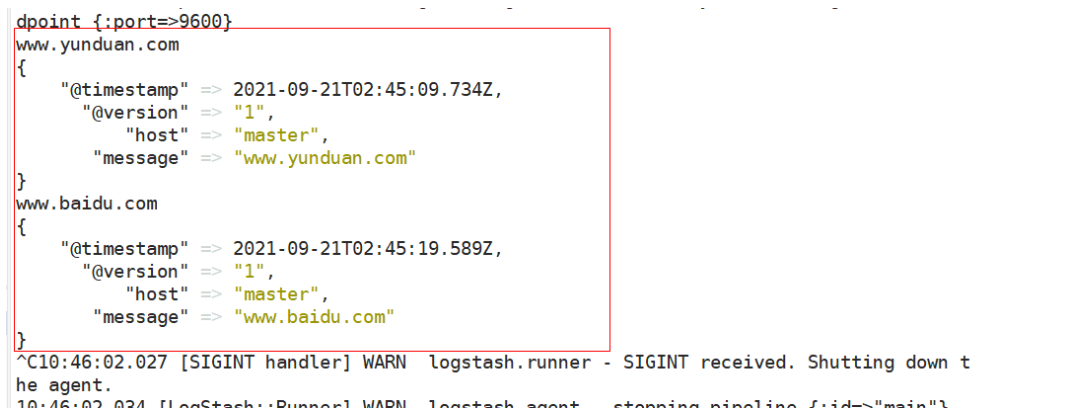
5. Input / output connection es
[root@master ~]# logstash -e 'input { stdin{} } output { elasticsearch { hosts=>["10.4.7.11:9200"] } }'
Enter a piece of data after a while
www.yunduan.com
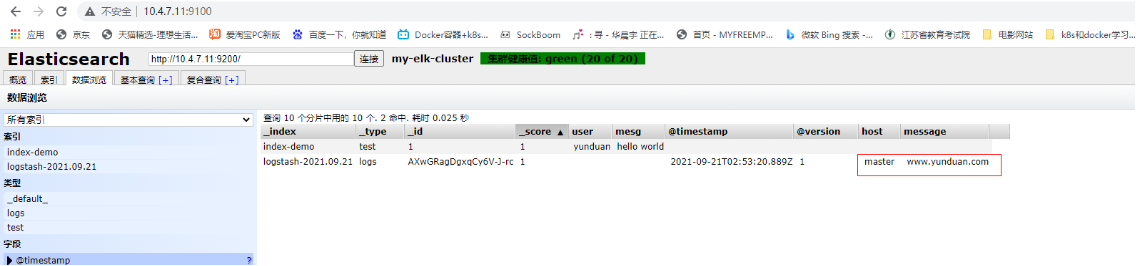
Then you can see the new index and data generation on the browser page
Then click data browse to view the data you just entered, or see the details
5. Log in to the master Apache host for docking configuration
Note: the logstash configuration file is mainly composed of three parts: input, output and filter (it is mainly used to filter logs of different software, such as dns, nginx, etc., as required)
1. Opening permissions is convenient for other users to read data, modify configuration files and restart
[root@master ~]# chmod o+r /var/log/messages
[root@master ~]# ll /var/log/messages
-rw----r--. 1 root root 702154 Sep 21 11:03 /var/log/messages
[root@master ~]#
[root@master ~]# vim /etc/logstash/conf.d/system.conf
[root@master ~]# cat /etc/logstash/conf.d/system.conf
input {
        file{				##Specifies the in the collection location function
         path => "/var/log/messages"    ##Specify path
         type => "system"		##Make a label
         start_position => "beginning"  ##Specifies where to start
        }
      }
output {				##output
        elasticsearch {			##Output to es
         hosts => ["20.0.0.10:9200"]    ##specify an IP address
         index => "system-%{+YYYY.MM.dd}"     ##Generated date format index
         }
        }
[root@master ~]# systemctl restart logstash
2. Refresh and observe in the browser
First, after refreshing, you can see that the index system-2021.09.21 has been generated
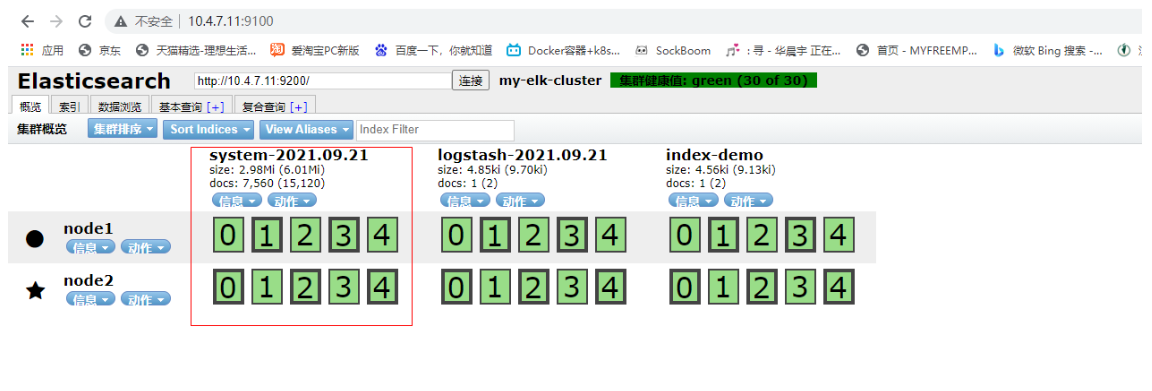
Then click data browse to view the system log
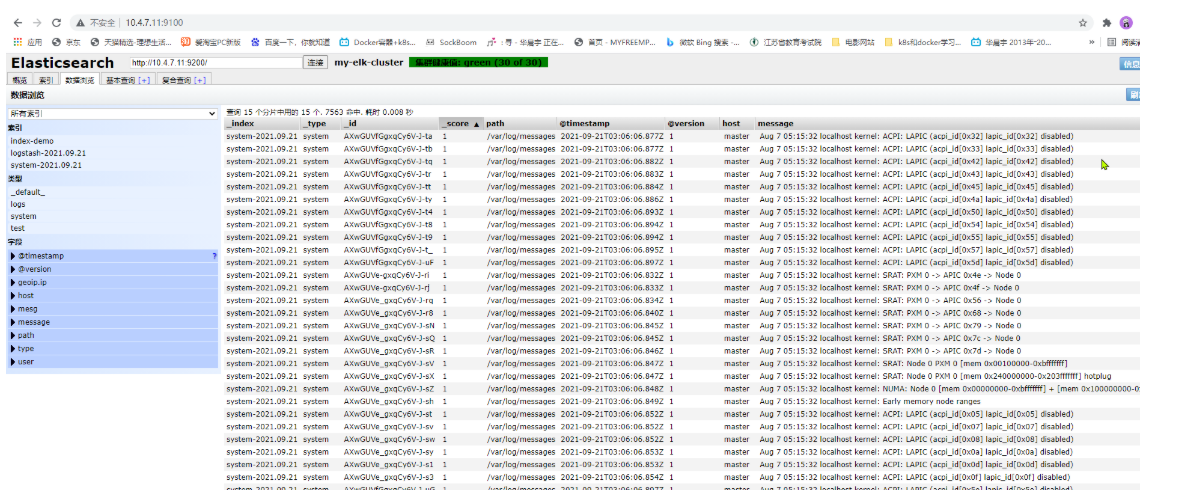
You can see the data details at any point
Then data query and basic query can help you better query the specified information
6. Install kibana service on host
1. Install kibana service to node2, node1 or open another host
First, put kibana on / root
[root@node2 ~]# rpm -ivh kibana-5.5.1-x86_64.rpm
warning: kibana-5.5.1-x86_64.rpm: Header V4 RSA/SHA512 Signature, key ID d88e42b4: NOKEY
Preparing...                          ################################# [100%]
Updating / installing...
   1:kibana-5.5.1-1                   ################################# [100%]
[root@node2 ~]# cp /etc/kibana/kibana.yml /etc/kibana/kibana.yml.bak
[root@node2 ~]# vi /etc/kibana/kibana.yml
 Omit some contents
server.port: 5601		##Open the port 2 line of kibana
server.host: "0.0.0.0"		##The listening address is changed to all 7 lines
elasticsearch.url: "http://20.0.0.10:9200" 	## Connect with es 21
##Note here: the production environment must perform load balancing. elasticsearch.rul is followed by the VIP address or load balancing address
kibana.index: ".kibana"		##Add. kibana index 30 in es
[root@node2 ~]# systemctl start kibana.service
[root@node2 ~]# systemctl enable kibana.service
2. Test the installed content on the browser
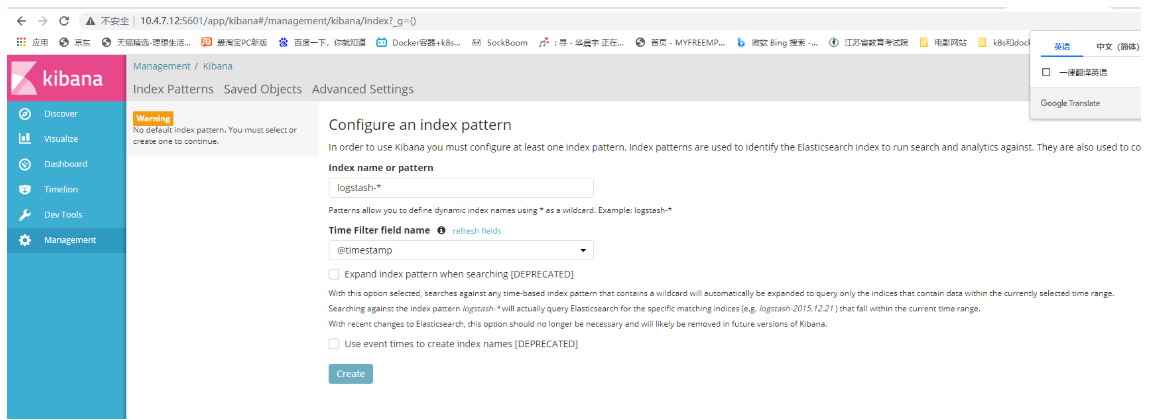
Add index
First, add logstash. If you fill in the es, you will not report an error. If you don't, you will report that you can't find it
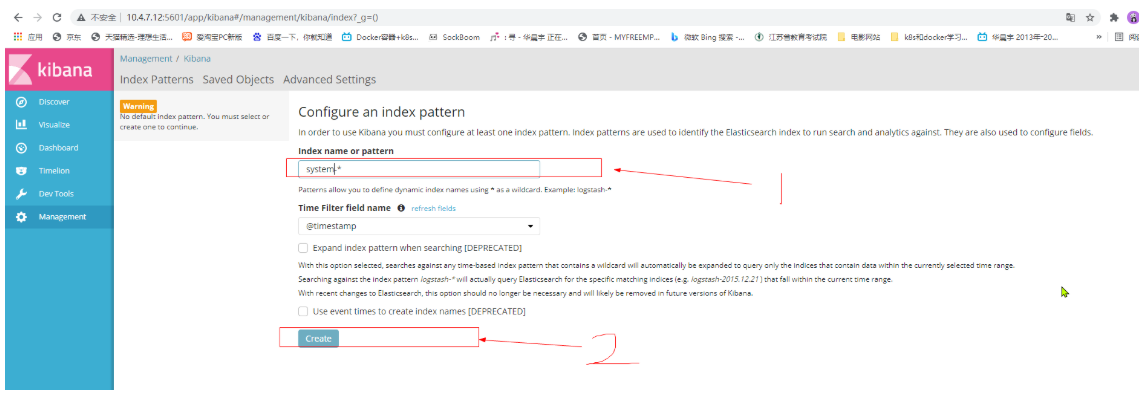
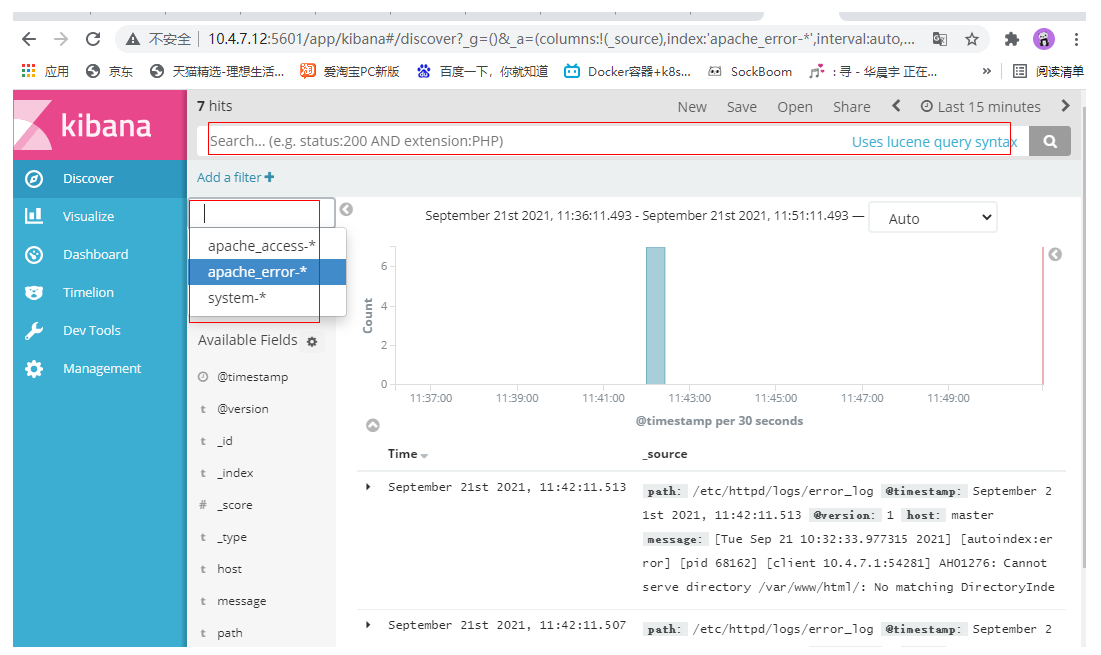
Click discover to display a graphical interface
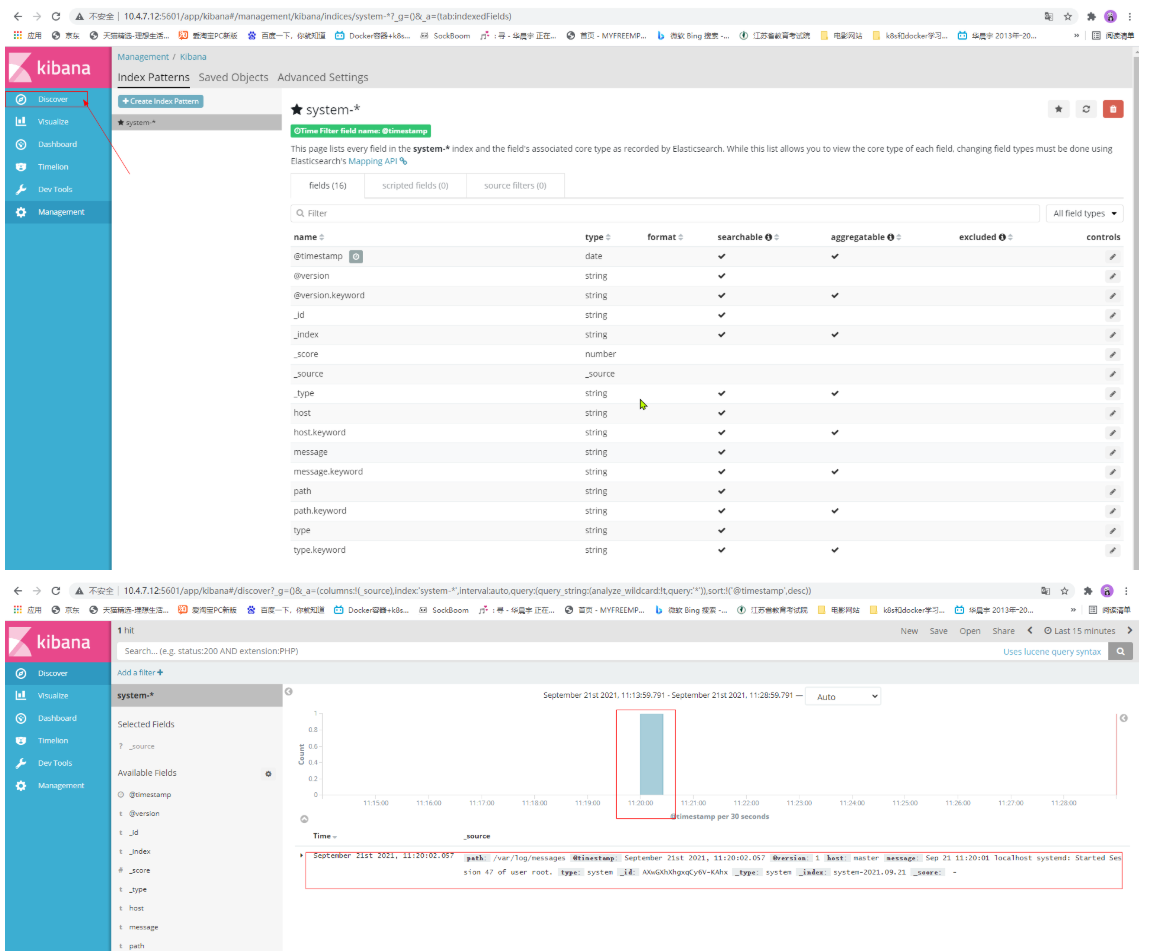
The above is the display of the system log. To create http, do the following
7. Add http log to kibana
[root@master ~]# vim /etc/logstash/conf.d/apache_log.conf
[root@master ~]# cat /etc/logstash/conf.d/apache_log.conf
input {
      file{
       path => "/etc/httpd/logs/access_log"
       type => "access"
       start_position => "beginning"
       }
      file{
       path => "/etc/httpd/logs/error_log"
       type => "error"
       start_position => "beginning"
       }
      }
output {
        if [type] == "access" {
        elasticsearch {
        hosts => ["10.4.7.11:9200"]
        index => "apache_access-%{+YYYY.MM.dd}"
         }
        }
        if [type] == "error" {
        elasticsearch {
         hosts => ["10.4.7.11:9200"]
         index => "apache_error-%{+YYYY.MM.dd}"
         }
        }
	}
[root@master ~]#
2. To start logstash, you need to specify the configuration file
[root@master ~]# /usr/share/logstash/bin/logstash -f /etc/logstash/conf.d/apache_log.conf
At this time, you can see that there are two more tags, and the regular startup is successful
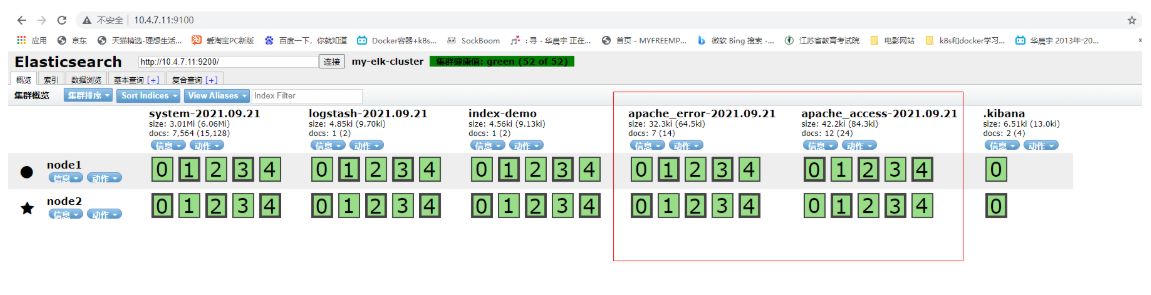
Click data browse to find that there are two indexes
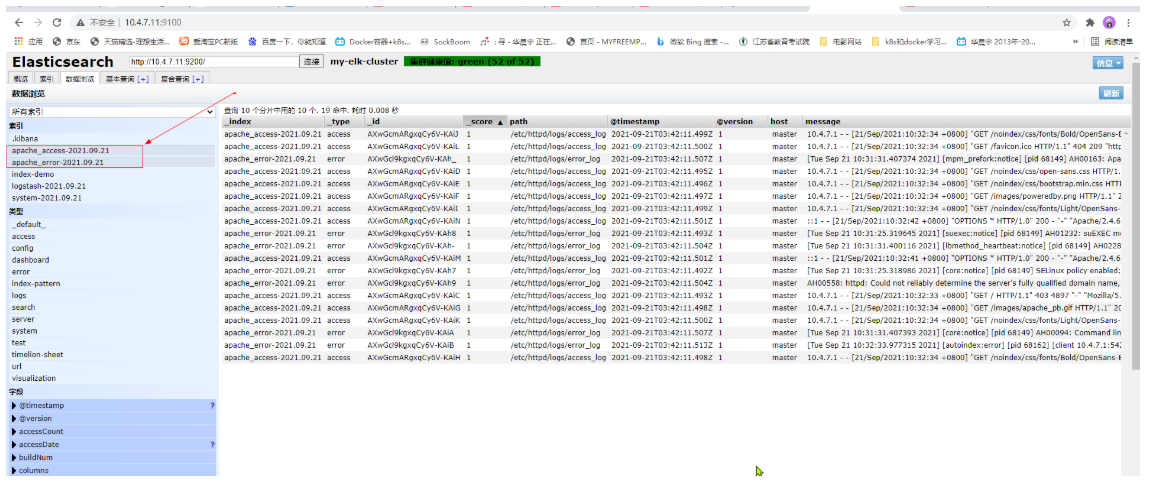
3. Add the log display of httpd in kibana
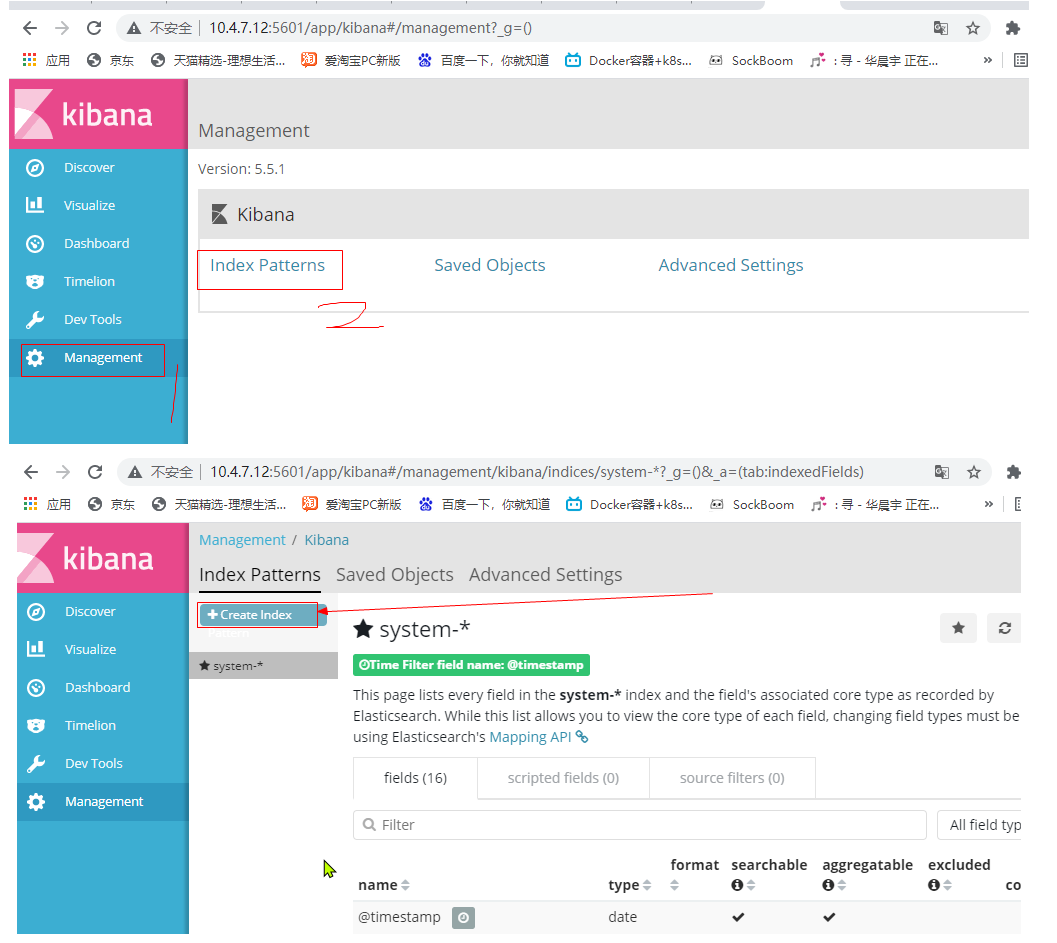
Then create two indexes, apache_access and apache_error
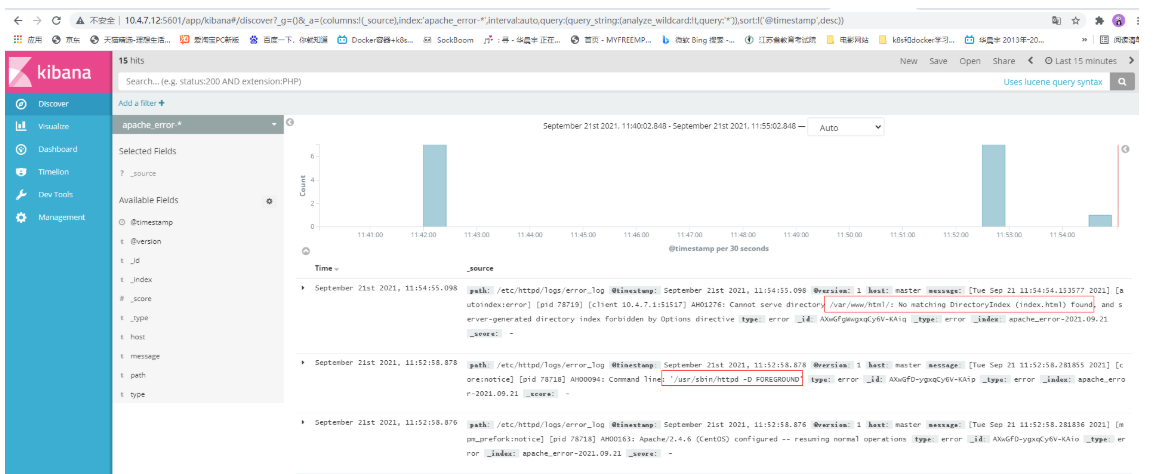
4. Observation results
You can restart http to see the results
Look at the logs that appear after httpd is restarted and the browser is accessed
<video class="" autoplay="" tabindex="2" mediatype="video" crossorigin="anonymous" src="https://vd3.bdstatic.com/mda-kfmaqa0m4upjx832/mda-kfmaqa0m4upjx832.mp4?v_from_s=hkapp-haokan-suzhou&auth_key=1632199018-0-0-865bc6596fcf45091d01bf4f5eadc176&bcevod_channel=searchbox_feed&pd=1&pt=3&abtest=3000185_2" style="position: absolute; top: 0px; left: 0px;" __idm_id__="251168769"></video>