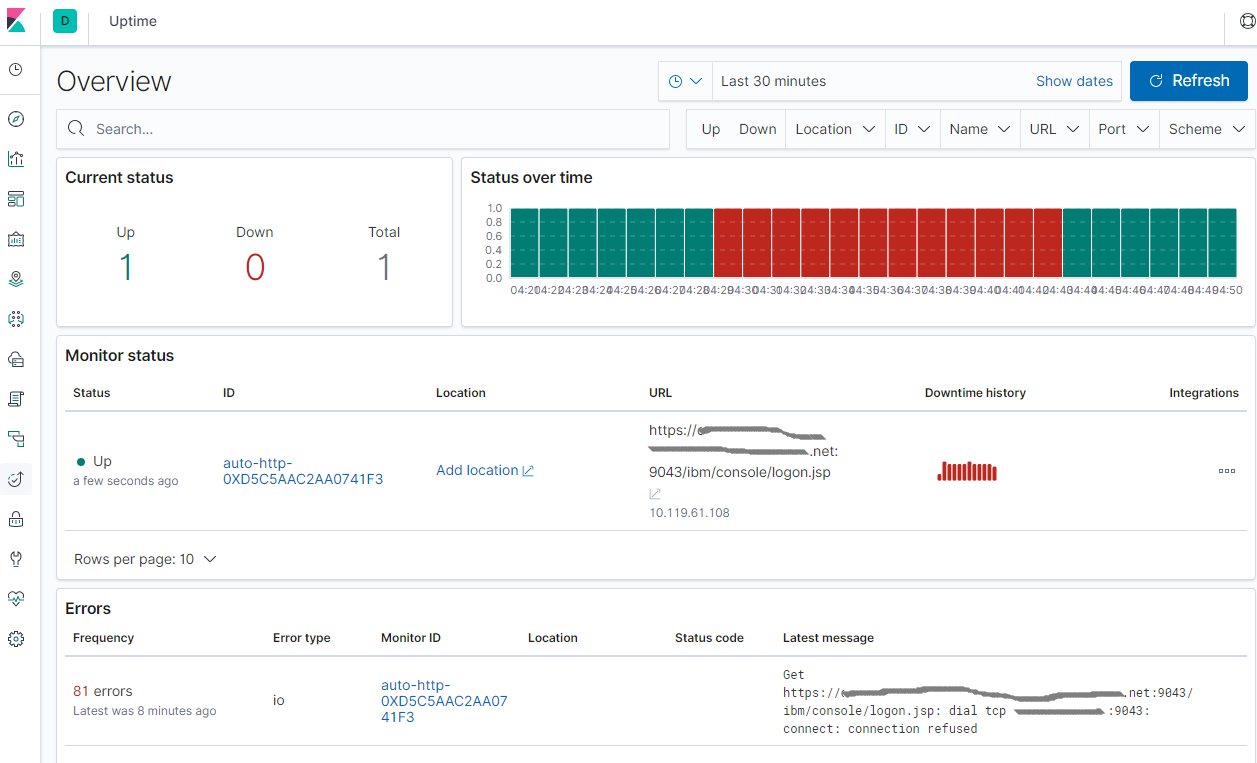
Hearthbeat, heartbeat, as its name implies, can be used to periodically detect whether the service is functioning properly.
Hearthbeat supports ICMP, TCP and HTTP, as well as TLS, authentication and proxy.
Hearthbeat can work seamlessly with Logstash, Elastic search and Kibana. Install Hearthbeat, add services that need to be monitored, configure Elastic search and Kibana, and then output the results to Elastic search and display them in Kibana.
Kibana does not need to reconfigure the Dashboard, but clicks on the Uptime menu to see the results.
Installation of Elasticsearch and Kibana is available for reference: Fast Building ELK (7.2.0)
download
curl -L -O https://artifacts.elastic.co/downloads/beats/heartbeat/heartbeat-7.2.0-linux-x86_64.tar.gz
tar xzvf heartbeat-7.2.0-linux-x86_64.tar.gz -C /opt/elk/
To configure
cd /opt/elk/heartbeat-7.2.0-linux-x86_64/
vi heartbeat.yml
For example, by simply detecting the console url to monitor whether the Websphere is working properly.
Monitoring TCP can refer to the examples in the comments. Schedule says it monitors every 10 seconds.
# Configure monitors inline
heartbeat.monitors:
- type: http

  # List or urls to query
  urls: ["https://dummy.hostname.net:9043/ibm/console/logon.jsp"]

  # Configure task schedule
  schedule: '@every 10s'

#- type: tcp
  #hosts: ["192.168.1.101:1414"]
  #schedule: '@every 10s'


setup.kibana:

  # Kibana Host
  # Scheme and port can be left out and will be set to the default (http and 5601)
  # In case you specify and additional path, the scheme is required: http://localhost:5601/path
  # IPv6 addresses should always be defined as: https://[2001:db8::1]:5601
  host: "localhost:5601"

output.elasticsearch:
  # Array of hosts to connect to.
  hosts: ["localhost:9200"]
start-up
chown elk:elk -R /opt/elk/heartbeat-7.2.0-linux-x86_64/
sudo chmod o+rx -R /opt/elk/heartbeat-7.2.0-linux-x86_64/

sudo -u elk ./heartbeat setup

sudo -u elk nohup ./heartbeat -e &
Verification
- Open http://localhost:5601/
- Go to Uptime.
- Restart monitored services
