1. Preface
The logs mainly include system logs and application logs. Operations and developers can use the logs to understand information about hardware and software in the server, check for application or system failures, and understand the cause of the failure in order to solve the problem.Analyzing the logs gives you a clearer picture of the server's state and system security so that you can maintain the server's stable operation.
However, logs are usually stored on their own servers.If dozens of servers are managed and the logs need to be logged on to different servers in turn, the viewing process can be cumbersome and inefficient.Although the rsyslog service can be used to summarize the logs.However, it is difficult to count or retrieve the data in some logs. Generally, Linux commands such as grep, awk, wc, sort are used for statistics and retrieval.If a large number of logs are retrieved statistically, manual efficiency is still very low.
Complete log data plays an important role by collecting and summarizing logs:
- Information lookup.BUG can be quickly resolved by retrieving log information and finding corresponding errors.
- Data analysis.If you truncate the formatted log information, you can further analyze and statistics the log, select headlines, hot spots, or explosions.
- System maintenance.Log information analysis can help you understand the load and running status of your server.Servers can be optimized for specific purposes.
2. Introduction to ELK
ELK real-time log collection and analysis system can perfectly solve the above problems.ELK is free to use as an open source software and is updated in real time by a strong team and community.
ELK consists mainly of three open source tools, ElasticSearch, Logstash, and Kibana, as well as other lightweight data collector Beats designed to collect data.
Elasticsearch: A distributed search engine.It has the features of high scalability, high reliability and easy management.It can be used for full-text retrieval, structured retrieval and analysis, and can combine the three.Elasticsearch was developed using Java based on Lucene and is now one of the most widely used open source search engines on which Wikipedia, StackOverflow, Github, and others build their own search engines.
In elasticsearch, the data for all nodes is equal.
Logstash: Data collection and processing engine.Supports the dynamic collection of data from a variety of data sources, filtering, analysis, enrichment, uniform format, and other operations, and then storage for subsequent use.
Kibana: Visualization platform.It searches for and displays indexed data stored in Elasticsearch.Use it to display and analyze data easily with charts, tables, maps.
Filebeat: Lightweight data collection engine.Filebeat consumes almost nothing compared to the system resources used by Logstash.It is based on the original Logstash-fowarder source.In other words, Filebeat is the new version of Logstash-fowarder and will be ELK Stack's first choice in Agent.
Version description:
The version numbers of Elasticsearch, Logstash, Kibana, Filebeat installations must all be the same, otherwise kibana cannot display the web page.
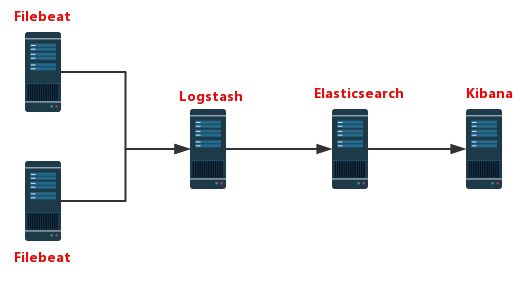
ELK working illustration:
- Filebeat collects logs on the APP Server side
- Logstash handles filtering logs collected by Filebeat
- Elasticsearch stores logs after processing provided by Logstash for retrieval, statistics
- Kibana provides web pages to visualize data from Elasticsearch
3. ELK Installation and Deployment
1. Configure the JDK environment first
 #Download jdk by yourself
 rpm -ivh  jdk-8u144-linux-x64.rpm
 #Or yum install java-1.8.0-openjdk*
 vim /etc/profile.d/java.sh
    export JAVA_HOME=/usr/lib/jvm/java-1.8.0-openjdk-1.8.0.131-11.b12.el7.x86_64
    export PATH=$JAVA_HOME/jre/bin:$PATH

 source /etc/profile.d/java.sh
2. Configure ELK yum source
vim /etc/yum.repo.d/ELK.repo
[ELK]
name=ELK-Elasticstack
baseurl=https://mirrors.tuna.tsinghua.edu.cn/elasticstack/yum/elastic-6.x/
gpgcheck=0
enabled=1

#Close selinux
setenforce 0
sed -i.bak  's@^SELINUX=\(.*\)@SELINUX=disabled@p' /etc/selinux/config

#Close Firewall
#Centos7
systemctl disable firewalld
systemctl stop firewalld
#CentOS6
service iptables stop
service iptables disable
3. Deploy elasticsearch
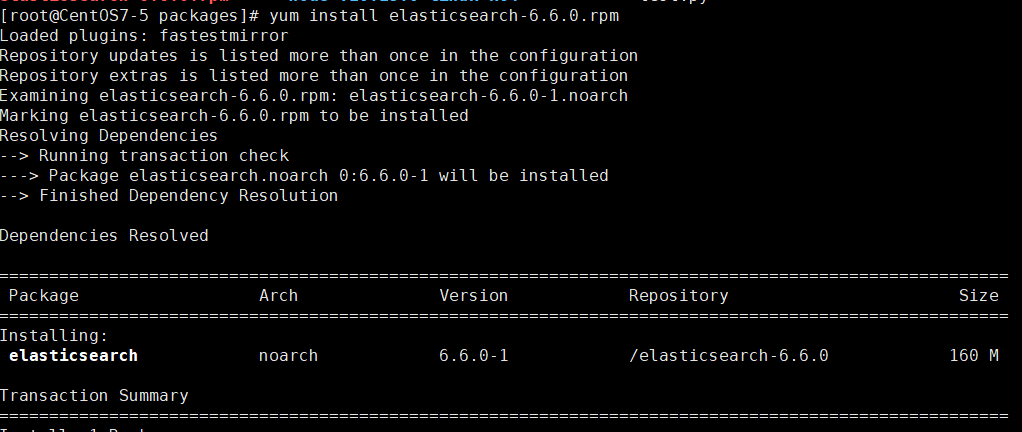
1. Install elasticsearch
yum install elasticsearsh

# Modify System Profile Properties
#   vim  /etc/security/limits.conf
elasticsearch soft memlock unlimited
elasticsearch hard memlock unlimited
elasticsearch soft nofile 65536
elasticsearch hard nofile 131072
2. Modify the configuration file
#  vim /etc/elasticsearch/elasticsearch.yml
#Cluster name
cluster.name: els
#Node name
node.name: els-1
#Data Storage Path
path.data: /data/els_data
#Log Storage Path
path.logs: /data/log/els
#Locks the memory specified by jvm.options without swap memory
bootstrap.memory_lock: true
#Bind IP Address
network.host: 172.16.1.49
#Port number
http.port: 9200


#Configure the cluster configuration, fill in the cluster nodes, and automatically discover nodes
#  discovery.zen.ping.unicast.hosts: ["host1", "host2"]
# Cluster configuration requires only modifying node names and binding ip addresses

#  vim /etc/elasticsearch/jvm.options
-Xms1g  #Specify the size of memory occupied, both numbers being equal to 1g
-Xmx1g
3. Create a data catalog
#Create the elasticsearch database directory and modify the owner to be elasticsearch.
mkdir /data/els_data
mkdir /data/log/els
chown -R elasticsearch.elasticsearch /data/els_data
chown -R elasticsearch.elasticsearch /data/log/els
4. Start elasticsearch
systemctl start elasticsearch
# Automatic shutdown after start-up
#Report errors
[1] bootstrap checks failed
[1]: memory locking requested for elasticsearch process but memory is not locked

#Comment out bootstrap.memory_lock: true in the configuration file and do not use it; boot succeeds
Report errors
After successful startup
Access 172.16.1.49:9200
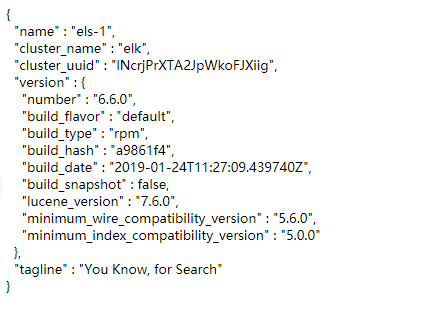
Elasticsearch API
- Cluster status: http://172.16.1.100:9200/_cluster/health pretty?
- Node status: http://172.16.1.100:9200/_nodes/process pretty?
- Fragmentation status: http://172.16.1.100:9200/_cat/shards
- Index fragmentation stores information: http://172.16.1.100:9200/index/_shard_stores?
- Index status: http://172.16.1.100:9200/index/_stats?
- Index metadata: http://172.16.1.100:9200/index?
4. Deploy Kibana
Kibana is written by node.js and does not require a java environment.Install directly
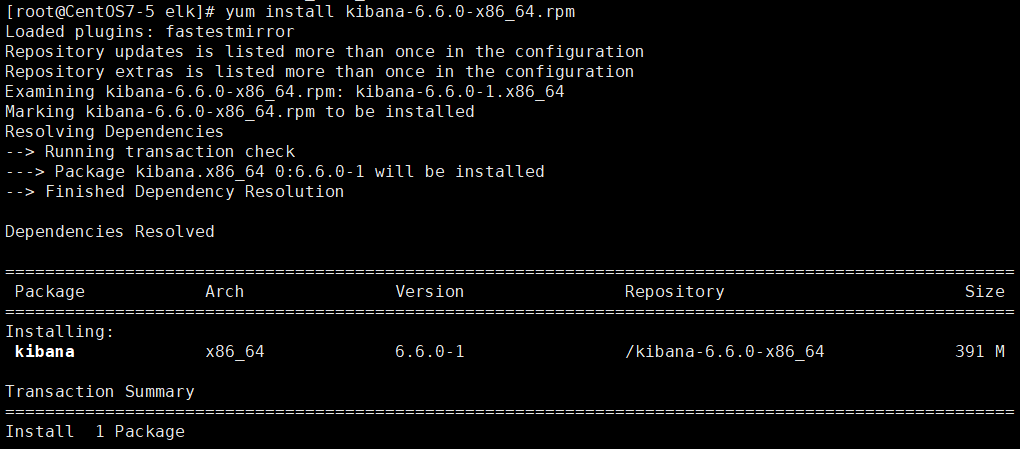
1. Install Kibana
yum install kibana
# Version number needs to be the same as Elasticsearch
2. Configure Kibana
vim /etc/kibana/kibana.yml
server.port: 5601
server.host: "172.16.1.50"
elasticsearch.url: "http://172.16.1.49:9200"
kibana.index: ".kibana"
logging.dest: /data/log/kibana/kibana.log # Configure where kibana log output goes

# Create log directory file
mkdir -p /data/log/kibana/
touch /data/log/kibana/kibana.log
chmod o+rw  /data/log/kibana/kibana.log
Access 172.16.1.50:5601
Kibana server is not ready yet
Indicates kibana does not match Elasticsearch version number
# View version number
rpm -qa elasticsearch kibana
If the version number is the same, refresh the page a few more times.
After successful startup, visit the page to see:

5. Deploy Logstash
Configure the same Java environment as Elasticsearch, with more than 8 versions.
1. Install Logstash
yum install logstash-"Version"
2. Modify the configuration file
http.host: "172.16.1.229"
http.port: 9600-9700
3. Configure the collection of nginx log profiles
- Modify nginx's log format
log_format main '{"@timestamp":"$time_iso8601",'
'"host":"$server_addr",'
'"clientip":"$remote_addr",'
'"request":"$request",'
'"size":$body_bytes_sent,'
'"responsetime":$request_time,'
'"upstreamtime":"$upstream_response_time",'
'"upstreamhost":"$upstream_addr",'
'"http_host":"$host",'
'"url":"$uri",'
'"referer":"$http_referer",'
'"agent":"$http_user_agent",'
'"status":"$status"}';

access_log /var/log/nginx/access_test.log  main;
- Configure Lostash Collection Log Profile
input {
        file {
                type =>"nginx-log"
                path => ["/var/log/nginx/access.log"]
                start_position => "beginning"
                sincedb_path => "/dev/null"
                }
}

output {
        elasticsearch {
                hosts => ["172.16.1.49:9200"]
                index => "nginx-log-%{+YYYY.MM}"
        }
}
4. Test profile availability
cd /usr/share/logstash/bin
./logstash --path.settings /etc/logstash/ -f /etc/logstash/conf.d/nginx.conf  --config.test_and_exit

OpenJDK 64-Bit Server VM warning: If the number of processors is expected to increase from one, then you should configure the number of parallel GC threads appropriately using -XX:ParallelGCThreads=N
Sending Logstash logs to /var/log/logstash which is now configured via log4j2.properties
[2019-02-20T17:34:29,949][WARN ][logstash.config.source.multilocal] Ignoring the 'pipelines.yml' file because modules or command line options are specified
Configuration OK # Profile OK can be used
[2019-02-20T17:34:39,048][INFO ][logstash.runner          ] Using config.test_and_exit mode. Config Validation Result: OK. Exiting Logstash
WARN error does not affect operation
Use commands directly
./logstash --path.settings /etc/logstash/ -f /etc/logstash/conf.d/nginx.conf
You can run logstash directly
6. Deploy filebeat
Logstash's data is retrieved from Beats, and Logstash no longer needs to go to the data source itself.
The log collection tool we used before was logstash, but logstash takes up a lot of resources and is not as lightweight as beats, so it is also recommended to use beats as a log collection tool.And beats can be extended to support custom builds.
yum install filebeat-6.6.0
1. Modify the filebeat configuration file
vim /etc/filebeat/filebeat.yml

- type: log
	paths:
		- /Log_File #/var/log/messages

#output.elasticsearch: #Comment out the configuration output to elasticsearch
	# hosts: ["localhost:9200"]

output.console: #Add configuration output to current terminal
	enable: true
2. Test filebeat
/usr/share/filebeat/bin/filebeat -c /etc/filebeat/filebeat.yml #Run filebeat to see the log output in the current terminal
3. Modify the configuration to output the log to elasticsearch
- type: log
	paths:
		- /Log_File #/var/log/messages

output.elasticsearch: #Comment out the configuration output to elasticsearch
	hosts: ["172.16.1.49:9200"]
Start filebeat system CTL start filebeat
Run curl'172.16.1.49:9200/_cat/indices?V'to view the log index

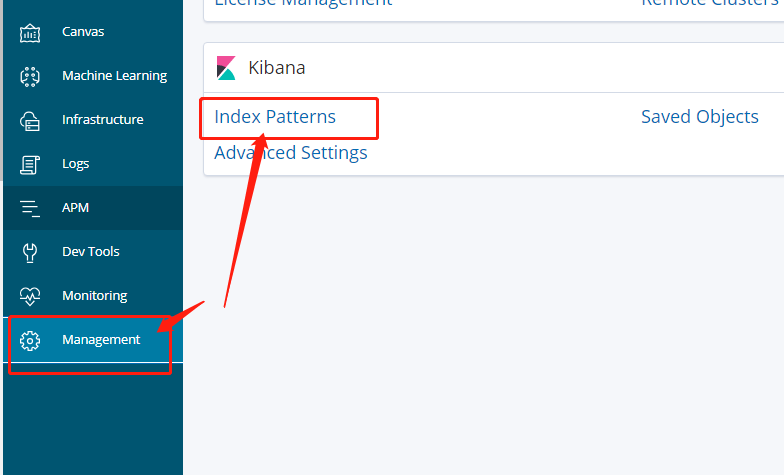
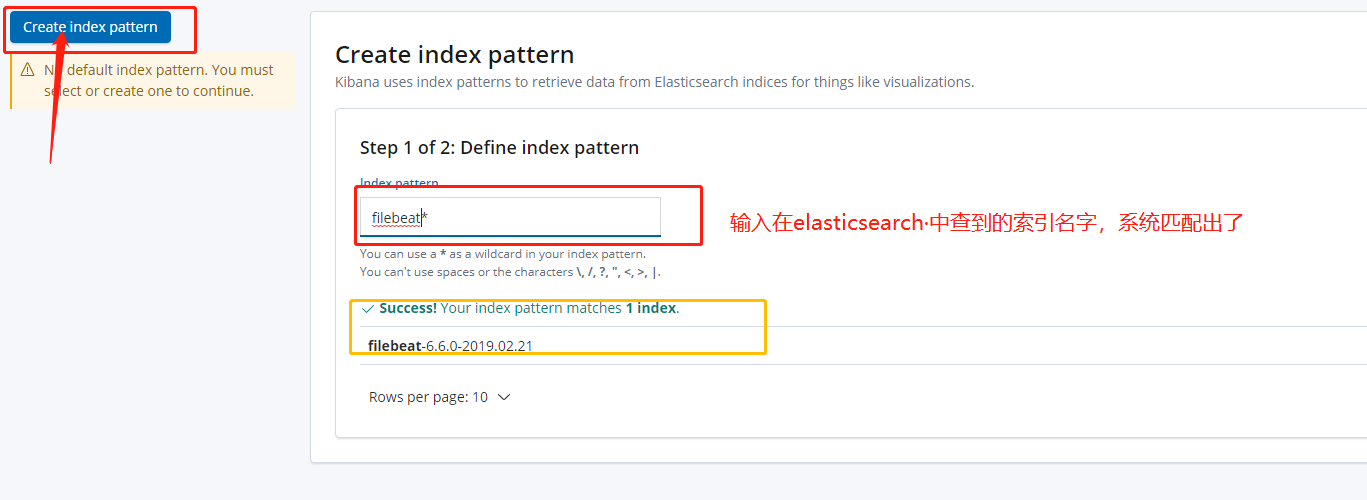
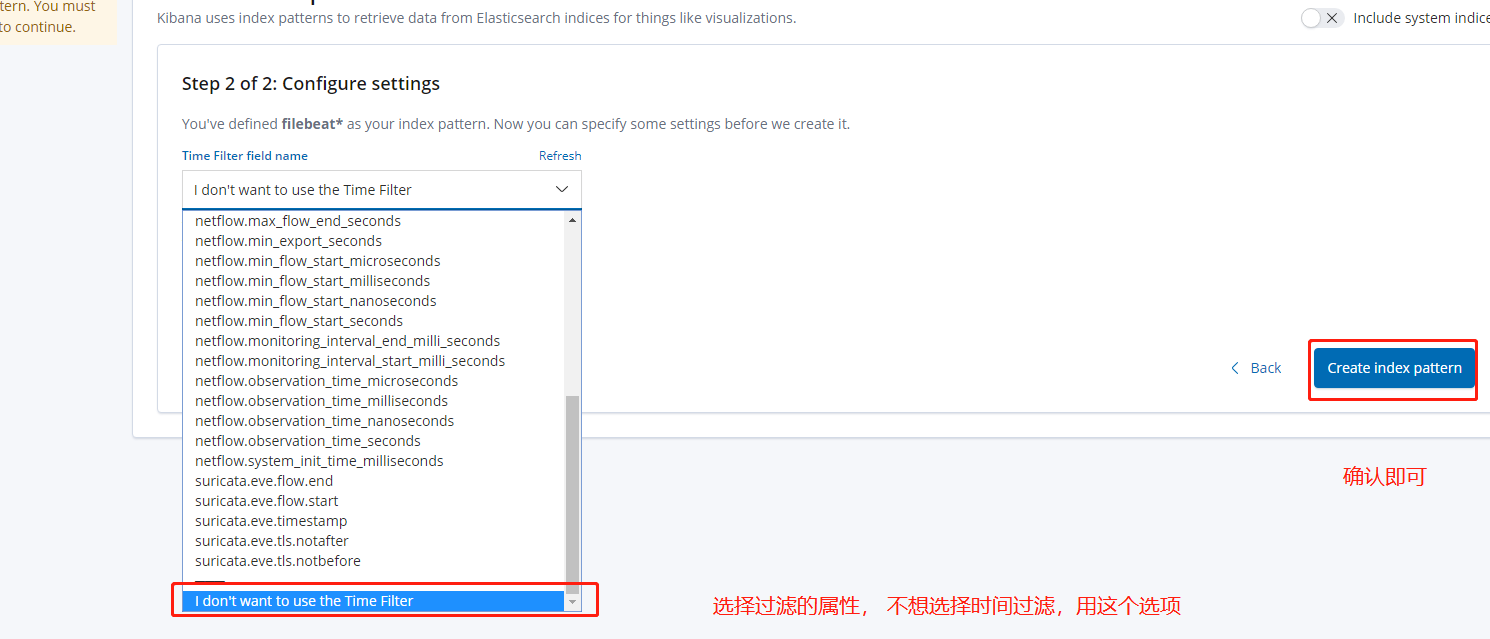
4. Configure indexes in Kibana
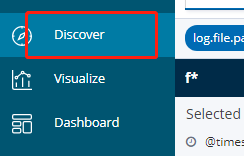
You can view the log
5. Output log to logstash
#------------------- Logstash output ----------------------
output.logstash:  #Configuration notes that will be output to elasticsearch
  # The Logstash hosts
  hosts: ["172.16.1.229:5044"]

  # Optional SSL. By default is off.
  # List of root certificates for HTTPS server verifications
  #ssl.certificate_authorities: ["/etc/pki/root/ca.pem"]

  # Certificate for SSL client authentication
  #ssl.certificate: "/etc/pki/client/cert.pem"

  # Client Certificate Key
  #ssl.key: "/etc/pki/client/cert.key"
6. Configure logstash
vim /etc/logstash/conf.d/test.conf
input {
        beats {
                port =>5044
                }
}
#filter{}  #Filter, custom filter some data in the log
output {
        stdout {
                codec => rubydebug
        }
        elasticsearch {
                hosts => "172.16.1.49:9200"
                index => "test-log-%{+YYYY.MM.dd}"
        }
}

You already have a log index on Elasticsearch, which you can see on kibana
yellow indicates that no replica nodes are available because two Elasticsearch were not built during the test
You can use filebeat to monitor custom files and insert data manually.