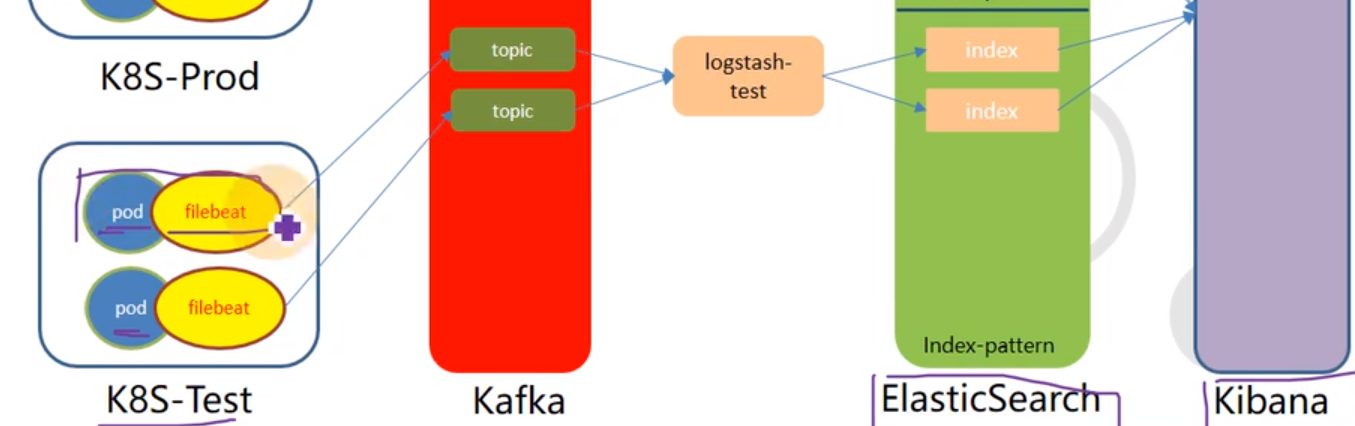
Log collection process
Collection, which can collect log data from multiple sources (streaming log collection)
Transmission, which can stably transmit logs to the central system; ElasticSearch can be transmitted through 9200 HTTP or
framework
Install elasticsearch-6.8.6
Service deployed on 21
src]# wget https://artifacts.elastic.co/downloads/elasticsearch/elasticsearch-6.8.6.tar.gz
src]# tar -xf elasticsearch-6.8.6.tar.gz -C /opt/release/
src]# ln -s /opt/release/elasticsearch-6.8.6 /opt/apps/elasticsearch

~]# grep -Ev "^$|^#" /opt/apps/elasticsearch/config/elasticsearch.yml # Adjust the following configuration
cluster.name: elasticsearch.zoneyet.com
path.data: /data/elasticsearch/data
path.logs: /data/elasticsearch/logs
bootstrap.memory_lock: true
network.host: 172.16.0.21
http.port: 9200
~]# vim /opt/apps/elasticsearch/config/jvm.options # Default 1g
......
# Generally, it does not exceed 32G in production
-Xms16g
-Xmx16g
~]# useradd -M es
~]# mkdir -p /data/elasticsearch/{logs,data}
~]# chown -R es.es /data/elasticsearch /opt/release/elasticsearch-6.8.6

## Modify es user's kernel configuration
~]# vim /etc/security/limits.conf
......
es hard nofile 65536
es soft fsize unlimited
es hard memlock unlimited
es soft memlock unlimited
~]# echo "vm.max_map_count=262144" >> /etc/sysctl.conf ; sysctl -p

# Manage es commands
 ~]# su es -c "/opt/apps/elasticsearch/bin/elasticsearch -d" # start-up
 ~]# su es -c "/opt/apps/elasticsearch/bin/elasticsearch -d -p /data/elasticsearch/logs/pid" # Specifies the file startup es for the pid record
 ~]# netstat -lntp | grep 9.00
tcp6       0      0 10.4.7.12:9200          :::*                    LISTEN      69352/java
tcp6       0      0 10.4.7.12:9300          :::*                    LISTEN      69352/java
 ~]# su es -c "ps aux|grep -v grep|grep java|grep elasticsearch|awk '{print \$2}'|xargs kill" # kill Pid
 ~]# pkill -F /data/elasticsearch/logs/pid

# Add k8s log index template
 ~]# curl -H "Content-Type:application/json" -XPUT http://172.16.0.21:9200/_template/k8s -d '{
  "template" : "k8s*",
  "index_patterns": ["k8s*"],
  "settings": {
    "number_of_shards": 5,
    "number_of_replicas": 0
  }
}'
Install kafka
It is better not to exceed version 2.2, after which kafka_manager is no longer supported
 src]# wget https://archive.apache.org/dist/kafka/2.2.0/kafka_2.12-2.2.0.tgz
 src]# tar -xf kafka_2.12-2.2.0.tgz -C /opt/release/
 src]# ln -s /opt/release/kafka_2.12-2.2.0 /opt/apps/kafka

 ~]# vim /opt/apps/kafka/config/server.properties
 ~]# vim /opt/apps/kafka/config/server.properties
......
log.dirs=/data/kafka/logs
# More than 10000 logs are forced to brush the disk, and more than 1000ms are forced to brush the disk
log.flush.interval.messages=10000
log.flush.interval.ms=1000
# Fill in the address of the zookeeper cluster to which you want to connect, and connect to the local zk cluster at present.
zookeeper.connect=localhost:2181
# Add the following two items
delete.topic.enable=true
listeners=PLAINTEXT://172.16.0.21:9092
 # You need to start zookeeper before starting kafka
/opt/apps/kafka/bin/zookeeper-server-start.sh -daemon /opt/apps/kafka/config/zookeeper.properties
 ~]# mkdir -p /data/kafka/logs
 ~]# /opt/apps/kafka/bin/kafka-server-start.sh -daemon /opt/apps/kafka/config/server.properties
 ~]# netstat -lntp|grep 121952
tcp6       0      0 10.4.7.11:9092          :::*                    LISTEN      121952/java
tcp6       0      0 :::41211                :::*                    LISTEN      121952/java
# Query whether the topic of kafka is created successfully
/opt/apps/kafka/bin/kafka-topics.sh --list --zookeeper localhost:2181
Kafka Manager installation
Configure dockerfile
Kafka manager was renamed CMAK. The compressed package name and internal directory name were changed. Subsequent installation
# There are several problems:
# 1. Kafka manager was renamed CMAK, and the compressed package name and internal directory name were changed
# 2. sbt compilation needs to download a lot of dependencies. For indescribable reasons, the speed is very slow, and the personal non VPN network probably fails
# 3. The compilation failed because I do not have VPN conditions. Because of Article 1, the dockerfile probability needs to be modified
# 4. In the production environment, you must make a new one yourself!
FROM hseeberger/scala-sbt

ENV ZK_HOSTS=localhost:2181 \
    KM_VERSION=2.0.0.2

RUN mkdir -p /tmp && \
    cd /tmp && \
    wget https://github.com/yahoo/kafka-manager/archive/${KM_VERSION}.tar.gz && \
    tar xf ${KM_VERSION}.tar.gz && \
    cd /tmp/kafka-manager-${KM_VERSION} && \
    sbt clean dist && \
    unzip  -d / ./target/universal/kafka-manager-${KM_VERSION}.zip && \
    rm -fr /tmp/${KM_VERSION} /tmp/kafka-manager-${KM_VERSION}

WORKDIR /kafka-manager-${KM_VERSION}
EXPOSE 9000
ENTRYPOINT ["./bin/kafka-manager","-Dconfig.file=conf/application.conf"]
apiVersion: apps/v1
kind: Deployment
metadata:
  name: kafka-manager
  namespace: infra
  labels:
    name: kafka-manager
spec:
  replicas: 1
  selector:
    matchLabels:
      app: kafka-manager
  template:
    metadata:
      labels:
        app: kafka-manager
    spec:
      containers:
      - name: kafka-manager
        image: 172.16.1.10:8900/public/kafka-manager:v2.0.0.2
        ports:
        - containerPort: 9000
          protocol: TCP
        env:
        - name: ZK_HOSTS
          value: zk1.zoneyet.com:2181
        - name: APPLICATION_SECRET
          value: letmein
apiVersion: v1
kind: Service
metadata:
  name: kafka-manager
  namespace: infra
spec:
  ports:
  - protocol: TCP
    port: 9000
    targetPort: 9000
  selector:
    app: kafka-manager
apiVersion: extensions/v1beta1
kind: Ingress
metadata:
  name: kafka-manager
  namespace: infra
spec:
  rules:
  - host: kafka-manager.zoneyet.com
    http:
      paths:
      - path: /
        backend:
          serviceName: kafka-manager
          servicePort: 9000
Install filebeat
The log collection service uses filebeat because the traditional way of collecting logs in ruby consumes resources; Its and business services operate in the side car mode; Share logs in the business container by mounting volumes
ps:
- When containers are defined in the yaml file of k8s, the containers defined at the same time run in side car mode
- In docker's sidecar mode, the two containers share the network namespace, USER (USER namespace) and UTS (time), isolating IPC (process space) and file system
Note: it should be consistent with the elasticsearch version
Make image
# The downloaded compressed package in windows environment is directly added to the image https://artifacts.elastic.co/downloads/beats/filebeat/filebeat-7.4.0-linux-x86_64.tar.gz
FROM debian:jessie
ADD filebeat-7.4.0-linux-x86_64.tar.gz /opt/
RUN set -x && cp /opt/filebeat-*/filebeat /bin && rm -fr /opt/filebeat*
COPY entrypoint.sh /
ENTRYPOINT ["/entrypoint.sh"]
filebeat]# cat docker-entrypoint.sh
#!/bin/bash
ENV=${ENV:-"dev"}  # Operating environment
PROJ_NAME=${PROJ_NAME:-"no-define"}  # project name, related to topic
MULTILINE=${MULTILINE:-"^\d{2}"}     # Multi line matching is determined according to the log format
KAFKA_ADDR=${KAFKA_ADDR:-'"172.16.0.21:9092"'}
cat > /etc/filebeat.yaml << EOF
filebeat.inputs:
- type: log
  fields_under_root: true
  fields:
    topic: logm-${PROJ_NAME}
  paths:
    - /logm/*.log
    - /logm/*/*.log
    - /logm/*/*/*.log
    - /logm/*/*/*/*.log
    - /logm/*/*/*/*/*.log
  scan_frequency: 120s
  max_bytes: 10485760
  multiline.pattern: '$MULTILINE'
  multiline.negate: true
  multiline.match: after
  multiline.max_lines: 100
- type: log
  fields_under_root: true
  fields:
    topic: logu-${PROJ_NAME}
  paths:
    - /logu/*.log
    - /logu/*/*.log
    - /logu/*/*/*.log
    - /logu/*/*/*/*.log
    - /logu/*/*/*/*/*.log
    - /logu/*/*/*/*/*/*.log
output.kafka:
  hosts: [${KAFKA_ADDR}]
  topic: k8s-fb-$ENV-%{[topic]}
  version: 2.0.0
  required_acks: 0
  max_message_bytes: 10485760
EOF

set -xe

if [[ "$1" == "" ]]; then
     exec filebeat  -c /etc/filebeat.yaml
else
    exec "$@"
fi
docker build -t 172.16.1.10:8900/filebeat:v7.4.0. Create a docker image
docker push 172.16.1.10:8900/filebeat:v7.4.0 push image to warehouse
Configuring the log collection container filebeat in spinnaker
- Configure storage volumes of emptydir type; Mount the file under / logm to the configuration volume; Mount the logs of the business container to the storage volume;
- Configure environment variables. All environment variables in the filebeat.yaml configuration file can be configured into the container environment variables, with the project name $PROJ_NAME, environment name $ENV, MULTILINE matching regular rule $MULTILINE;
Deploy logstash
Version requirements: consistent with elasticsearch
Startup method: the development and production environments use docker run to start one copy respectively
Deployment steps:
# Download Image
~]# docker image pull logstash:6.8.3
~]# docker image tag logstash:6.8.3 172.16.1.10:8900/logstash:6.8.3
~]# docker image push 172.16.1.10:8900/logstash:6.8.3
cat /etc/logstash/logstash-dev.conf
input {
  kafka {
    bootstrap_servers => "172.16.0.21:9092"
    client_id => "172.16.0.21"
    consumer_threads => 4
    group_id => "k8s_dev"
    topics_pattern => "k8s-fb-dev-.*"
  }
}

filter {
  json {
    source => "message"
  }
}

output {
  elasticsearch {
    hosts => ["172.16.0.21:9200"]
    index => "k8s-dev-%{+YYYY.MM}"
  }
}

# Log collection for running logstash dev environment
docker run -d --name logstash-dev -v /etc/logstash:/etc/logstash 172.16.1.10:8900/logstash:v6.8.3 -f /etc/logstash/logstash-dev.conf
kibana deployment
~]# docker pull kibana:6.8.3
~]# docker image tag kibana:6.8.3 172.16.1.10:8900/kibana:6.8.3
~]# docker image push 172.16.1.10:8900/kibana:6.8.3
pd controller resource configuration manifest dp.yml file
apiVersion: apps/v1
kind: Deployment
metadata:
  name: kibana
  namespace: infra
  labels:
    name: kibana
spec:
  replicas: 1
  selector:
    matchLabels:
      name: kibana
  template:
    metadata:
      labels:
        app: kibana
        name: kibana
    spec:
      containers:
      - name: kibana
        image: 172.16.1.10:8900/kibana:6.8.3
        ports:
        - containerPort: 5601
          protocol: TCP
        env:
        - name: ELASTICSEARCH_URL
          value: http://172.16.0.21:9200
service resource configuration list svc.yml
apiVersion: v1
kind: Service
metadata:
  name: kibana
  namespace: infra
spec:
  ports:
  - protocol: TCP
    port: 80
    targetPort: 5601
  selector:
    app: kibana
Resource configuration list of ingress.yml
apiVersion: extensions/v1beta1
kind: Ingress
metadata:
  name: kibana
  namespace: infra
spec:
  rules:
  - host: kibana.zoneyet.com
    http:
      paths:
      - path: /
        backend:
          serviceName: kibana
          servicePort: 80
Application resource configuration list
Add kibana.zoneye.com domain name to bind9 service
kibana use
-
Initialize kibana and click Explore on my own; Assist in optimizing kibana and selecting NO; In the Monitoring option, click Turn On to start Monitoring, and you can query the status and index of es;
-
In Management, configure index, use the rule name of index created in logstash to match, and then select the default @ timestamp timestamp rule in kibana to create index patterns
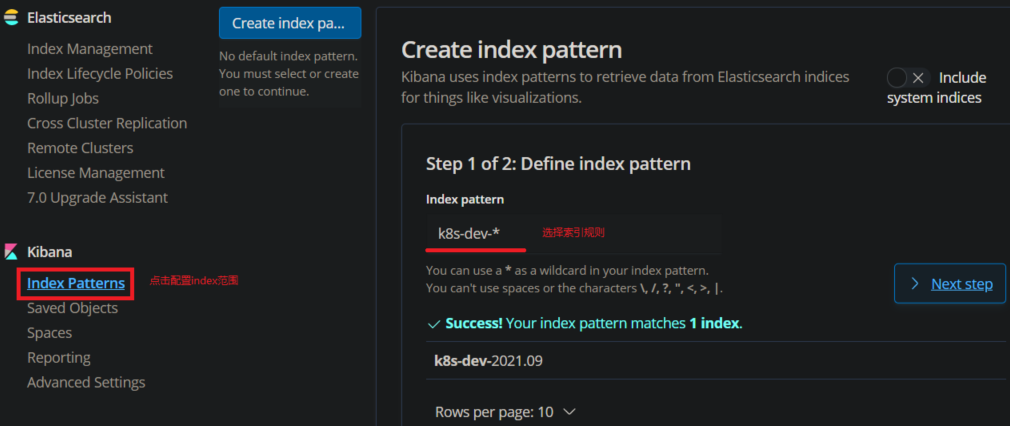
-
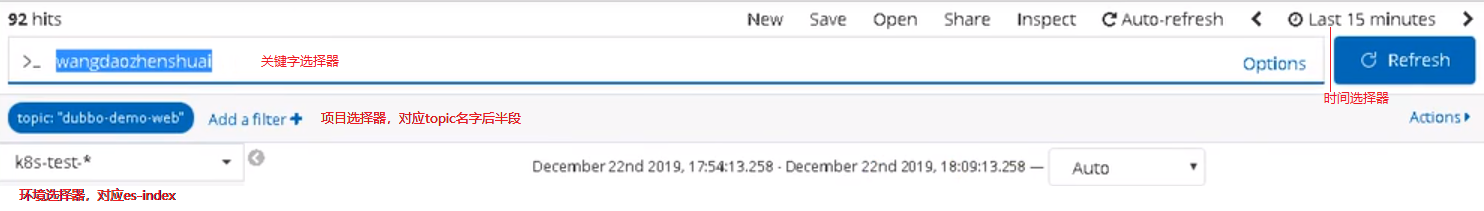
Look at the log, select Discover, and use the selector
- Time selector, quick, relative time, absolute time
- The environment selector (index selection) corresponds to the established index mapping
- The project selector (selection of topic), corresponding to the project name, is passed through the environment variable
- Keyword selector; Support query syntax of lusen
-
Configure common fields
Time, message, log.file.path, hostname -
The log of disk falling is directly collected by filebeat; If there are no logs falling from the disk, the unified output redirection command > > / opt / logs / *. Log 2 > & 1