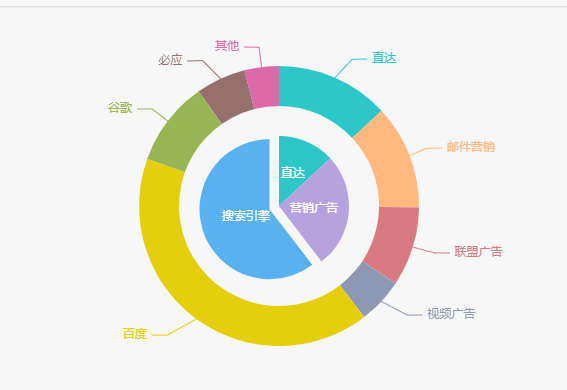
Nested pie charts are not much different from individual pie charts. One of the requirements is that if you use nested pie charts, you can only have one title and one legend, because although they are two pie charts, they are an echarts instance.

Attention should be paid to:
1. Pay attention to the relationship between the external pie chart and the internal pie chart. If the external pie chart is the subdivision of the internal pie chart, pay attention to the color matching of the internal and external pie chart.
2. Pay attention to the location of the label. The default label of the pie chart is outside. The nested pie chart makes the inner pie icon label better set inside.
myChart = echarts.init(document.getElementById(domeId));
                option = {
                    tooltip : {
                        trigger: 'item',
                        formatter: "{a} <br/>{b} : {c} ({d}%)"
                    },
                    legend: {
                        orient : 'horizontal',
                        x : 'center',
                        y: 'bottom',
                        data:[],
                        itemWidth: 14,
                        textStyle:{
                            color: '#ffffff'
                        },
                        type: 'scroll',
                        inactiveColor: '#333',
                        pageIconColor: '#3E88FF', //turn the next page of the triangle button color
                        pageIconInactiveColor: '#333', // page turning (that is, when page turning to the end)
                        pageIconSize: 14, //Page Flip Button Size
                        pageFormatter: '',//Hide the number of page flips
                    },
                    calculable : false,
                    series : [
                        {
                            name:name1,  //Name of inner ring
                            type:'pie',
                            selectedMode: 'single',
                            radius : [0, '30%'],
                            x: '20%',
                            width: '40%',
                            funnelAlign: 'right',
                            max: 1548,
                            itemStyle : {
                                normal : {
                                    label : {
                                        position : 'inner'
                                    },
                                    labelLine : {
                                        show : false
                                    },
                                    color:function(params) {
                                        //Custom color
                                        var colorList = innerColor;
                                        return colorList[params.dataIndex]
                                    },
                                }
                            },
                            data:[{name: "", value: 0}]
                        },
                        {
                            name:name2,  //Name of outer ring
                            type:'pie',
                            radius : ['50%', '60%'],
                            x: '40%',
                            width: '35%',
                            funnelAlign: 'left',
                            max: 1048,
                            itemStyle : {
                                normal : {
                                    color:function(params) {
                                        //Custom color
                                        var colorList = outColor;
                                        return colorList[params.dataIndex]
                                    }
                                }
                            },
                            data:[{name: "", value: 0}]
                        },
                    ]
                };
myChart.setOption(option);